Advances in Animal and Veterinary Sciences
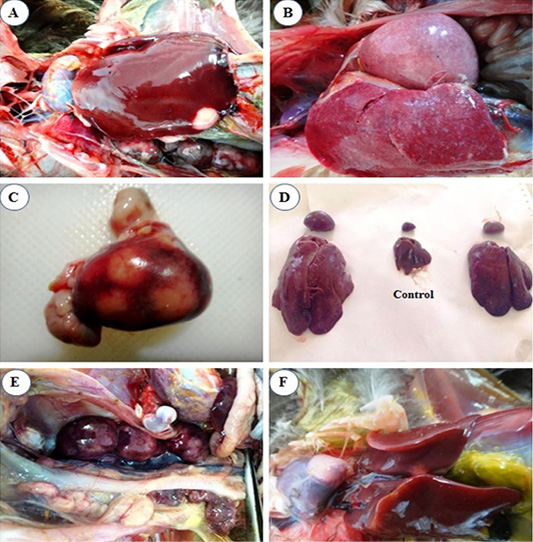
Macroscopic lesions from infected chicks with avian leucosis virus-J; (A) Liver at the 3rd month post infection (mpi), showing small white nodular growth on the border; (B) Liver and spleen at the 4th mpi, showing diffuse enlargement; (C) Spleen at the 5th mpi, showing severe enlargement with 3 nodular growths on surface; (D) Liver and spleen at the 5th mpi, showing severe diffuse enlargement (at left and right) and the control in the center; (E) Kidney at the 5th mpi, showing severe diffuse enlargement and (F) Heart at the 5th mpi, showing white nodular growth at the heart apex.
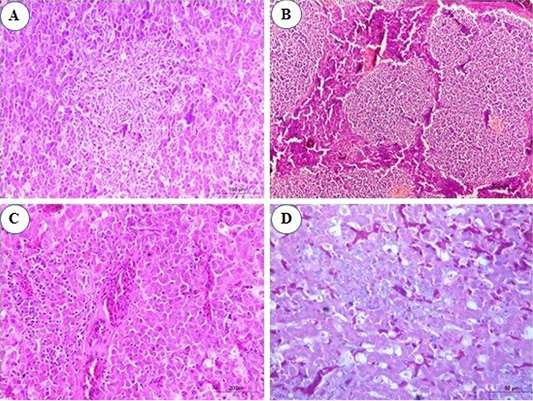
Photomicrograph from liver of chicken infected with avian leucosis virus type J during the experimental period; (A) At the 3rd month post infection (mpi), marked activation of Kupffer cells with aggregation of some reticular cell between hepatocytes (H and E, bar 100); (B) At the 4th mpi, expanding of neoplastic nodules, displacing and compressing surrounding parenchyma. The tumors are composed of pleomorphic lymphoid cells (H and E, bar 200); (C) At the 5th mpi, the hepatic parenchyma was compressed and replaced by immature myeloid cells (H and E, bar 50); (D) At the 4th mpi, focal aggregation of few myeloid cells with characteristic eosinophilic granules were noticed (Giemsa stain, bar 50).

Photomicrograph from spleen of chicken infected with avian leucosis virus type J during the experimental period; (A) At the 3rd month post infection (mpi), marked hyperplasia of ellipsoidal reticular cells at subcapsular sinuses (H and E, bar 100); (B) At the 4th mpi, collection of lymphocytes showing pleomorphism and mitotic activity (H and E, bar 20); (C) At the 5th mpi, pleomorphic lymphoid cells in splenic tissue with mitotic figures (H and E, bar 50) and (D) At the 4th mpi, few myeloid cells with eosinophilic granules (Giemsa stain, bar 20).
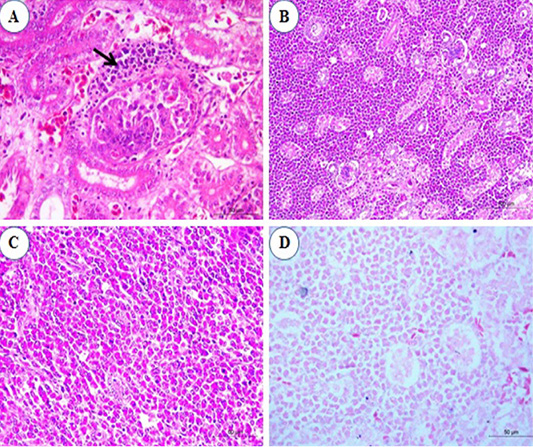
Photomicrograph from kidney of chicken infected with avian leucosis virus type J during the experimental period; (A) At the 3rd month post infection (mpi), periglomerular focal aggregation of pleomorphic lymphocytes (arrow) which showing mitotic activity (H and E, bar 50); (B) At the 4th mpi, heavy infiltration with myeloid cells that replace and compress the renal parenchyma (H and E, bar 100); (C) At the 5th mpi, diffuse infiltration of renal parenchyma by granulated myeloid cells. The renal tubules appear atrophied and completely loss of tubules (H and E, bar 50) and (D) At 5th mpi, diffuse infiltration of renal parenchyma by granulated myeloid cells (Geimsa stain, bar 50).
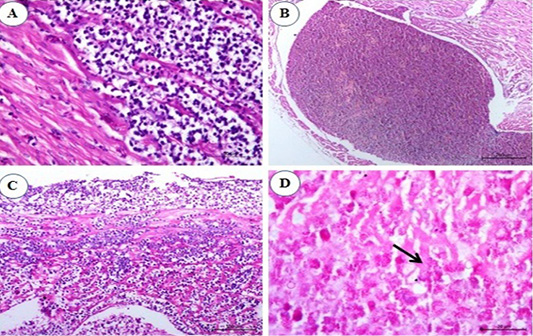
Photomicrograph from heart of chicken infected with avian leucosis virus type J during the experimental period; (A) At the 1st and 2nd month post infection (mpi), focal lymphocytic aggregation between muscle bundles of myocardium. The lymphocytes showing pleomorphism and mitosis (H and E bar 50); (B) At the 3rd mpi, severely dilated engorged coronary packed with numerous erythroblasts. Hemosiderin deposits could be observed (H and E bar 100); (C) At the 4th mpi, massive infiltration of myocardium with leucocytes which compress the myocardial fibers causing its atrophy, degeneration and dissociation. The lymphocytes show pleomorphism (H and E bar 100) and (D) At the 5th mpi, massive infiltration of myocardium by myeloid cells (arrow) with eosinophilic granules (Giemsa stain bar 20).
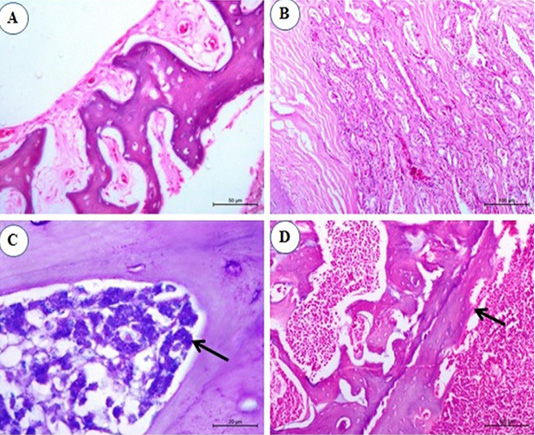
Photomicrograph from sternal bone of chicken infected with avian leucosis virus type J during the experimental period; (A) At the 1st and 2nd month post infection (mpi), normal sternal bone with normal periostium (H and E bar 50); (B) At the 3rd mpi, acinar structure with hyperplasia of cell wall with newly formed acini (H and E bar 100); (C) At the 4th mpi, increasing numbers of granulated myeloid cells (arrow) (Giemsa stain bar 20) and (D) At the 5th mpi, osteopetrosis with dentation in the periostium (arrow) (H and E bar 100).
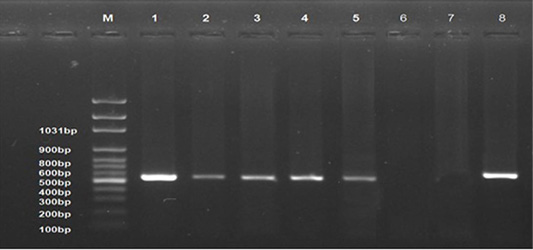
Ethidium bromide stained 1% agarose gel of PCR products showed avian leucosis virus type J (+ve) samples at different experimental periods, (lanes 1-5) of 545 bp PCR products, (-ve) normal control sample (lane 6), and (-ve) control (Lane 7) and (+ve) control (Lane 8). M represents a 100-bp ladder as a size standard.


