Advances in Animal and Veterinary Sciences
Research Article

Growth Performance, Morphological and Chemical Characteristics of Red Tilapia Fed Diets Supplemented with Dunaliella salina
Abdelwahab M. Abdelwahab1,2*, Ahmad Al-Madani1, Ibrahim Y. Almohsen1
1Department of Animal and Fish Production, College of Agriculture and Food Sciences, King Faisal University, Saudi Arabia; 2Department of Animal Production, Faculty of Agriculture, Fayoum University, Egypt.
Abstract | The aims of the present study were to investigate growth performances, morphological and chemical body characteristics, blood profiles of Red Tilapia upon dietary Dunaliella salina (D. salina) supplementation. Control and D. salina diets were formulated isonitrogenous and isoenergetic (339.99±0.02 g/kg & 4.5 ± 0.0028 Kcal/g, respectively) and fed during the study. The formulated diets were control diet and D. salina diets supplemented with 33.0, 66.0 and 100% and fed thrice a day to fish (14.37±0.15 g g) for fourteen weeks in 16 tanks containing 30 fish in each. Body weight gain, feed efficiency and morphological and chemical body characteristics of treated D. salina fish were determined in addition to changes in flesh color and blood profiles (red blood cells, hematocrit, glucose and total protein) compared to control one. The results indicated that replacement of fish meal with 33.0% D. salina resulted in comparable results with control diet concerning body weight gain, feed efficiency, morphological and chemical body composition and blood profiles. Diet containing 33% of D. salina had no significant effect in protein productive value when compared to control diet versus 66 and 100% D. salina diets, which decreased the parameter. Productive value of energy was not differed (P > 0.05) between control and D. salina treated groups. On the other hand, the high levels of D. salina (66.0 & 100%) were mostly decreased all the recorded parameters compared to control and 33.0% D. salina diets except body fat content and flesh color, which were significantly (P < 0.05) improved. In conclusion, replacement of fish meal with 33.0% D. salina could be promising of Red Tilapia growth performances, feed efficiency and chemical characteristics.
Keywords | Dunaliella salina, Red Tilapia, Blood, Growth, Flesh color
Received | October 30, 2019; Accepted | January 17, 2020; Published | May 02, 2020
*Correspondence | Abdelwahab M Abdelwahab, Department of Animal and Fish Production, College of Agriculture and Food Sciences, King Faisal University, Saudi Arabia; Email: amsaid@kfu.edu.sa
Citation | Abdelwahab AM, Al-Madani A, Almohsen IY (2020). Growth performance, morphological and chemical characteristics of red tilapia fed diets supplemented with dunaliella salina. Adv. Anim. Vet. Sci. 8(5): 536-542.
DOI | http://dx.doi.org/10.17582/journal.aavs/2020/8.5.536.542
ISSN (Online) | 2307-8316; ISSN (Print) | 2309-3331
Copyright © 2020 Abdelwahab et al. This is an open access article distributed under the Creative Commons Attribution License, which permits unrestricted use, distribution, and reproduction in any medium, provided the original work is properly cited.
INTRODUCTION
Recent interest has grown for the use of Dunaliella salina (D. salina) as a novel feed supplement for nutritional purposes (Senosy et al., 2017; Mohammed, 2018a) or detoxification and chelating of toxic and heavy metals. D. salina grant various health effects to the humans and animals as well. D. salina because of its content of high β-carotene can protect against CNS oxygen toxicity (Bitterman et al., 1994) and gastrointestinal inflammation (Lavy et al., 2003) through anticancer and antioxidant properties (Krinsky, 1988). Moreover, D. salina has immunomodulatory and anti-inflammatory effects (Hemmingson et al., 2006; Abdel-Daim et al., 2015).
D. salina as feed supplement were investigated in different species of fish for its effects on growth performances, fecundity and hematological parameters. Alishahi et al., (2013) investigated the hemato-immunological responses of Heros severus fed diets supplemented with D. salina. They found that D. salina were positively affected the growth, immunological and hematological parameters. In addition, the effects of dietary D. salina extract on the fecundity and lipid content of pond-reared Penaeus japonicus brood-stock were explored (El-Bermawi et al., 2013). The results indicated that D. salina extract might play role in stress tolerance and reproductive performance of beta-carotene content. Recently, biotechnological interests of D.sa
Table 1: Ingredients (g/kg) and chemical composition of control and Dunaliella salina (DS) formulated diets used during the study
| Parameters | Control | DS 33% | DS 66% | DS 100% |
| Fish powder | 169.60 | 115.60 | 57.60 | 0.00 |
| Soybean | 280.80 | 284.70 | 296.30 | 310.00 |
| Gluten | 100.00 | 100.00 | 100.00 | 100.00 |
| Maize | 210.00 | 200.00 | 200.00 | 220.00 |
| Wheat Bran | 150.00 | 134.00 | 106.60 | 54.70 |
| D. salina | 0.00 | 70.70 | 141.50 | 214.30 |
| Fish oil | 64.60 | 70.00 | 73.00 | 76.00 |
|
Calcium diphosphate |
5.00 | 5.00 | 5.00 | 5.00 |
| Minerals & vitamins | 5.00 | 5.00 | 5.00 | 5.00 |
| Sodium choloride | 10.00 | 10.00 | 10.00 | 10.00 |
| Limestone | 5.00 | 5.00 | 5.00 | 5.00 |
|
Total |
1000 | 1000 | 1000 | 1000 |
|
Chemical composition |
||||
| Dry matter, % | 93.79 | 93.49 | 93.19 | 92.84 |
|
Crude protein, % |
34.00 | 34.00 | 34.00 | 34.00 |
|
Fat, % |
10.48 | 11.00 | 11.26 | 11.56 |
|
Crude fiber, % |
3.38 | 3.58 | 3.76 | 3.87 |
|
Ash, % |
7.11 | 7.15 | 7.15 | 7.06 |
|
Nitrogen-free extract, % |
38.82 | 37.76 | 37.01 | 36.35 |
|
Energy, |
4.50 | 4.51 | 4.50 |
4.50 |
Table 2: Concentrations of minerals and vitamins mixtures per kilogram feed
| Minerals | Mg/kg |
| Calcium phosphate dihydrogen | 727.7775 |
|
Magnesium sulfate |
127.50 |
|
Calcium carbonate |
84.7225 |
|
Sodium chloride |
60.0 |
| Vitamins |
IU or mg/kg |
| Vitamin A (IU/kg) | 2000000 |
|
Vitamin D (IU/kg) |
300000 |
|
Vitamin E (IU/kg) |
40000 |
|
Vitamin C (mg/kg) |
60000 |
|
Vitamin K (mg/kg) |
1200 |
|
Vitamin B1 (mg/kg) |
4000 |
|
Vitamin B2 (mg/kg) |
4000 |
|
Vitamin B6 (mg/kg) |
2400 |
|
Vitamin B12 (mg/kg) |
10 |
|
Niacin (mg/kg) |
24000 |
|
Folic acid (mg/kg) |
800 |
|
Pantothenic acid |
5000 |
|
Biotin (mg/kg) |
200 |
|
Antioxidant (mg/kg) |
20000 |
|
Cobalt (mg/kg) |
200 |
|
Copper (mg/kg) |
1000 |
|
Iron (mg/kg) |
4000 |
|
Manganese (mg/kg) |
15000 |
|
Selenium (mg/kg) |
20 |
|
Zinc (mg/kg) |
15000 |
Table 3: Growth performance of Red Tilapia fed diet supplemented with Dunaliella salina
| Parameters | Control | DS 33% | DS 66% | DS 100% |
| Initial body weight (g/kg) | 12.35±0.10 | 12.49±0.17 | 12.32±0.21 | 12.45±0.19 |
| Final body weight (g/kg) |
42.51±0.20a |
39.46±0.11b |
37.52±0.19c |
36.87±1.07c |
| Body weight gain (g/fish) |
30.17±0.11a |
26.97±0.14b |
24.53±1.17c |
24.42±1.02c |
| Body weight, % |
244.32±1.33a |
216.02±4.01b |
204.53±4.88c |
196.19±4.16c |
| Daily body weight gain (g/fish) |
0.36 ±0.00a |
0.32±0.002b |
0.29 ±0.01c |
0.29 ±0.01c |
| Specific growth rate |
1.47±0.005a |
1.37±0.02b |
1.32±0.04c |
1.29±0.03c |
| Survival rate, % | 85.56±6.94 | 83.33±6.67 | 85.56±7.70 |
80.00±5.77 |
a,b,c; Values with different superscripts between DS (D. salina) and control groups significantly differed at P < 0.05.
Table 4: Feed efficiency of Red Tilapia fed diet supplemented with Dunaliella salina
| Parameters | Control | DS 33% | DS 66% | DS 100% |
| Average daily feed intake, g |
44.33±1.02a |
41.31±0.87b |
40.07±0.56c |
37.69±0.49d |
| Average dry daily feed intake, g |
41.58±0.95a |
38.74±0.82b |
37.58±0.53c |
35.35±0.46d |
| Daily feed intake, g |
2.2± 0.06a |
2.16 ± 0.05b |
2.19±0.03c |
2.08±0.04d |
| Feed efficiency, % |
68.07± 1.8a |
65.31± 1.06b |
62.88±0.54b |
64.79± 2.67b |
| Feed conversion |
1.38±0.04b |
1.44±0.02a |
1.49±0.01a |
1.45± 0.06a |
| Protein | ||||
| Protein efficiency |
2.0 ± 0.05a |
1.91±0.03ab |
1.84 ± 0.01b |
1.89± 0.04b |
| Protein productive value |
30.11 ± 0.92a |
29.29± 1.72ab |
25.45±1.71b |
25.30± 0.72b |
| Energy | ||||
| Energy efficiency |
15.12 ± 0.40a |
14.45± 0.23ab |
13.88±0.1b |
14.24± 0.34b |
| Energy productive value |
23.22 ± 1.40a |
23.16±1.48a |
22.12±0.27a |
23.27±1.32a |
a,b,c,d; Values with different superscripts between DS (D. salina) and control groups significantly differed at P < 0.05.
-lina extracts have been arisen and explored. Gallego-Cartagena et al. (2019) investigated the effect of stressful conditions on the carotenogenic activity of a Colombian strain of Dunaliella salina. The microalga accumulates high concentrations of b-carotene as an antioxidant photoprotector and glycerol as an ormoregulatory agent (El-Baky et al., 2004).
Flesh color of fish is the first quality evaluated by consumers, and is therefore an important component of quality relevant to market acceptance (Ünal Şengör et al., 2019). Therefore, the effects of D. salina on Red Tilapia flesh color were determined in this study. In addition, blood profiles (RBC, PCV, glucose and TP) (Mohammed, 2018 a) as indicative of health were determined. Therefore, the aims of the present study were to investigate growth performances, morphological and chemical characteristics of Red Tilapia upon dietary D. salina (DS) supplementation (33.0, 66.0 & 100.0%).
MATERIALS AND METHODS
Site of Study and Management
The study was conducted according to procedures approved by the Ethics Committee of Animal Experimentation of King Faisal University, Saudi Arabi from March to June 2019. Fingerlings of Red tilapia fish were obtained from the Saudi fish farm. The fingerlings were allowed to adapt for two weeks, weighed using digital balance (Chyo Petit Balance MK-500C-Japan) (14.37±0.15 g) and distributed randomly to four groups. Fish were kept controlled under 12 cycle of light and 12 dark period. The controlled temperature and relative humidity during the experimental period were 27.0 ±3ºC and 60.0 ±10%, respectively. Fish were fed control diet or diets supplemented with D. salina (33.0, 66.0 & 100.0) twice or three times a day for 14 wk. Ingredients (g/kg) and chemical composition (%) of control and Dunaliella salina (DS) formulated diets used during the study were shown in Table (1 and 2). The recorded parameters of water quality during the study were 7.5-8.4 mg/L dissolved oxygen, 6.5-7.2 pH, 27-29 °C temperature, and <0.002 mg/L total ammonia.
Growth Performance and Feed Efficiency
Body weight were recorded biweekly using digital balance (Chyo Petit Balance MK-500C-Japan). Fish were anesthetized using 0.1 g/l Tricainemethane sulfonate and dried before weighing. Body weight gain were determined using by subtracting final body weight from initial body weight. Tanks were cleaned before feeding using symphony system. Diets were offered three time per day at 7.0 and 11.0 am and 2.30 pm. Feed efficiency was calculated by dividing feed intake to body weight gain (Table 3 and 4).
Chemical Analysis of Diets and Fish
Ingredients of diets and fish samples were dried at 70°C in air oven for constant weight. Both diets and fish samples were ground and analyzed for determination of dry matter (DM), organic matter (OM), crude protein (CP), crude fibers (CF) and ether extract (EE) components (Van keulen & Young, 1977) (Table 1 and 5).
Blood Sample Collection and Analysis
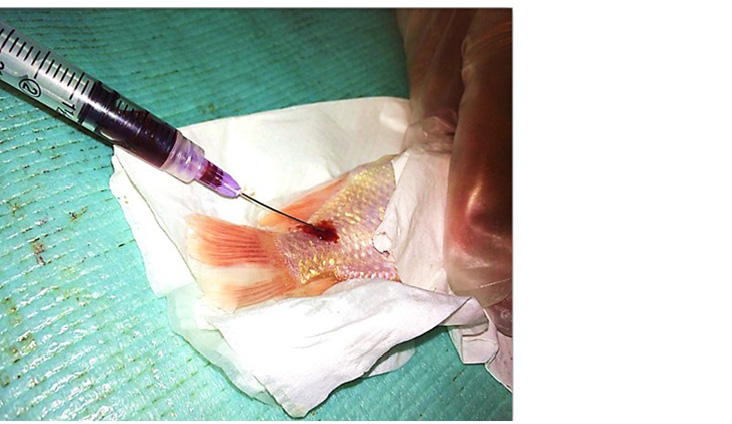
Blood samples were collected from the caudal vein of three fish of each treatment at the end of experimental period (Figure 1). The hematological parameters including (erythrocyte counts [RBC], total leucocyte counts [WBC], and packed cells volume [PCV]) were determined using a methodology of Hepler (1966). In addition, glucose and total protein concentrations were determined (Mohammed et al., 2018; Mohammed 2018 a, b).
Color Measurements of Fish Minces
Color measurements of fish flesh minces were carried out using Hunter according to method of Young and Whittle (1985). Mince color examination of L, a and b values are used to illustrate color differences between samples.
Statistical Analysis
Statistical analysis was done according to general linear model (GLM) of SAS program (2008). Differences between control and D. salina treated groups (33.0, 66.0 & 100.0%) were evaluated in growth performance, morphological and chemical body characteristics of fish, blood profiles by one-way ANOVA. Duncan Multiple Range Test was used to test the effect of treatments (Steel and Torrie, 1980). The data were presented as mean ± SEM. Level of significance was set at P < 0.05. Statistical model as follow:
Yij= µ + Ti + Eij
Where: Yij= the experimental observation ij, µ =the overall mean, Ti = the effect due to treatment i., Eij = the experimental error.
RESULTS
Growth Performance and Feed Efficiency
Growth performance and feed efficiency due to feeding 33, 66, and 100% of D. salina to Red tilapia fish were presented in Tables (3-4). Results showed a significant decrease (p<0.05) in most of growth performance parameters of D. salina groups compared to control one, except survival rate, which was not differed (p>0.05) among groups. Furthermore, no significant difference (p<0.05) was obtained in the length-weight relationship, fish depth and conditional factor of 33, 66, and 100% D. salina groups compared to the control one (Tables 3-4). Supplementing 33, 66, and 100% of D. salina resulted in a significant decrease (p<0.05) in feed intake, feed efficiency compared to the control diet. Diet containing 33% of D. salina had no significant effect in protein productive value when compared with control diet versus 66 and 100% D. salina diets, which decreased the parameters. Productive value of energy was not differed (P >0.05) among control and D. salina treated groups.
Chemical Composition Characteristics
Chemical composition characteristics of Red tilapia fish upon feeding 33, 66, and 100% of D. salina compared to control were presented in Table (5). In term of fish chemical component parameters, adding 33, 66, and 100% of D. salina resulted in no differences (p > 0.05) in values of dry matter, protein, ash and energy. However, values of fat were significantly increased when fish fed 66 and 100% of D. salina compared to the control diet.
Morphological Characteristics
Morphological characteristics due to feeding 33, 66, and 100% of D. salina to Red tilapia fish compared to control
Table 5: Chemical body composition of Red Tilapia fed diet supplemented with Dunaliella salina
| Parameters | Control | DS 33% | DS 66% | DS 100% |
| Moisture, % |
72.41±0.42a |
72.33±0.36a |
72.57±1.01a |
72.21±1.03a |
| Dry matter, % |
27.59±0.36a |
27.67±1.01a |
27.43±1.03a |
27.79±0.54a |
| Protein, % |
15.28±0.07a |
15.48±1.00a |
14.51±1.15a |
14.26±0.63a |
| Fat, % |
7.53±0.19c |
7.94±0.46bc |
8.46±0.55ab |
8.90±0.54a |
| Ash, % |
4.78 ± 0.19a |
4.26±0.13 |
4.45±0.43a |
4.63±0.29a |
| Energy, Calorie |
1.57 ± 0.02a |
1.62±0.05a |
1.62±0.01a |
1.64±0.02a |
| Energy, K Jole |
6.53±0.09a |
6.73±0.22a |
6.71±0.06a |
6.83±0.17a |
a,b,c; Values with different superscripts between DS (D. salina) and control groups significantly differed at P < 0.05.
Table 6: Morphological characteristics of Red Tilapia fed diet supplemented with Dunaliella salina
| Parameters | Control | DS 33% | DS 66% | DS 100% |
|
Body weight, g |
27.06±5.65a |
25.70±5.58ab |
24.39±4.29b |
21.8±3.22c |
| Total length, cm |
11.75±0.79a |
11.56±0.77ab |
11.37±0.67bc |
11.11±0.51c |
| Standard length, cm |
9.70±0.69a |
9.48±0.67ab |
9.40±0.52bc |
9.16±0.46c |
| Body depth, cm |
3.29±0.20a |
3.23±0.24a |
3.13±0.15b |
3.04±0.13c |
| Body thickness, |
1.69±0.15a |
1.64±0.19ab |
1.69±0.13a |
1.59±0.10b |
| Conditional factor | 1.65±0.15 | 1.64±0.17 | 1.65±0.15 |
1.58±0.14 |
a,b,c; Values with different superscripts between DS (D. salina) and control groups significantly differed at P < 0.05.
Table 7: Blood parameters of Red Tilapia fed diet supplemented with Dunaliella salina
| Parameters | Control | DS 33% | DS 66% | DS 100% |
|
Red blood cell, 106 |
2.81±0.37 | 2.72±0.28 | 2.75±0.32 | 2.78±0.29 |
| Packed cell volume, % | 29.50±2.78 | 28.73±2.51 | 29.133±3.83 | 29.67±3.21 |
| Glucose, mg/100 ml | 45.33±5.13 | 47.33±4.62 | 52.67±4.51 | 45.33±4.51 |
| Total protein, g/100 ml | 4.30±0.44 | 4.30±0.70 | 4.60±1.20 | 5.00±0.40 |
DS, D. salina
Table 8: Flesh coloration of Red Tilapia fed diet supplemented with Dunaliella salina
| Parameters | Control | DS 33% | DS 66% | DS 100% |
| Lightness |
58.08±2.26a |
55.14±2.76ab |
56.91±2.45a |
53.66±2.27b |
| Redness |
6.31±1.07b |
8.92±1.27a |
8.66±1.65a |
8.55±1.04a |
| Yellowness |
16.42±0.21ab |
16.25±1.23ab |
17.09±0.57a |
15.87±0.47b |
a,b,; Values with different superscripts between DS (D. salina) and control groups significantly differed at P < 0.05.
were presented in Table (6). The results showed that total length (cm), body depth (cm), and body thickness (cm) were significantly the lowest in 100% D. salina groups compared to the other groups, as well as conditional factor were found (P > 0.05) the lowest in 100% DS group.
Blood Profiles
Blood profiles values (RBCs, Ht, glucose, TP) upon feeding 33, 66, and 100% of D. salina to Red tilapia fish compared to control were presented in Table (7). Results showed that adding 33, 66, and 100% of D. salina did not show any significant effect (p<0.05) in red blood cell values, hematocrit, total protein and glucose concentrations when compared to control diet.
Color Measurements of Fish Minces
Fish minces coloration parameters upon feeding 33, 66, and 100% of D. salina to Red tilapia fish compared to control diet were presented in Table (8). Results showed that 100% D. salina diet caused a significant effect (p<0.05) in term of white flesh compared to control diet. There was a chronologically gradual in white color of fish minces. The highest was in the control group followed by 66, 33, and 100% groups, respectively. The diet containing 100% of D. salina caused a significant change in turning from whitish to yellowish flesh when compared with the control diet.
DISCUSSIONS
The need to continuous supplements of nutrients and feed inputs is required for the growth of aquaculture sector (Mustafa and Nakagawa 1995; Tacon et al., 2011) to meet the increase in human population. Several studies in the last decades were carried out using feed ingredients for farmed fish and crustaceans as protein source e.g. D. salina. Results of the current study demonstrated the effects of 33.0, 66.0 & 100% D. salina supplementation on Red Tilapia growth performances, feed efficiency, morphological and chemical body characteristics, flesh color and blood profiles (Table 3-8). The results indicated that replacement of fish meal with D. salina at low level (33.0%) resulted in comparable results with control diet concerning body weight gain, feed efficiency, morphological and chemical body characteristics and blood profiles. On the other hand, the high levels of D. salina (66.0 & 100) were mostly decreased the recorded parameters compared to control group except fat content and flesh color, which were significantly (P < 0.05) improved. The negative effects of 66.0 and 100.0% D. salina supplementation compared to control and 33.0% D. salina diets on growth performances and feed efficiency might be attributed to palatability problems (Walker and Berlinsky 2011) in addition to imbalances in diet components. Numbers of studies (Xu et al., 1993; Mustafa et al., 1995) were indicated improvement of body fat contents due to algae feeding as in 66.0 & 100.0% D. salina groups of this study.
The survival rate and productive value of energy was not differed (P >0.05) among control and D. salina treated groups in this study. Algae of D. salina has high levels of beta-carotene, glycerol, protein and other fine chemicals (Gouveia et al., 2008; Ghasemi et al., 2011; Wichuk et al., 2014; Cuellar-Bermudez et al., 2015; Gong and Bassi, 2016). Chemical composition of D. salina algae indicated 8.47% moisture, 54.17% crude protein, 0.80% fiber, 11.42% total lipid, 18.47% ether extract and 6.67% ash (Mohammed 2018 b). The effects of partial replacement of fish meal protein by microalgae on body growth, feed intake, and body composition of Atlantic cod were investigated by Walker and Berlinsky (2011). They found no differences in survival and feed conversion ratios whereas feed intake and growth were significantly reduced in the algae-fed fish. In addition, feed intake improved in the 15% algae-fed fish compared to those fed the diet with 30% replacement. Alishahi et al. (2013) investigated the immunological responses of Heros severus fed diet supplemented with D. salina. They found that D. salina were positively affected the immunological parameters, which might be attributed to the comparable survival rate of control and D. salina groups in our study. The non-significant changes of fish survival rate between control and D. salina groups has been confirmed through blood profiles (RBC, PCV, glucose and TP) as indicative of fish health (Table 8) in this study.
Flesh color of fish is the first quality parameter evaluated by consumers, and is therefore an important component of quality relevant to market acceptance (Ünal Şengör et al., 2019). The significant improvement of flesh color due to 66.0 and 100.0% D. salina supplementation compared to control and 33.0% DS diets were obtained in this study, which might be attributed to pigment content of D. salina. Pigment contents of algae like, chlorophylls, carotenoids, phycobiliproteins, xanthophylls were confirmed (Roy and Ruma, 2014). Lipophilic pigments such as chlorophylls and carotenoids constitute 3–5 % of the dry algal biomass (Venkataraman and Becker, 1985).
CONCLUSION
Supplementation of D. salina could be promising of Red Tilapia growth performances, feed efficiency and body chemical characteristics at level 33.0% or low.
ACKNOWLEDGMENTS
The authors want to thank and acknowledge Deanship of Scientific Research, King Faisal University, Saudi Arabia for funding and support.
CONFLICTS OF INTEREST
There is no conflict of interest of this article to declare.
authors contribution
All authors contributed equally.
REFERENCES


