Advances in Animal and Veterinary Sciences
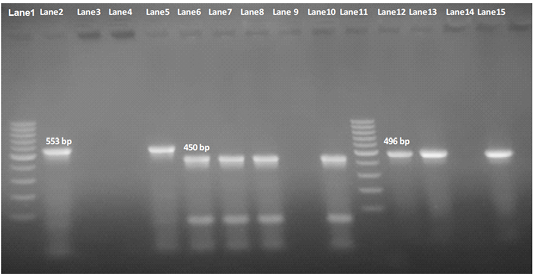
Agarose Gel Electrophoresis (AGE) showing PCR Products of E.Coli different genes.
Lane 1 and Lane 11: 100 bp marker; Lane 2, 3, 4 and 5: 553 bp PCR Products of E. coli iroN gene; Lane 6,7, 8 and 10: 450 bp PCR Products of E. coli hlyF gene; Lane 12, 13, 14and 15: 496 bp PCR Products of E. coli ompT gene; NB: iroN gene not included in both O1 and O26 E .coli isolates (Lane 3 and 4 are negative), as well as ompT not included in O26 E. coli in O2 E. coli isolate e(Lane 14 is negative).
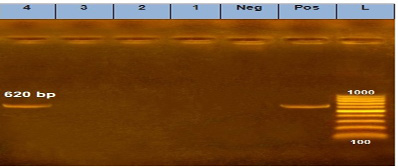
Agarose Gel Electrophoresis (AGE) showing PCR Products of E. coli different genes:
Lane (L): 100 bp marker. Lane 1, 2, 3 and 4: 620 bp PCR products of E. coli tsh gene.
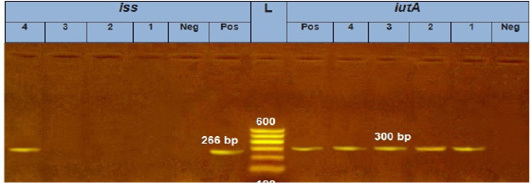
Agarose Gel Electrophoresis (AGE) showing PCR Products of E. coli different genes:
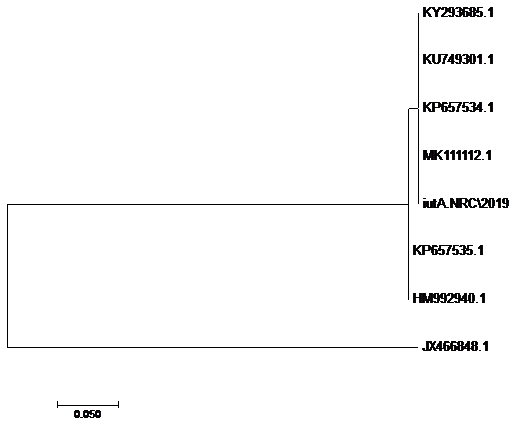
Lane (L): 100 bp marker; Lane 1, 2, 3 and 4 (left): 266 bp PCR products of E.coli iss gene; Lane 1, 2, 3 and 4 (Right): 300 bp PCR products of E.coli iutA gene.
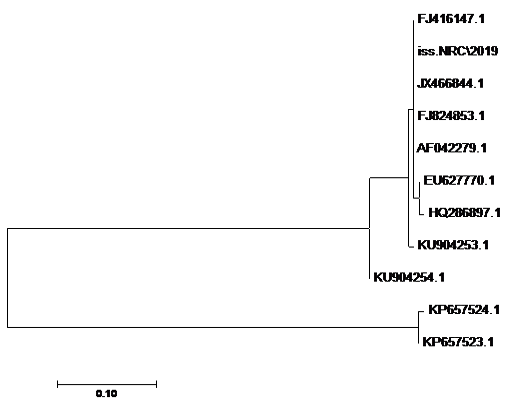
Phylogenetic tree of iss gene of avian pathogenic
E. coli serogroup O78b isolate.
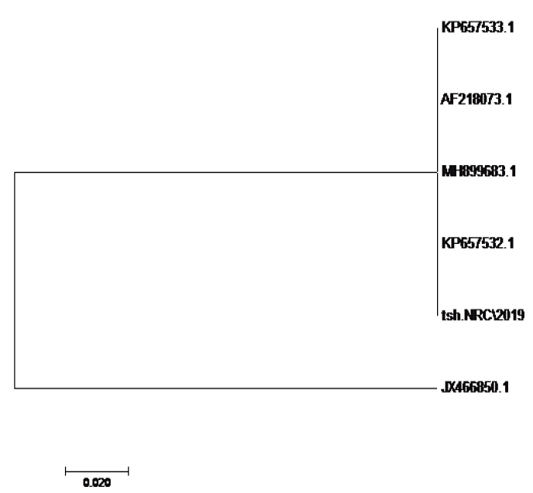
Phylogenetic tree of tsh gene of avian pathogenic E. coli serogroup O78b isolate.
Phylogenetic tree of tsh gene of avian pathogenic E. coli serogroup O78b isolate.


