Advances in Animal and Veterinary Sciences
Research Article

Classification and Regression Tree (CRT) Analysis to Predict Body Weight of Potchefstroom Koekoek Laying Hens
Thobela Louis Tyasi1*, Kgotlelelo Maaposo Makgowo1, Kwena Mokoena1, Lebo Trudy Rashijane1, Madumetja Cyril Mathapo1, Lebogang William Danguru1, Kagisho Madikadike Molabe1, Paul Mogowe Bopape1, Nhlakanipho Divine Mathye1, Dannis Maluleke1, Busisiwe Gunya1, Masibonge Gxasheka2
1School of Agricultural & Environmental Sciences, Department of Agricultural Economics and Animal Production, University of Limpopo, Private Bag X1106, Sovenga 0727, Limpopo, South Africa; 2School of Agricultural & Environmental Sciences, Department of Plant Production, Soil Science & Agricultural Engineering, University of Limpopo, Private Bag X1106, Sovenga 0727, Limpopo, South Africa.
Abstract | Classification and regression tree analysis is a powerful statistical technique which helps to determine the most important variables in a particular dataset and helps to create a model. The study was conducted to identify linear body measurement traits (beak length, body length, keel length, chest circumference, toe length, body girth, shank length, back length, shank circumference and wing length) which could be employed in developing an effective prediction equation for body weight of Potchefstroom Koekoek laying hens. Eighty Potchefstroom Koekoek laying hens at twenty two weeks old were used. Pearson’s correlation together with classification and regression tree (CRT) methods were used for analysis. Descriptive statistics indicated that mean of body weight was 1.50 kg. Correlation findings revealed that body weight was positively significantly correlated (P < 0.05) with beak length (r = 0.23) and toe length (r = 0.21), respectively. CRT results demonstrated that beak length, wing length and back length play an important role in the body weight of Potchefstroom Koekoek laying hen chickens. This study suggests that body weight of laying hens could be estimated by some linear body measurement traits. The models established in the current study might be employed by chicken farmers when making selection during breeding to improve body weight. However, further studies need to be done to validate the use of classification and regression tree analysis in prediction of body weight from linear body measurement traits of chickens.
Keywords | Back length, Beak length, Body measurements, Correlation, Wing length
Received | November 21, 2019; Accepted | February 17, 2020; Published | March 20, 2020
*Correspondence | Thobela Louis Tyasi, School of Agricultural & Environmental Sciences, Department of Agricultural Economics and Animal Production, University of Limpopo, Private Bag X1106, Sovenga 0727, Limpopo, South Africa; Email: louis.tyasi@ul.ac.za
Citation | Tyasi TL, Makgowo KM, Mokoena K, Rashijane LT, Mathapo MC, Danguru LW, Molabe KM, Bopape PM, Mathye ND, Maluleke D, Gunya B, Gxasheka M (2020). Classification and regression tree (crt) analysis to predict body weight of potchefstroom koekoek laying hens. Adv. Anim. Vet. Sci. 8(4): 354-359.
DOI | http://dx.doi.org/10.17582/journal.aavs/2020/8.4.354.359
ISSN (Online) | 2307-8316; ISSN (Print) | 2309-3331
Copyright © 2020 Tyasi et al. This is an open access article distributed under the Creative Commons Attribution License, which permits unrestricted use, distribution, and reproduction in any medium, provided the original work is properly cited.
INTRODUCTION
Potchefstroom Koekoek chicken genotype was developed from crossbreeding three chicken genotypes namely White Leghorn, Black Australorp and Bared Plymouth Rock (Tyasi et al., 2019; Mutibvu et al., 2019). This chicken genotype has gender-specific feather colour and patterns, which make it easy for sexing of day-old chicks (Heit, 2017). According to Dessie and Gatachew (2016), this chicken genotype is well acclimatized to the tropical regions which enable it to thrive in many of hot environment of the African countries, and is suitable for free-range production system and can also thrive and perform highly in small-scale rearing system.
Classification and regression tree (CRT) is a data mining algorithm commonly used where the dependent variable is categorical which help to identify the class within which a dependent variable fall into, and also used where the dependent variable is continuous which help to predict the value (Mohamad et al., 2012). According to Aytekin et al. (2018), CRT is a statistical technique which is applicable in different forms of data including continuous, ordinal and nominal variables. Based on our knowledge, there is limited information about the estimation of body weight from linear body measurement traits using regression tree data mining algorithms. Body weight and body measurement traits are important characteristics to chicken breeders and processors (Ojo et al., 2014). Body weight plays a vital function in discovering some economic traits in farm livestock (Ojedapo, 2013). Linear body measurement traits have been indicated as the good predictor of body weight in different chicken genotypes including Chinese indigenous Dagu chicken genotype (Tyasi et al., 2017), Uganda indigenous chickens (Semakula et al., 2011), Senegal indigenous chickens (Gueye et al., 1998), two commercial meat-type (Ross and Anak Titan) chicken genotype (Ajayi et al., 2008) and Cobb broiler chicken genotype (Latshaw and Bishop 2001). Ukwu et al. (2014) indicated that more studies need to be conducted for prediction of body weight of some chicken genotypes using linear body measurement traits.
The objectives of the present study were: 1) to determine the relationship between body weight (BW) and linear body measurement traits which are beak length (BKL), body length (BDL), keel length (KL), chest circumference (CC), toe length (TL), body girth (BG), shank length (SL), back length (BCL), shank circumference (SC) and wing length (WL) of Potchefstroom koekoek using correlation analysis, 2) to develop a model for predicting body weight from linear body measurement traits using classification and regression tree data mining algorithm. This study will help Potchefstroom koekoek chicken farmers in selecting the best linear body measurement trait during breeding to improve body weight.
MATERIALS AND METHODS
Study Area
The study was carried out at the University of Limpopo experimental farm, South Africa. The location, ambient temperatures, latitudes, longitude and rainfall of the study area are the same as described by Alabi et al. (2012).
Experimental Birds and Management
Potchefstroom Koekoek chicken genotype was used for the current study. Chicks for this study were hatched at the university farm and reared intensively in a closed space on deep litter since day old until they are pullets. At the age of twenty two weeks, the chickens were separated per sex and eighty (80) laying hens were randomly selected from the population for the experiment. The layers were fed with 16.10% crude protein diet 11.97 MJkg/DM. The diet comprised of ingredients like: maize (64%), maize gluten meal (11.67%), soya Hipro (4.37%), fish meal (5%), full fat soya (4.91%), Di sodium phosphate (1.33%), L-lysine (0.20%), CaCO3 (8.17), DL-methionine (0.20%) and vitamin trace element premix (0.15%) was performed following the national research council (NRC) feeding standard. Water and feed were given to the chickens without restriction.
Data Collection
Body weight and linear body measurements were collected as described by Ige et al. (2016) and Tyasi et al. (2018). Briefly, body weight was measured with a weighing scale in kilograms (kg). The following linear body measurement traits were measured once per bird using a measuring tape and ruler in centimetres (cm): beak length (BKL), body length (BDL), keel length (KL), chest circumference (CC), toe length (TL), body girth (BG), shank length (SL), back length (BCL), shank circumference (SC) and wing length (WL). Linear body measurement traits were measured as follows: WL was measured as the length from the humorous-coracoid junction to the distal tip of the phalange digits; KL was recorded as the length between the cranial and the caudal terminals of the keel bone; SL was recorded as the length of tarso-metatarsus from the hock joint to the metatarsal pad; CC was recorded as the circumference of the chest; BKL was measured as the length of the beak; BDL was measured as the distance between the base of the neck and the cloaca; TL was measured as the length of the third toe; BG was taken when a measuring tape is looped around the region of the breast under the wing. BCL was measured from the nadir of the curve to the base of the tail, SC was taken as the width of the shank. All the measurements were collected with the same person to avoid individual variations on measuring.
Classification and Regression Tree (Crt) Method
This data mining algorithm is a binary decision tree. This method was proposed by Breiman et al. (1984) and it is very simple and easy to visualize. In the present study, CRT was applied to predict the dependent variable (body weight) from independent variables (beak length, body length, keel length, chest circumference, toe length, body girth, shank length, back length, shank circumference and wing length. The CRT was conducted as described by Yakubu (2012); Oguntunji (2017) and Eyduran et al. (2019). Briefly, 10 fold cross-validation an error estimation method known to be the most acceptable method of estimation was employed to provide estimates of the future prediction error for each node and explained the variation observed in the target variable was estimated as follows:
S2x = (1 – S2e) x 100
S2e = risk value/S2y
Where:
S2x = explained variation, S2e = unexplained variation and S2y = variance of the root node (standard deviation of the root node)2.
Statistical Analysis
Data was analysed by Statistical Analysis System (SAS, 2009) for descriptive statistics and R-software was used for computing of correlation between variables and constructing heat map of correlation coefficients. Statistical Package for Social Sciences (IBM SPSS.25) software was used for computing of classification and regression tree data mining algorithm.
RESULTS
Descriptive Statistics
Boxplot (Figure 1) is presented the summary of body weight distribution in Potchefstroom Koekoek laying hens. The summary showed the minimum, 25th percentile (first quartile), median, 75th percentile (third quartile) and maximum values of body weight. Potchefstroom Koekoek chicken genotype boxplot indicated that the values of minimum (>1.0kg), first quartile, median (>1.40kg), third quartile (1.60kg) and maximum (>1.60kg).
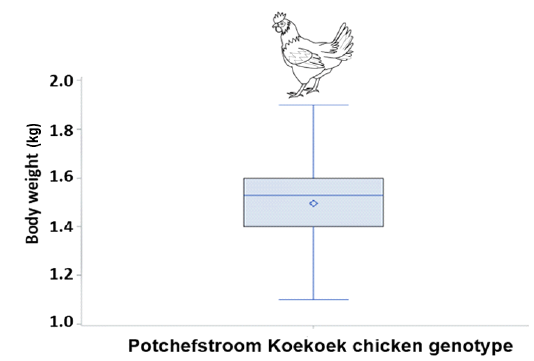
Figure 1: Boxplot showing the median, minimum, maximum, 25th and 75th percentile values of body weight of Potchefstroom Koekoek hens.
Table 1 shows the summary of body weight and linear body measurement traits including beak length, body length, keel length, chest circumference, toe length, body girth, shank length, back length, shank circumference and wing length. Body weight of Potchefstroom Koekoek was noted as 1.50 ± 0.02 kg while for wing length, back length beak length, shank length, shank circumference, chest circumference, keel length, body girth, toe length and body length were noted as 4.70 ± 0.71, 0.49 ± 0.01, 0.22 ± 0.01, 8.17 ± 0.16, 4.69 ± 0.09, 26.56 ± 0.55, 11.22 ± 0.17, 36.83 ± 0.56, 6.28 ± 0.11 and 33.15 ± 0.38 cm, respectively.
Table 1: Descriptive statistics of body weight and linear body measurement traits of Potchefstroom Koekoek hens.
| Trait | Mean ± SE | CV | Minimum | Maximum |
| BW (kg) | 1.50 ± 0.02 | 13.7 | 1.10 | 1.90 |
| WL (cm) | 4.70 ± 0.71 | 134 | 0.93 | 22.5 |
| BCL (cm) | 0.49 ± 0.01 | 25.0 | 0.30 | 0.79 |
| BKL (cm) | 0.22 ± 0.01 | 29.2 | 0.13 | 0.34 |
| SL (cm) | 8.17 ± 0.16 | 17.0 | 4.20 | 9.90 |
| SC (cm) | 4.69 ± 0.09 | 17.4 | 3.90 | 9.10 |
| CC (cm) | 26.6 ± 0.55 | 18.7 | 18.6 | 34.7 |
| KL (cm) | 11.2 ± 0.17 | 13.2 | 8.29 | 14.4 |
| BG (cm) | 36.8 ± 0.56 | 13.5 | 30.1 | 47.0 |
| TL (cm) | 6.28 ± 0.11 | 15.3 | 4.74 | 8.30 |
| BDL (cm) | 33.2 ± 0.38 | 10.4 | 27.2 | 38.6 |
Standard error of means: SE, Coefficient of variation: CV, Body weight: BW, Beak length: BKL, Body length: BDL, Keel length: KL, Chest circumference: CC, Toe length: TL, Body girth: BG, Shank length: SL, Back length: BCL, Shank circumference: SC and Wing length: WL.
Phenotypic Correlation
Phenotypic correlation between body weight and linear body measurement traits are presented in Figure 2. Pearson correlation results revealed that only two linear body measurement traits (toe length, r = 0.21* and beak length, r = 0.23*) which were positive significant correlation with body weight. Our results showed wing length had a negative highly significant correlation with back length (r = -0.56**), chest circumference (r = -0.29**) and keel length (r = -0.27**), while beak length had a positive highly significant correlation with keel length (r = 0.56**), toe length (r = 0.42**) and body length (r = 0.39**). Shank length had a positive highly significant correlation with chest circumference (r = 0.33**) but negative highly significant correlation with shank circumference (r = -0.33**), Chest circumference had a positive highly significant correlation with keel length (r = 0.47**), body girth (r = 0.34**), toe length (r = 0.46**), and body length (r = 0.56**). Keel length had a positive highly significant correlation with body girth (r = 0.28**), toe length (r = 0.46**), and body length (r = 0.59**). Body girth had a positive highly significant correlation with toe length (r = 0.55**) and body length (r = 0.41**). Toe length had a positive highly significant correlation with body length (r = 0.38**). Correlation results also indicated that body weight had positive non-significant correlation with wing length (r = 0.16ns), body girth (r = 0.01), chest circumference (r = 0.14), keel length (r = 0.15) and body length (r = 0.17) nevertheless, negative non-significant correlation with shank circumference (r = -0.03), back length (r = -0.08) and shank length (r = -0.05), respectively.
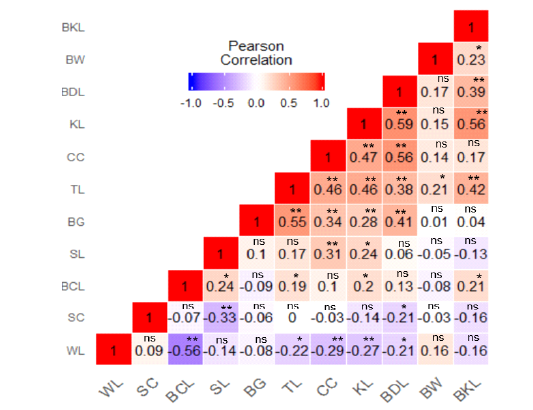
Figure 2: Heat map of phenotypic correlation of body weight and body measurement traits of Potchefstroom koekoek chicken genotype. Pearson correlation colour illustration, a high correlation is red, mid correlation is white and low correlation is blue. Body weight: BW, Beak length: BKL, Body length: BDL, Keel length: KL, Chest circumference: CC, Toe length: TL, Body girth: BG, Shank length: SL, Back length: BCL, Shank circumference: SC, Wing length: WL, * significant at p < 0.05, ** significant at p < 0.01 and ns not significant.
Classification and Regression Tree Method
The classification and regression tree (CRT) model in Potchefstroom Koekoek chicken genotype (Figure 3) with the body weight as a dependent variable and linear body measurement traits as the independent variables. This model contained a total of eight (8) nodes on which five of them were terminal nodes (node 1, 5, 6, 7 and 8), respectively. Node 0 is the root node containing the descriptive statistics of body weight (mean = 1.498 kg, standard deviation = 0.204 and n = 80). Node 0 on the basis of wing length was divided into node 1 (≤ 1.145 cm) and node 2 (˃ 1.145 cm), respectively. Node 2 was divided on the basis of beak length into node 3 ((≤ 0.200) and node 4 (˃ 0.200 cm). Node 3 on the basis of wing length was divided into node 5 (≤ 2.365 cm) and node 6 (˃2.365 cm). The last node to be divided in this model was node 4 which was divided on the basis of back length into node 7 (≤0.565 cm) and node 8 (˃0.565 cm), respectively. In all the terminal nodes, node 8 appeared to be the best node as it was recorded the highest predicted mean (1.830 kg) than node 1 (1.325 kg), node 5 (1.375 kg), node 6 (1.544 kg), and node 7 (1.527 kg), respectively. This model showed that node 6 had the lowest variance [(0.030)2 = 0.0009] and the variance of the root node or dependent variable (body weight) was S2y = (0.204)2 = 0.042. The unexplained variation in the body weight was S2e = risk value ÷ S2y = 0.018 ÷ 0.042 = 0.429 and the variation in the model was explained as S2y = 1 – S2e = 1- 0.042 = 0.57, respectively.
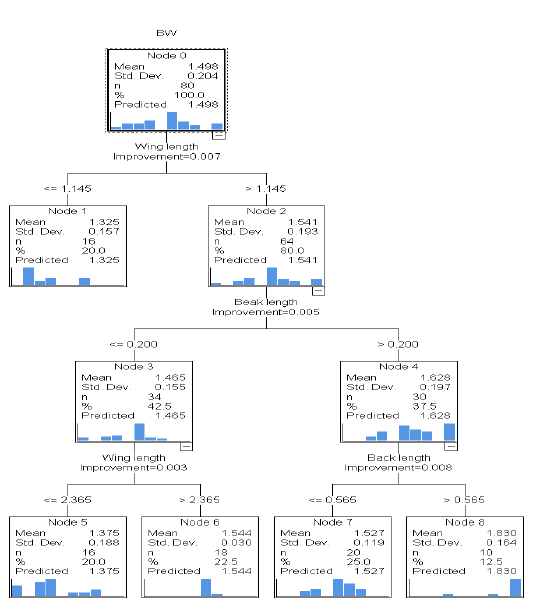
Figure 3: Classification and regression tree for modelling of body weight from linear body measurement traits in Potchefstroom chicken hens. Std. Dev = standard deviation, n = number, Mean = average, BW = body weight.
DISCUSSION
Body weight measurement is vital for any selection and breeding programme, feeding, vaccination and drug dosage in animal production (Olawumi and Farinnako, 2017). We firstly explored the distribution of Potchefstroom Koekoek laying hen’s body weight by using boxplot. The boxplot summary suggests that our data was well distributed without outliers. The data was summarized for all the studied traits and results indicated body weight of Potchefstroom Koekoek laying hens had 1.50kg. Our descriptive statistics were lower than of Tyasi et al. (2017) in Chinese Dagu male indigenous chickens, and Latshaw and Bishop (2001) in Cobb broiler chicken genotype, but higher than of Yakubu and Salako (2009) in Nigerian indigenous chickens. The variations might be due to the breed differences. The present study was conducted to investigate the association between body weight and linear body measurement traits of Potchefstroom Koekoek laying hens. The results demonstrate that by increasing toe length and beak length in chicken laying hen the body weight also increase. Therefore, toe length and beak length might be the selection criteria during breeding to improve body weight in Potchefstroom Koekoek chicken laying hens. These findings suggest that body weight and linear body measurement traits of Potchefstroom Koekoek laying hens need to be improved genetically. These results demonstrated that body weight does not depend on shank circumference, back length and shank length. Our findings are in accordance with findings of Tyasi et al. (2019). Other studies (Ajayi et al., 2008; Semakula et al., 2011) also found similar results between body weight and linear body measurement traits of chicken genotype. However, Egena et al. (2014) showed dissimilar correlation results between body weight and linear body measurement traits of Nigerian indigenous chicken genotype. The variation might be due to different chicken genotypes. Correlation results suggest that there is a relationship between body measurement traits of Potchefstroom Koekoek laying hens. However, the findings are not demonstrating which traits might be used to estimate the body weight. Hence, regression analysis was performed to predict the equations for the estimation of body weight using linear body measurement traits which were positively significant correlated with body weight. Our findings suggest that wing length, beak length and back length explained 57% of variation in body weight of Potchefstroom Koekoek chicken. The model developed from the current study showed that wing length had the highest significant role in body weight followed by beak length, respectively. It was also showed that back length also played a remarkable role in body weight of Potchefstroom Koekoek laying hen chicken. Our findings are supported by Dzungwe et al. (2018) who indicated that wing length is one of the linear body measurement traits which had a significant role in the body weight of chickens. Similar results found by Ojo et al. (2014) who also indicated that wing length plays an important in body weight of Japanese quail. However, Tyasi et al. (2017) reported that shank circumference and shank length played a vital role in the body weight of Chinese Dagu male chicken genotype. The variation with the current study might be due to sex differences.
In conclusion, the findings suggest that there is a relationship between body measurements. However, only beak length and toe length were positive significantly correlated with body weight. Classification and regression tree results suggest that beak length, wing length and back length had a role on body weight of Potchefstroom Koekoek laying hen chickens. Our findings might help chicken farmers, researchers and extension officers to recognize the association between body weight and linear body measurement traits in Potchefstroom Koekoek laying hen chickens. This study might also help farmers during selection to improve body weight in breeding. Further studies are needed to investigate the relationship between body weight and linear body measurement traits in larger sample of the same or different chicken breeds.
ACKNOWLEDGEMENTS
Authors wish to express their appreciation to the Department of Agricultural Economics and Animal Production, the University of Limpopo for financial support and to the University of Limpopo Experimental Farmworkers for their support during data collection.
CONFLICTS OF INTEREST
Authors for this work declare no conflict of interest.
AUTHOR CONTRIBUTIONS
TLT designed the experiment, analysed the data and wrote the manuscript. KMM, KM, TLR, MCM, LWD, KMM, PMB, NDM and DM performed fieldwork and wrote the manuscript. KM and KMM reviewed the manuscript. TLT, BG and MG read, edited and approved the final manuscript.
REFERENCES


