Advances in Animal and Veterinary Sciences
Research Article

Use of Cytokine-rich Supernatant for Modulating Lymphocytes Proliferation and Antibody Levels in four Different Genetic Background Chicken Lines
Ashraf A. Amin1*, A. S. Ahmed2, S. B. Alsowaigh1
1Department of Animal and Fish Production, College of agriculture and food science, King Faisal University, Saudi Arabia; 2Animal Production Department, College of Agriculture, Cairo University, Egypt.
Abstract | Use of cytokines as adjuvants for avian is a potential opportunity to enhance chicken immune response. This study designed to investigate the importance of considering the genetic background of the host birds, antibody type, and the immune response assessment test before potential use of cytokines-rich supernatant as an adjuvant. One hundred twenty-eight sires represent equally Cobb, Hisex, Hajar1, and Hajar2 parent lines were used. Treatment group birds in each line received 1 ml injection of Cytokine-rich supernatant per each kg of body weight at 40 wk of age. On the same day, all birds received a single dose of Newcastle disease (ND) vaccine, 1 ml of sheep red blood cells (SRBC) 20% suspension, and subcutaneous 4 mg of bovine serum albumin (BSA). ND and SRBC titers were measured at 0, 3, 7, and 10 days of the experiment. After 7 days, delayed hypersensitivity (DHT) response, in vitro lymphocyte proliferation using MTT (3-[4,5-dimethylthiazol-2-yl]-2,5-diphenyltetrazolium bromide) and viable cell count assays were measured. Antibody titer against ND and SRBC of Cobb and Hisex sires recorded the highest significant values for ND and the lowest values for SRBC. The treatment positively affected MTT results of Cobb and Hisex birds compared to control groups but did not affect Hajar 1 and Hajar 2 birds. Viable cell count indicated significant increases in all treated birds. It is important to consider the difference in genetic background of the chickens lines before treatment where, they response at different levels for cytokine-rich supernatant as adjuvants.
Keywords | Cytokine-rich supernatant, Chicken lines, MTT, Mitogen, Immune response
Received | October 04, 2019; Accepted | January 10, 2020; Published | February 23, 2020
*Correspondence | Ashraf A. Amin, Department of Animal and Fish Production, College of agriculture and food science, King Faisal University, Saudi Arabia; Email: ashraf.amin@gmail.com
Citation | Amin AA, Ahmed AS, Alsowaigh SB (2020). Use of cytokine-rich supernatant for modulating lymphocytes proliferation and antibody levels in four different genetic background chicken lines. Adv. Anim. Vet. Sci. 8(2): 167-173.
DOI | http://dx.doi.org/10.17582/journal.aavs/2020/8.2.167.173
ISSN (Online) | 2307-8316; ISSN (Print) | 2309-3331
Copyright © 2020 Amin and Ahmed. This is an open access article distributed under the Creative Commons Attribution License, which permits unrestricted use, distribution, and reproduction in any medium, provided the original work is properly cited.
INTRODUCTION
Cytokines are proteins that play an essential role as mediators and regulators of the immune response (Kalaiyarasu et al., 2013; Bean et al., 2005; Wigley et al., 2003; Lowenthal et al., 1998). They mediate a multitude of effects to regulate immune performance, including the activation and differentiation of immune cells and enhance the immune function to produce other cytokines (Hilton et al., 2002). Cytokines are produced in response to stimulation via infectious agents and their derived products, inflammatory mediators, and cytokines themselves (Rahman and Eo, 2012), and in response to T lymphocyte stimulants via plant lectins, such as Concanavalin A (ConA) and Phytohemagglutinin (PHA) compounds (Li et al., 1999). Several studies indicated the potential use of cytokines as adjuvants for avian vaccines (Bean et al., 2005; Lowenthal et al., 2000), immunotherapeutic agents (Kalaiyarasu et al., 2013; Hilton et al., 2002) and as potential disease prevention agents (Rahman and Eo, 2012). A variety of cytokine genes have been cloned and the expressed protein identified and then used for therapeutic studies (Asif et al., 2004; Lowenthal et al., 2000). The appropriate combination amongst different cytokines is considered a limiting factor to direct the immune response towards antibody-mediated or cell-mediated response (Bean et al., 2005). Inadequate amount or inappropriate combination of cytokine administration may lead to an ineffective response or sweep the response away from its designed target (Asif et al., 2004; Weeratna et al., 2000). Stimulating chicken T lymphocytes in vitro via plant lectins such as Con A could produce an appropriate natural combination of cytokines in a cytokine-rich supernatant (Ford et al., 2001). The combined effect of two or more cytokines may vary according to the antagonistic, additive, and synergistic effects network amongst different cytokines (Borish and Steinke, 2003). The genetic differences in cytokines production and immune response between different chicken lines have been previously reported (Hassan et al., 2004; Bacon and Palmquistt, 2002). This research work hypothesized that the immune response and the in vitro cell proliferation activity would vary considerably according to the genetic lines and the cytokine-rich supernatant exposure.
MATERIALS AND METHODS
This study was carried out at the summer season 2015 in King Faisal University Research Station, Saudi Arabia. The field work continued for 10 weeks while, the laboratory work extended after that. Then the data analysis and prepare the manuscript exposed to some unexpected delay. One hundred twenty-eight sires from four different genetic background chicken lines were used for the study. Thirty-two sires of Cobb broiler breeder and 32 sires of Hisex layer breeder were obtained from commercial poultry projects at 35 weeks of age. Thirty-two sires of local Saudi Hajar1 line and 32 sires of local Saudi Hajar2 line were obtained from King Faisal University Research Station at the same age. Hajar1 and Hajar2 lines characterization were demonstrated by Ahmed and Alabbad (2014). From 1-day old, all birds were subjected to the same ND vaccination program. All birds were housed in an individual caging system, as one bird per cage, placed in a closed house system for 5 weeks prior to study. At 40 weeks of age, each line was divided into two groups: a control group and a treatment group, each of 16 sires in four replicates (4 birds/replicate). Water and commercial diet were provided ad libitum for all birds. Experimental birds were treated according to the mandatory roles of animal care and ethics guidelines set by the Deanship of Scientific Research, King Faisal University.
Cytokines-rich supernatant was generated according to the procedure of Ford et al. (2001), to produce IL-2 rich supernatant with slight modification. Nine Hajar1 cocks at 25 weeks of age were sacrificed, and then their spleens were removed and dissected individually under sterile conditions. The spleens were dissected and pressed through sterile mesh screens into 10 ml RPMI 1640 media (Sigma, USA), cell biology laboratory grade. The suspensions were centrifuged at 1000 rpm for 30 min in new 15 ml Falcon tubes. Splenocytes were collected and washed twice with 10 ml of RPMI 1640 media. Viable cells were distinguished using 0.05% trypan blue stain, counted, and adjusted to 10 million live cells per 1 ml of complete media consisting of RPMI 1640 media supplemented with penicillin, streptomycin (100 µg/ml), and 2% fetal calf serum. Five ml of the splenocytes suspension (50 million splenocytes) was transferred to each T-75 tissue culture flask containing 45 ml of complete media. Stimulation was carried out by the addition of Concanavalin A (ConA) (Sigma, USA, molecular grade) at 5 μg ConA per ml cells. After 24 hours of incubation in a 37°C humidified incubator with 5% CO2, the tissue culture fluid was harvested, centrifuged, and then the cytokine-rich supernatant was pooled in 15 ml tubes and stored at -20°C. Total protein was determined to ensure cytokine generation. The amount of protein generatedwhich refers to the amount of cytokines-derived proteins produced was calculated as the difference between total protein concentration in complete media and supernatant after splenocytes stimulation. The result was 160 mg/100 ml of media.
Parameters and data collection: At 40 weeks of age, zero time of the experimental period, blood samples were obtained from all birds to assess ND and SRBC zero time antibody titer. After sampling, only the treatment group birds in each line received 1 ml/kg body weight of the cytokine-rich supernatant via intramuscular injection. The control group birds were injected with 1 ml RPMI complete media containing the same concentration of ConA stimulant. Then all experimental birds were injected with 1 ml of 20% SRBC suspension via intramuscular route, to be used as an indicator for their humoral immunity. In addition, they all received a single dose of Lasota strain vaccine via eye drop route. Delayed hypersensitivity to BSA (Albumin bovine serum, lyophilized powder ≥96% Sigma, USA) as an indicator for cell-mediated immune response was achieved through the wattle test 20, where all birds at zero time of the experiment were subcutaneously injected with 4 mg BSA/bird. After 7 days of the experiment, all birds’ wattles thicknesses were recorded, and then the birds were reinjected with 1 mg of BSA in 0.1 ml saline intradermal. The delayed hypersensitivity test was calculated after 24 hours using micrometre as a relative response according to the following formula: Relative response = thickness of wattle after response (BSA response) / thickness of wattle before injection (control). Blood samples were collected from the wing veins of all birds at 3, 7, and 10 days post treatment for ND and SRBC titration. The SRBC antibody titers were assayed using micro agglutination as described by Nelson et al. (1995). A microtiter heamaglutination inhibition (HI) test (OIE, 2009), was used to assess the ND antibody titer.
Table 1: Effect of genetic line and Cytokine- rich supernatant treatment on Newcastle disease (ND) antibody titer.
|
Line |
Treatment |
ND titer |
|||
|
0* |
3 |
7 |
10 |
||
|
Hajar 1 |
T** |
3.50± 0.53 B*** |
2.87± 0.47 D |
5.12± 0.36 B |
5.62± 0.30 C |
|
C |
2.75± 0.53 B |
3.00± 0.46 D |
5.00± 0.35 B |
5.37± 0.28 C |
|
|
Hajar 2 |
T |
3.75± 0.53 B |
4.50± 0.47 C |
4.87± 0.35 B |
5.50± 0.30 C |
|
C |
3.75± 0.53 B |
4.12± 0.47 CD |
5.62± 0.35 B |
5.85± 0.29 C |
|
|
Cobb |
T |
8.83±0.61 A |
8.50±0.47 B |
8.55±0.37 A |
8.73±0.30 B |
|
C |
7.50±0.54 A |
8.25±0.48 B |
9.25 ±0.35A |
9.75±0.30 A |
|
|
Hisex |
T |
8.66± 0.61 A |
8.60± 0.47 B |
8.50± 0.36 A |
8.75± 0.30 B |
|
C |
8.62± 0.54 A |
8.49± 0.49 B |
8.50± 0.35 A |
8.82± 0.29 B |
|
* 0,3, 7 and 10 are zero day, 3days, 7days and 10 days of the experiment; ** T and C are the Treatment via cytokine -rich supernatant intramuscular injection, and control respectively; *** a, b, c, d values within a day with different superscript differ significantly (P ≤0. 05).
Table 2: Effect of genetic line and Cytokine- rich supernatant treatment on Sheep red blood cells (SRBC) antibody titer.
|
Line |
Treatment |
SRBC titer |
||
|
3* |
7 |
10 |
||
|
Hajar 1 |
T** |
2.00 ±0.45 AB*** |
3.62± 0.39 A |
2.62± 0.29 A |
|
C |
1.25± 0.38 BC |
2.75± 0.38 AB |
2.00± 0.29 B |
|
|
Hajar 2 |
T |
0.65± 0.39 C |
2.00± 0.39 BC |
1.28± 0.31 BC |
|
C |
2.01± 0.44 AB |
3.71± 0.41 A |
2.42± 0.31 A |
|
|
Cobb |
T |
2.75±0.45 A |
1.13±0.39 CD |
0.75±0.29 CD |
|
C |
0.63 ±0.38 C |
1.51±0.39 CD |
0.37±0.28 D |
|
|
Hisex |
T |
2.00± 0.44 AB |
1.50± 0.39 CD |
0.87± 0.29 CD |
|
C |
1.00± 0.44 BC |
1.50± 0.39 CD |
0.62± 0.28 CD |
|
* 3, 7 and 10 are 3days, 7days and 10 days post SRBC injection; ** T and C are the Treatment via cytokine -rich supernatant intramuscular injection, and control respectively; *** a, b, c, d values within a day with different superscript differ significantly (P ≤0. 05).
Mitogenic responses: Lymphocyte proliferation assays were performed. At 7 days of the experiment, 3 ml of peripheral blood was collected from all birds, and then peripheral blood lymphocytes of each sample were prepared. Lymphocytes were separated using Histopaque-1077 (sterile-filtered, density: 1.077 g/mL Sigma-Aldrich, USA), the number of viable cells was adjusted to 5 × 10⁶ cells/ml using the trypan-blue exclusion test. The cells were placed in 96-well flat-bottom tissue culture plates in three replicates at 100 µl/well and stimulated with phytohemagglutinine-p (PHA-p) (Phytohemagglutinin PHA-P, lyophilized powder, Cell biology grade Sigma-Aldrich, USA) (50 μg/ml) except for the negative-control wells. Two sets of plates were prepared for the following viable cell count and MTT assays. The plates were incubated at 41oC, as a suitable temperature for chicken cells, for 72 h in 5% CO2 in a humidified incubator. The MTT assay was applied to the first set of plates, according to Fernandez-Botran and Vetvicka (2001), a concentration of 5 mg/ml of MTT (98% Sigma-Aldrich, USA) was dissolved in RPMI-1640 media (Sigma, USA), and 10µl was added to each well. After incubation for 4 hr at 37oC with 5% CO2, 100 µl/well of acidic isopropanol solution was added to each well, mixed, and let stand for 10 min. The formed MTT formazan concentration was read on a micro ELISA reader and expressed as optical density (OD) at 570 nm wavelength. In addition, the second set of plates was used for the viable cell count using the trypan-blue exclusion test and expressed as cells/ml.
Statistical Analysis: The data were subjected to a two-way analysis of variance (ANOVA) for the effect of the genetic line and cytokine-rich supernatant treatment. Means were separated using Duncan’s multiple range tests. Data were analyzed using the general linear model procedure (SAS, 2005). JMP IN software version 5.1 (JMP IN 5.1, 2005) was used for statistical analysis. Statistical significance was considered as P ≤ 0.05 for all parameters.
RESULTS AND DISCUSSION
The results of antibody titer against SRBC indicated that the genetic line is a main factor controlling antibody response. Local line birds recorded higher responses than did the other two lines. In addition, the response of the local lines lasted longer post-exposure. ND vaccination seems highly affected by the genetic background of the chicken line. The OD values of reduced MTT formazan for peripheral blood lymphocytes have responded to the cytokine treatment in Cobb and Hisex lines where the treated group birds in each line recorded higher OD than did control groups. However, local chicken lines did not show the same tendency. Only birds from the Hajar2 line treated with cytokine-rich supernatant recorded higher DHT response than did the control group. The antibody titers against ND of the sires from different genetic backgrounds as affected by cytokine-rich supernatant injection are shown in Table 1. When compared, the means of antibody titer at 0, 3, 7, and 10 d of the experiment indicated that Cobb and Hisex sires recorded higher significant (P < 0.05) antibody titer values than did local lines, regardless the treatment status. Treatment with cytokine- rich supernatant did not significantly (P < 0.05) affect the ND antibody titer within each chicken line, except for Cobb sires at 10 d of the experiment.
Cobb and Hisex sires recorded lower values for antibody titer against SRBC at 7 d of the experiment compared to Hajar1 and Hajar2 birds (Table 2). The antibody titer against SRBC of Cobb sires was positively (P < 0.05) affected by cytokine-rich supernatant injection at 3 d of the experiment compared to the control group. The Hajar2 line control group birds recorded higher significant (P < 0.05) antibody titer values for SRBC than for the treated group birds at all measuring points. Hisex sires antibody titers against SRBC were not affected by treatment at any of the measuring points. At 10 days of the experiment, Hajar1 line treated birds recorded higher significant (P < 0.05) antibody titers against SRBC than did the control group birds (Table 2).
For the MTT assay results (Figure 1), Cobb and Hisex treated birds showed significant (P < 0.05) higher OD values of reduced MTT formazan compared to the control groups, whereas there were no significant differences (P < 0.05) in OD of MTT assay between the control and treated groups of Hajar1 and Hajar2 line birds. MTT assay results did not show significant differences (P < 0.05) in response among the treated groups of all lines or the control groups. Viable cell count of stimulated peripheral blood lymphocytes of different lines (Figure 2) indicated that birds in treated groups of all chicken lines recorded the higher significant (P < 0.05) viable cell count than did those of the control groups, whereas no significant differences in the viable cell count were recorded among treated groups or control groups of all lines. Delayed hypersensitivity test (DHT) to BSA did not record any significant differences among lines or groups, except for the Hajar2 line, where the control group birds recorded a higher significant (P < 0.05) relative response than did the treated birds within the line (Figure 3).
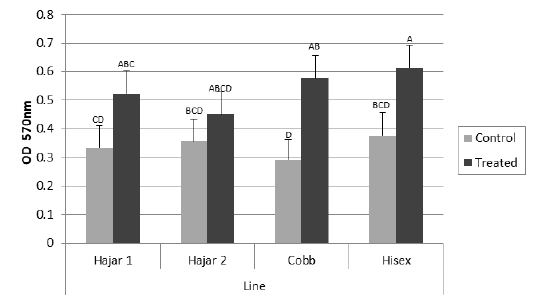
Figure 1: Mean optical density (OD) values of reduced MTT formazan for peripheral blood lymphocytes of different chicken lines stimulated with PHA (50 μg/ml) at 7d of the experiment. a, b, c, d columns with different superscript differ significantly (P ≤0. 05). Treated and control are injected and non-injected groups using cytokine- rich supernatant respectively.
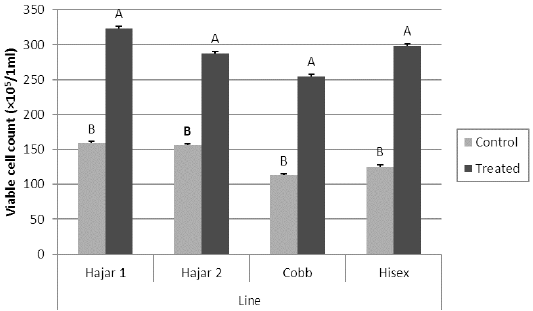
Figure 2: Viable cell count for peripheral blood lymphocytes of different chicken lines stimulated with PHA (50 μg/ml) at 7d of the experiment. a, b columns with different superscript differ significantly (P ≤0. 05). Treated and control are injected and non-injected groups using cytokine- rich supernatant respectively.
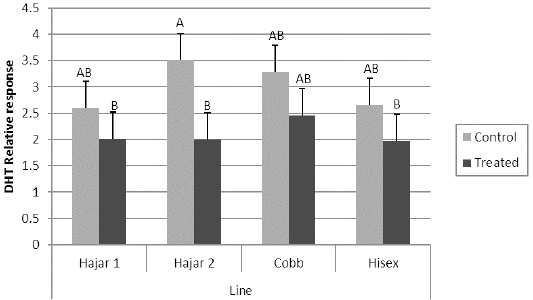
Figure 3: Delayed hypersensitivity test (DHT) relative response to Bovine serum albumin (BSA) of different chicken lines. a, b columns with different superscript differ significantly (P ≤0. 05). Treated and control are injected and non-injected groups using cytokine- rich supernatant respectively.
The current study intended to use in vitro produced cytokine-rich supernatant via T cell stimulation using ConA, to simulate the natural and adequate combinations of cytokines. Cytokine-rich supernatant production via ConA stimulation has been reported previously to consist of various cytokines, including IL2 and INF-γ (Katial et al., 1998). Due to the suspected effect of hormones on the efficiency of T cell to produce some cytokines as reported by Jordan et al. (1989), the current study used only sires of the same age. Evidence of genetic variability in cytokine production has been reported in chickens (Bacon and Palmquistt, 2002). The response of different genetic background birds to an equal amount of cytokine supernatant were suspected to vary according to the ability of immune cell receptors to respond to the stimulation. This genetic resistance based on genetic capacity has often been neglected (Kapczynski et al., 2013), while it was reported previously in chickens (Hassan et al., 2004) and other avian species (Shi et al., 2014). According to the current results, antibody response to ND vaccination seems highly affected by the genetic background of the chicken line. The effect of cytokine-rich supernatant injection appears to rank second in modulating the antibody response to the ND vaccine after the line effect.
Successful protection of the host could be achieved by readily available antibodies to immediately recognize and neutralize the relevant pathogen (Schijns et al., 2008). This neutralization consumes available antibody. In the current study, vaccine neutralization did not affect the antibody level in all chicken lines. This may be due to the rapid generation of antibodies using memory cells, accumulated from multiple previous exposures to the ND antigen.
With respect to the different nature of SRBC antigen than ND antigen, the results indicated that, the genetic line is a main factor controlling antibody response. Local line birds recorded higher responses than did the other two lines. In addition, the response of the local lines lasting longer than in other lines until the 10th day post-exposure. This superior response of local lines as compared to commercial lines has been reported previously in the control groups (Ahmed and Alamer, 2011). The SRBC antibody titer results emphasized the previous assumption that treatment with cytokine-rich supernatant, in most measuring points, did not affect the birds’ capacity to produce more antibodies against SRBC after the first exposure. The principal effect is suspected due to the genetic line.
The OD values of reduced MTT formazan for peripheral blood lymphocytes have responded to the cytokine treatment in Cobb and Hisex lines where the treated group birds in each line recorded higher OD than did control groups. However, local chicken lines did not show the same tendency. The MTT assay established the ability of viable cell to reduce MTT to blue MTT formazan in a dark color, a reduction caused by variations of dehydrogenases in active mitochondria (Kondo et al., 1995). The results of MTT assay were affected by the metabolic activities of the cultured lymphocytes, So, the viable cell count of the cultured cells has been counted too. The results indicated that cell division activity is highly affected by cytokine-rich supernatant in all lines, while the metabolic activity of the cultured cells is affected by the genetic background. The differences in mitochondrial enzymatic activity may be due to the differences in mitochondrial DNA sensitivity to the mitogen, which alter mitochondrial enzymatic activity compared to that of nuclear DNA, which controls cell division (Kondo et al., 2003).
CONCLUSION
In conclusion, the current results pointed to the importance of considering the genetic background of the host chicken before potential use of cytokine-rich supernatant as adjuvants. Different antigens and approaches to assess immune response may provide variable results based on the metabolic activity that accompany immune response. Further studies are needed to assess immunomodulation due to competition between different T cell types in cytokine consumption.
ACKNOWLEDGMENTS
The authors gratefully acknowledge the Deanship of Scientific Research at King Faisal University (KFU) for its financial support of the current research work. Thanks are also extended to the Agriculture Research Station for support in conducting this research. The author also acknowledges the technical assistance of Walid Almelhim, AbdulRazak Al-Abbad, Gaafar Al Hamada, Zafer Hakami, Abdullah Alnazr, and all the staff at the poultry research unit.
Authors Contribution
Ashraf A. Amin: suggested the idea of the work, statistical analysis and help in writing the paper.
A. S. Ahmed: suggested the aims of the work and laboratory works and writing the paper.
S. B. Alsowaigh: intensive laboratory works and writing the paper.
Conflict of interest
There are no conflicts of interest.
REFERENCES


