Advances in Animal and Veterinary Sciences

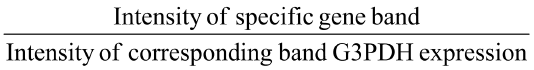
Agrose gel electrophoresis of IL-1β (449 bp) and IL-6 (444 bp) against G3PDH (423 bp) as a house keeping gene.
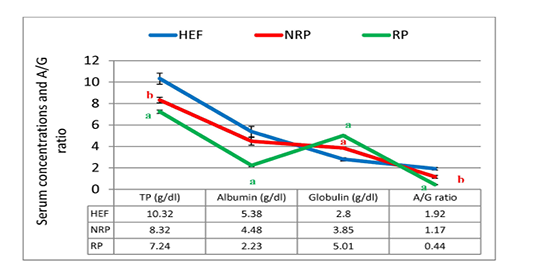
TP, albumin, globulin and A/G ratio of serum Egyptian buffaloes before and after calving in presence and absence of RP. Values are expressed as mean ± SE (n=20). Significance: aP < 0.001, bP < 0.01, cP < 0.05 comparing to HEF.
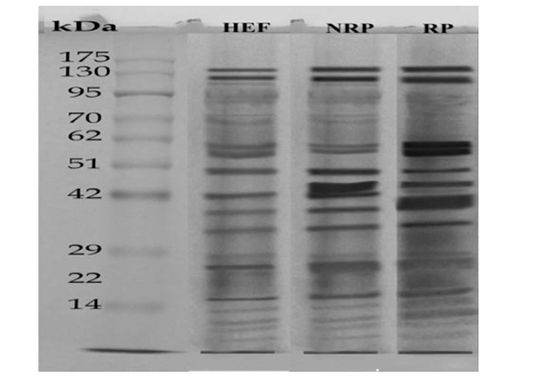
SDS-PAGE of serum (27μg protein) Egyptian buffaloes before and after calving in presence and absence of RP. The separation was done on discontinuous system using 4% stacking gel and 12% separating gel then, fixing, staining and de-staining of obtained gel. Lan (1) represented HEF group, Lan (2) is NRP group and Lan (3) is RP group.
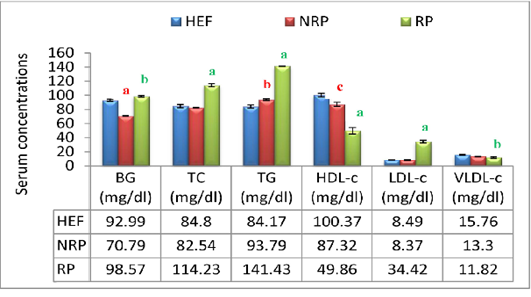
BG, TC. TG, HDL-c, LDL-c and VLDL-c of serum Egyptian buffaloes before and after calving in presence and absence of RP. Values are expressed as mean ± SE (n=20). Significance: aP < 0.001, bP < 0.01, cP < 0.05 comparing to HEF.
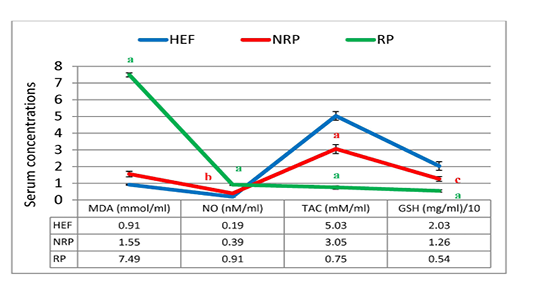
MDA, NO, TAC and GSH of serum Egyptian buffaloes before and after calving in presence and absence of RP. Values are expressed as mean ± SE (n=20). Significance: aP < 0.001, bP < 0.01, cP < 0.05 comparing to HEF.
SOD specific activity of serum Egyptian buffaloes before and after calving in presence and absence of RP. Values are expressed as mean ± SE (n=20). Significance: aP < 0.001, bP < 0.01, cP < 0.05 comparing to HEF.
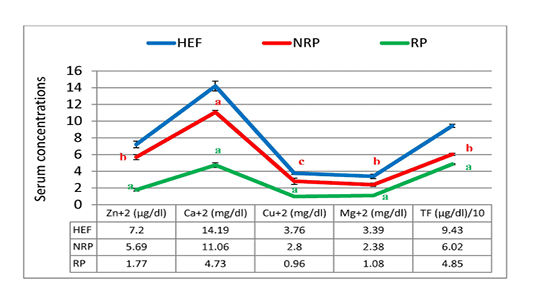
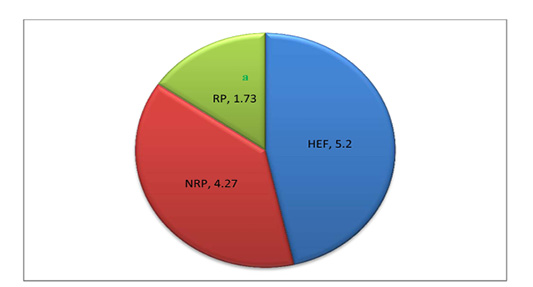
Zn+2, Ca+2, CU+2, Mg+2 and TF of serum Egyptian buffaloes before and after calving in presence and absence of RP. Values are expressed as mean ± SE (n=20). Significance: aP < 0.001, bP < 0.01, cP < 0.05 comparing to HEF.


