Advances in Animal and Veterinary Sciences
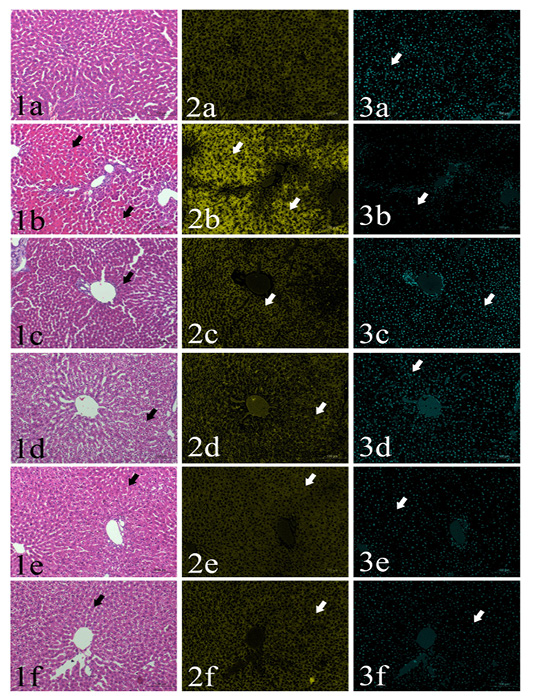
Sections of rat’s liver routinely stained with Hematoxylin and Eosin stain (1st column) showed focal cytoplasmic acidophilia (arrows) in different groups including GI (1a), GII (1b), GIII (1c), GIV (1d), GV(1e) and GVI (1f). HE x200, and their corresponding yellow stacks (2nd column) used for measuring cytoplamic color (arrows) in different groups including GI (2a), GII (2b), GIII (2c), GIV (2d), GV (2e) and GVI (2f), and Cyan stacks (3rd columns) used for measuring nuclear chromatin area percentages (arrows) in different groups including GI (3a), GII (3b), GIII (3c), GIV (3d), GV (3e) and GVI (3f),
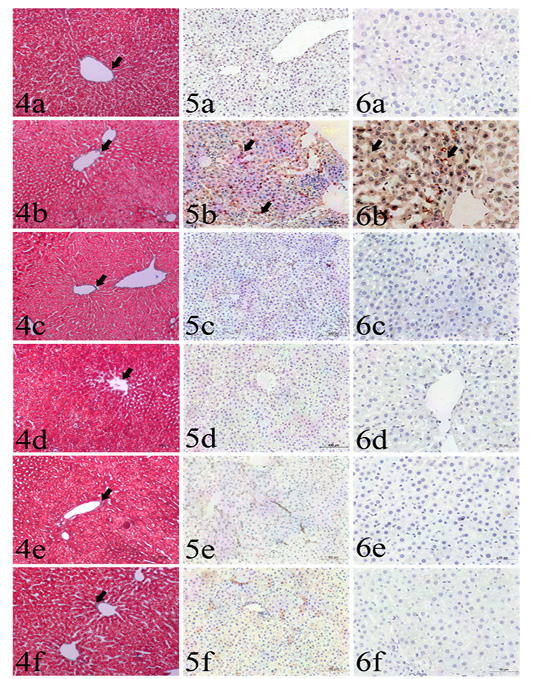
Sections liver stained with: Fig. (4): Masson’s trichrome from different groups used for collagen fibers identification (arrows), including GI (4a), GII (4b), GIII (4c), GIV(4d), GV (4e) and GVI (4f). Masson’s trichrome x200. Fig (5): Caspase 3 immunohistochemistry expression (arrows) among the examined groups including GI (5a), GII (5b), GIII (5c), GIV (5d), GV (5e) and GVI (5f). IHC x200. Fig. (6): TNF-α immunohistochemistry expression (arrows) among the examined groups including GI (6a), GII (6b), GIII (6c), GIV (6d), GV (6e) and GVI (6f). IHC x400.


