Advances in Animal and Veterinary Sciences
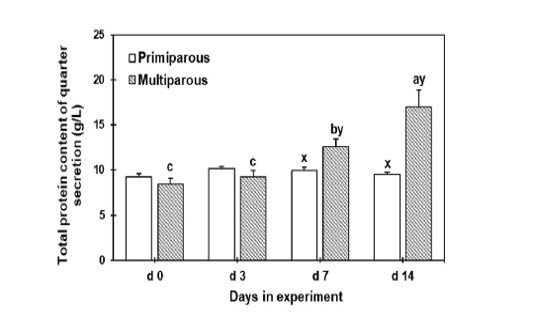
The total protein concentration of mammary secretion during the dry period for both primiparous and multiparous.
a,b,c Columns carrying different superscripts are significantly different (P < 0.05) among different time points for the same treatment.
x,y Columns carrying differences superscripts are significantly (P < 0.05) between treatment (primiparous and multiparous cows) at the same time point.
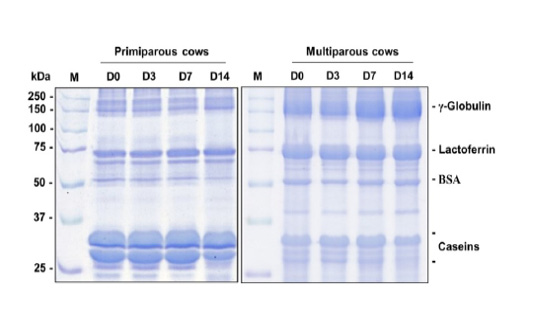
Images of γ-globulin, lactoferrin, BSA, and casein bands of the quarter secretion in 10% SDS-PAGE of primiparous cows (A) and multiparous cows (B) during the dry period.
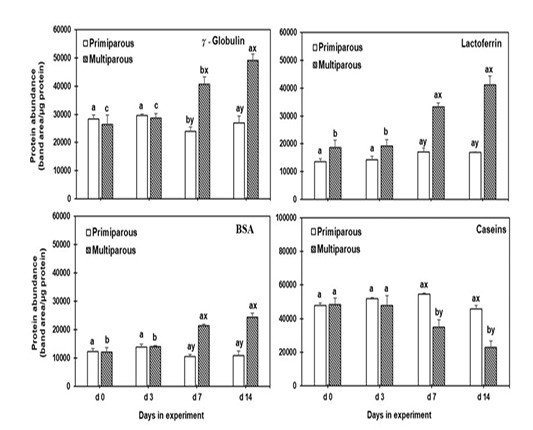
The proteinous components levels of mammary secretion during the dry period for both primiparous and multiparous.
a,b,c Columns carrying different superscripts are significantly different (P < 0.05) among different time points for the same treatment.
x,y Columns carrying differences superscripts are significantly (P < 0.05) between treatment (primiparous and multiparous cows) at the same time point.
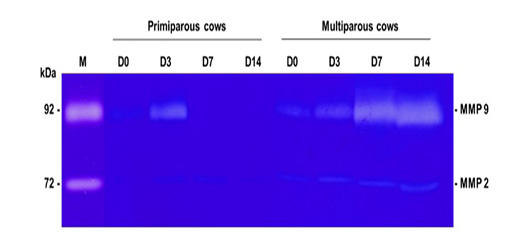
Images of MMP-2 and -9 bands of the quarter secretion in Gelatin Zymogram for both primiparous and multiparous cows.
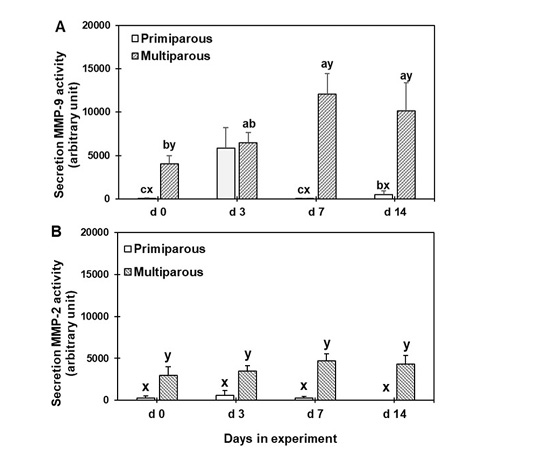
Gelatinolytic activity of mammary secretion during the dry period for both primiparous and multiparous cows.
a,b,c Columns carrying different superscripts are significantly different (P < 0.05) among different time points for the same treatment.
x,y Columns carrying differences superscripts are significantly (P < 0.05) between treatment (primiparous and multiparous cows) at the same time point


