Advances in Animal and Veterinary Sciences
Research Article
Study of Some Morphological Characteristics of Boer Goat Raised in Egypt
Abd-Allah S.*, Fatma M. Salman, M.M. Shoukry, H.H. Abd- El Rahman, M.I. Mohamed, A.A. Abedo
Animal Production Department, National Research Centre, 33 El Bohouth St., Dokki, Cairo, Egypt, Postal code 12622.
Abstract | This study was conducted to assess the various morphometric traits of Boer goats raised under desert areas conditions in Egypt. Data were collected from 20 animals of different sex and age groups. Ten standard morphological characteristics such as chest girth (CG), wither height (WH), body length (BL), chest depth (CD), paunch length (PL), cannon circumference (CC), head length (HEL), paunch girth (PG), paunch height (PH) and neck circumference (NC) were used to morphologically characterize the Boer goats with a live body weight of 43.30 kg. The coefficient of variation (CV) in all morphological characteristics ranged from 4.55% to 28.07%, while was lower in female 7.71 % compared to that of male 13.24 %. The effects of sex on the body measurements were analyzed and morphologicals harmony were determined through the pearson correlation. Our findings showed that the mean live body weight (LBW) of the male group was observed as 45.70 kg, while that of the female group was noted as 40.90 kg. Female goats showed numerically higher homogeneity compared to the male in all morphological traits. The body length (BL) of male recorded in these study were found to be 87.60 cm while that of female was investigated to be 83.10 cm, respectively. Also, the homogeneity between goats aged from 2 to 3 years was greater than that of other age groups. The highest and strongly positive correlation (p<0.01) was recorded between LBW and NC for male (0.99) and of PG for female goats (0.978). Neck circumference (NC) alone has explained the variation in LBW with an adjusted R2 of 0.99 for males. Stepwise regression analysis determined that CG, CD, CC, WH, PG and NC was the major significant contributors to the LBW prediction equation for Boer goats. LBW of goats can be predicted from NC with an adjusted R2 of 0.99 for male and PG, CG and CC with adjusted R2 about 100 percent for female. From this data, it could be concluded that the LBW can be predicted with high accuracy from some body measurements which can be exploited by goats producers for management, selection and genetic improvement of Boer goats and could be used successfully in new breeding programs in Egypt.
Keywords | Boer goats, Body weight, Morphometric measurements, Regression, Egypt.
Received | June 30, 2019; Accepted | July 25, 2019; Published | September 25, 2019
*Correspondence | Abd-Allah S., Animal Production Department, National Research Centre, 33 El Bohouth St., Dokki, Cairo, Egypt, Postal code 12622; Email: sablogical2007@yahoo.com
Citation | Abdallah S, Salman F, Shoukry M, Abd-El Rahman H, Mohamed M, Abedo A (2019). Study of some morphological characteristics of boer goat raised in egypt. Adv. Anim. Vet. Sci. 7(10): 888-897.
DOI | http://dx.doi.org/10.17582/journal.aavs/2019/7.10.888.897
ISSN (Online) | 2307-8316; ISSN (Print) | 2309-3331
Copyright © 2019 Abdallah et al. This is an open access article distributed under the Creative Commons Attribution License, which permits unrestricted use, distribution, and reproduction in any medium, provided the original work is properly cited.
INTRODUCTION
In recent years, goats have become an important aspect of animal production in Egypt. Therefore, Improving Egyptian local goat productivity has become an essential strategy should be achieved through better management and genetic programs. Morphological measurements are a very important method used to estimate and asses the characteristics of the different breeds of animals (Oliveira et al., 2013).
Nesamvuni et al. (2000), Mwacharo et al. (2006), Martins et al. (2009) and Yakubu, (2010) reported that the measurements may help to supply the basic information on the suitability of the animals towards their selection. Also, morphological measurements can be used as a management tool to promote the productivity of goats in Egypt (Abd-Allah. et al., 2019). Morphometric measurements used for several purposes including prediction of genetic improvement, growth rate, body condition score (BCS), conformation and carcass traits (Wilson et al., 1997; Slippers et al., 2000; Lambe et al., 2008). As well, live body weight (LBW) is an important economic trait in meat goat types, it is seldom measured in rural areas due to lack of scales. According to de Villiers et al. (2009) income derived from meat goat production is a major contributor to the livelihoods of rural people. In order to get an income from goats, they need to be managed properly. Because of their financial situation, these farmers are unable to procure weighing scales for determining the weight of their animals. As a result, farmers rely on the estimation of live weights for various purposes including feeding, when to breed, determination of dosages of various medications and vaccination. The best method of weighing animals without a scale is to predict LBW from different body measurements that can be measured easily by farmers Abd-Allah. et al. (2019), Wilson et al. (1997), Sarti et al. (2003), Bassano et al. (2003) and Singh and Mishra (2004). Boer goats are meat-type breed and have been introduced to different regions of the world including Egypt. Boer goats gained importance in recent years in Egypt, as it is a meat specialized breed that could raise the productivity of the Egyptian goats and decrease kid production costs. Our previous results show that conditions in Egypt are suitable for raising Boer goats due to the higher potential for the reproductive rates and meat production (Abd-Allah, 2014; Abd-Allah et al., 2015; 2016). Although LBW is an important objective in the breeding programs, the potential for genetic improvement, in general, depends on the genetic and phenotypic parameters of this breed upon which breeding programs may be applied. Nor Azhani et al. (2011) reported that, there is a positive and significant relationship between the LBW and MM (BL, WH and HG) in Boer goats and the most practical way to estimate the LBW of goats is by measuring the HG of the goats, especially where equipment to definitively quantify the weight of animals are not available and inaccessible. Therefore, the objectives of this study are to assess some morphometric measurements and the effect of sex and age on some morphological traits and to estimate the correlation coefficients between all measurements to determine the best prediction equations of live body weight based on of one or more body measurements, by using stepwise regression, which represent a practical method of predicting the weight of Boer goats raised in desert areas in Egypt.
MATERIALS AND METHODS
Study Area
The data of the above traits were taken from Boer goats of different sex and age groups located at two selected farms in two governorates in subtropical areas in Egypt during the period between 2015 and 2016. The first farm is located at the Sheep and Goats Research Unit at Abdel Moneim Riad village near of the Cairo-Alexandria desert road, approximately 100 kilometres, south of Alexandria city. It is situated in the recently reclaimed areas of the West Delta, in El Nubaria New Land Development Region at 30°42’03.9”N, 30°18’47.7”E. The experimental area has an arid climate with hot dry summers and cool winter prevailing in this area.
The second experimental farm is located at El-Tor city, Southern Sinai; South Sinai is a part of Sinai Peninsula, Egypt and has an east-west extension of about 100 km. From north to south it is approximately 130 km. South Sinai Governorate covers an area of 30.000 km2 (7,140 feddan) and is geographically isolated from the Egyptian mainland by the Suez Canal and the Gulf of Suez in the west, at 28°14’52.6”N, 33°37’49.8”E. The climate of South Sinai is considered extremely arid from an agricultural standpoint in the central area and the southwest. The mean annual precipitation ranges from as low as 10 millimeters in the southwest to about 30 millimeters in the north.
Temperatures are high in South Sinai. The average minimum and maximum temperatures recorded in the district range from 9.5 – 24.8°C to 20.9 – 33.3°C, respectively. Mean daily temperature varies from 16.1°C in January to 29.1°C in August, with an annual mean of 23.2°C. The highest temperature recorded was 42.6°C in May. The lowest was 2.6°C in January according to NOAA (2015).
Animal Management
A total of 20 Boer goats including (10 females and 10 males) were selected to be tested. The goats were divided into three age groups: Group 1 (1-2 years), Group 2 (2-3years) and Group 3 (3-4 years). The age of the animals was obtained by referring to the estimated by the number of permanent incisors present. Those goats with no records of birth date had their age estimated by the number of permanent incisors present (1-2 years, represents a yearling stage where a central pair of permanent incisors appear; 2-3 years, which represents young adults with 2 pairs of permanent incisors; 3-4 years, which represent adult goats with 3 pairs of permanent incisors. According to the environmental conditions at the two sites under study, all goats were kept under equal management and the ration was offered daily in two parts at 9 am and 4 pm, approximately. All animals were fed on concentrate feed mixture (CFM, 14% CP), consisted of 17% wheat bran, 15% cotton seed meal, 50% yellow corn, 15% sunflower meal, 2% limestone and 1% salt, according to their live body weight (NRC,1981), plus free available green Acacia (16.43% CP) and Atriplex (16.76% CP) or bean straw (6.43% CP). Whereas Acacia saligna and Atriplex halimus were collected daily from the Experimental Farm in El-Tor city, South Sinai. The concentrate feed was provided three times per day and the goats were taken to water source two or three times a day depending on the season.
Body weight (kg) and Measurements (cm)
Live body weight (LBW) was measured in kilogram (kg) using a balance scale., early in the morning before feeding. Paunch girth (PG), paunch height (PH) and neck circumference (NC) were used to morphologically characterize the Boer goats. The height measurement (cm) was done using a graduated measuring stick while the length and circumference measurements (cm) were effected using a tape rule. The measurements were taken in the morning, with the goats standing on a flat surface with head held up and held by three field assistants. All measurements were carried out by the first author in order to avoid individual variations.
Ten standard morphological characteristics such as chest girth (CG), wither height (WH) , body length (BL), chest depth (CD), paunch length (PL), canon circumference (CC), head length (HEL), paunch The measurements were taken as below (FAO, 2012):
1. Chest girth (CG) was measured as a circumferential measure taken around the chest just behind the front legs and withers.
2. Wither height (WH) was measured as the vertical distance from the top of the withers to the ground.
3. Body length (BL) was the distance from the base of the ear to the base of the tail (where it joins the body).
4. Chest depth (CD) was measured as the vertical distance from sternum to withers.
5. Paunch length (PL) is the distance between the front and rear legs of the animal.
6. Cannon circumference (CC) was measured from the left mid metacarpus.
7. Head length (HEL) was the distance measured from the nodule of the horn to the upper lip of the animal.
8. Paunch girth (PG) was measured as the circumference of the body immediately after the abdomen just before the hind legs.
9. Paunch height (PH) was measured as the distance from the surface of a platform to the paunch of the animal, where, the paunch is defined as: the underside part of the animal trunk below the ribs, containing the stomach and intestine or the part of the underside between the legs.
10. Neck circumference (NC) was measured as the circumference of the neck at the midpoint.
Statistical Analysis
Statistical analysis for body weight and morphometric measurements was carried out with SPSS Statistical Package for Social Sciences version 17.0 (2008). The coefficient of variation (CV) was calculated via the expression CV = (Sj/Ẍj)*100, where Ẍj is the mean of variable Xj and Sj is the standard deviation of variable Xj. Data collected were classified according to sex and age. Three age groups: Group 1 (1 Pair), group 2 (2 Pairs) and group 3 (3 Pairs) were used and the significant means were analyzed by one-way analysis of variance (ANOVA). The average means of the morphological traits were compared according to sex using Independent T-test. Pearson’s coefficient of correlation was measured between body weight and morphometric measurements. This was done separately for the two sexes in cases of significant sex effect and for three groups in cases of significant dentition effect. Linear body measurements were regressed on body weight to develop simple linear, multiple linear and quadratic regression equations that can estimate body weight. Live body weight was regressed on morphometric measurements using stepwise multiple linear regression analysis. The model used to analyze body weight and other morphometric measurements were: Yijk = μ + Si +Tj + eijk where Yijk is the observation on body weight and other morphometric measurements; μ is the overall mean; Si is the fixed effect of sex (I = Female, Male); Tj is the fixed effect of dentition (j = 1, 2 and 3); eijk is the effect of random error. The coefficient of determination (R2) was used to assess the accuracy of prediction equations between live body weights and morphometric measurements. Separate prediction equations were developed for the fixed effect of sex and age. The multiple linear regression equation for fitting standardized live body weight and the factor scores equation are expressed below:
Yj = β0 X0+ β1 X1 + ej…………..for male.
Yj = β0 X0+ β1 X1 + β2 X2+ β3 X3 + β4 X4+ ej…………..for female.
Yj = β0 X0+ β1 X1 + ej…………..for 1 pair.
Yj = β0 X0+ β1 X1 + ej…………..for 2 pair.
Yj = β0 X0+ β1 X1 + β2 X2+ β3 X3 + ej…………..for 3 pair.
Where: Yj = the dependent variable (live body weight); β0= the intercept; X1 is the independent variables NC for male, X1, X2 and X3 are the independent variables PG, CG and CC for female, X1 is the independent variables CD for I pair, X1 is the independent variables WH for 2 pairs and X1, X2 and X3 are the independent variables NC, PG and CC for 3 pairs, respectively and β1 , β2 and β3 are the regression coefficient of these variable. ej = the residual error.
RESULT AND DISCUSSION
Statistical Description of Live Body Weight (Kg) and Body Measurements (Cm) of Boer Goats.
Table (1) shows the least square means for live body weight (LBW) and morphometric measurements (MM) of Boer
Table 1: Statistical description of live body weight (kg) and body measurements (cm) of Boer goats
| Traits | Mean | ±SE | SD | Min | Max | CV (%) |
| LBW | 43.30 | 3.33 | 14.90 | 20.00 | 72.00 |
34.41 |
| CG | 80.10 | 2.20 | 9.84 | 66.00 | 102.00 |
12.28 |
| WH | 62.35 | 1.15 | 5.18 | 53.00 | 72.00 |
8.30 |
| BL | 85.35 | 1.66 | 7.43 | 75.00 | 101.00 |
8.70 |
| CD | 30.25 | 0.63 | 2.84 | 26.00 | 36.00 |
9.38 |
| PL | 40.50 | 1.33 | 5.98 | 30.00 | 52.00 |
14.76 |
| CC | 9.65 | 0.30 | 1.34 | 8.00 | 12.00 |
13.88 |
| HEL | 17.95 | 0.35 | 1.60 | 15.00 | 21.00 |
8.91 |
| PG | 100.25 | 2.48 | 11.09 | 81.00 | 121.00 |
11.06 |
| PH | 30.30 | 0.30 | 1.38 | 28.00 | 33.00 |
4.55 |
| NC | 39.00 | 2.45 | 10.95 | 27.00 | 63.00 |
28.07 |
(SD) standard deviation, (SE)standard error, (CV) coefficient of variation, (LBW) live body weight, (CG) chest girth, (WH) wither height, (BL) body length, (CD) chest depth, (PL) paunch length, (CC) cannon circumference, (HEL) head length, (PG) paunch girth, (PH) paunch height and (NC) neck circumference.
Table 2: Statistical description of live body weight (kg) and body measurements (cm) of Boer goats based on sex.
|
Group Statistics |
N |
LBW (kg) |
Body Measurements (cm)
|
|||||||||
| CG | WH | BL | CD | PL | CC | HEL | PG | PH |
NC |
|||
|
Mean ± SE |
Mean ± SE |
Mean ± SE |
Mean ± SE |
Mean ± SE |
Mean ± SE |
Mean ± SE |
Mean ± SE |
Mean ± SE |
Mean ± SE |
Mean ± SE |
||
| Male | 10 |
45.70 ±6.06 |
82.10 ±3.92 |
62.70 ±2.07 |
87.60 ±2.95 |
31.70* ±0.85 |
42.50 ±2.15 |
10.20 ±0.51 |
18.20 ±0.29 |
103.8 ±3.79 |
30.60 ±0.52 |
45.30* ±3.87 |
| Female | 10 |
40.90 ±2.97 |
78.10 ±2.04 |
62.00 ±1.15 |
83.10 ±1.34 |
28.80* ±0.71 |
38.50 ±1.43 |
9.10 ±0.23 |
17.70 ±0.66 |
96.70 ±2.96 |
30.00 ±0.33 |
32.70* ±1.24 |
*: significant at the level of probability 5%., (SE)Standard error, (LBW) live body weight, (CG) chest girth, (WH) wither height, (BL) body length, (CD) chest depth, (PL) paunch length, (CC) canon circumference, (HEL) head length, (PG) paunch girth, (PH) paunch height and (NC) neck circumference.
goats. The coefficient of variation (CV) varied from 4.55 % to 28.07 %. Therefore, a moderately variation is shown in the body measurements. Regardless of the effect of both sex and age, LBW had the highest CV value (34.41%) compared to the other morphometric measurements. The different of values of the coefficient of variation due to the different of ages in goats under study. This is in line with what was decided in Shami goats, CV in the morphometric traits ranged from 9.70 % to 20.0 %, this indicates homogeneity between traits under study (Abd-Allah. et al., 2019).
The results in Table (2) indicates that the live body weight (LBW), chest girth (CG), wither height (WH) , body length (BL), chest depth (CD), paunch length (PL), canon circumference (CC), head length (HEL), paunch girth (PG), paunch height (PH) and neck circumference (NC) were higher for male goats compared with of female. Means of live body weight were not significantly different between male and female goats. Average LBW was not significantly (P < 0.05) lower in females than in males (Table 2).
The lowest values reported for the LBW of females compared to males seem in accordance with earlier reports on goats (Vargas et al., 2007). The results thus obtained in this study agree with our previous studies on Shami goats (Abd-Allah et al., 2019). Also, our previous results have indicated that the lower LBW of female Boer crosses after maturity may be attributed to birth and weaning weight; this is because they were born lighter than male kids (Abd-Allah et al., 2016). The results indicated that there was a numerical mean difference between males and females in all MM, but these differences were not significant (P < 0.05) except for CH and NC only. Also, the male had the highest CG, WH, BL, PL, CC, HEL, PG and PH but these differences were not significant (P < 0.05), Table, 2. Isaac (2005) recorded that the effect of sexual dimorphism in body size is easy to perceive widespread among many mammalian taxa, with male-biased dimorphism being the more common, but certainly not the exclusive pattern.
Female goats were noted to be lighter in weight, shorter in body length, shorter in height at withers and smaller in heart girth compared with of male goats as was also reported by Nor Azhani et al. (2011) and Khan et al. (2006). Our results of the present study recorded that, CG, 82.10 (cm) and WH, 62.70 (cm) in male goats. The observations of the current study are somewhat different from those of Nor Azhani et al. (2011) who reported the low mean value of HG (78.80) but was high of WH (64.15) in male goats on the same breed. The difference in body measurements in other reports on the Boer goats may be due to the difference in size of data set, the environment and other management practices.
Boer goats are exhibiting different body measurements according to sex and age. Figure 1 show that the male goats were superior compared to females in all the traits measured. This agrees with reports of Akpa et al. (1998) and Osuhor et al. (2002) who reported a significant effect of sex on morphometric traits, with the males being superior to the females. The results obtained in this study were in contrast to the work of Asuku (2010) and Ijomanta (2012) who reported the superiority of females over males. The superiority of males in morphometric traits over the females in this study could be due to the few numbers of does that were studied in 3 pairs group (n=2). According to the sex type, the coefficient of variation (CV) in all morphological traits ranged from 8.4% to 12.55%, while was lower in female 8.4 % compared to male 12.55 % (Fig.,1). This means that homogeneity between females was greater than that of males. Sex has been shown to be an important source of variation for body weight and morphometric traits of goats.

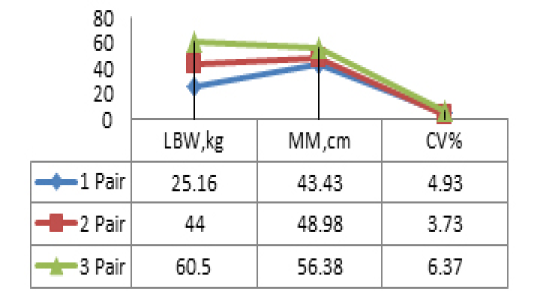
The results further recorded that there were significant differences (P < 0.05) observed between the three age groups in LBW and MM, Table 3. In general, this is due to the disparity in ages among the animals were studied. These findings are in harmony with that of Nor Azhani et al. (2011) who reported that live body weight and linear body measurements would increase for goats got older.
According to the age type, the coefficient of variation (CV) in all morphological traits ranged from 3.73% to 6.37% in all age groups. Two pairs group recorded lower present of CV (3.73%) compared to of 1 pair and 3 pairs (4.93% and 6.37%), respectively (Figure 2). This is means that homogeneity between goats aged from 2 to 3 years was greater than that of other age groups under study. Of course, as expected the adult goats were more superior compared with of yearling and young goats in all the traits measured.
Correlation Coefficients among Live Body Weight (Kg) and Body Measurements (Cm) of Boer Goats
The correlation coefficients were calculated between live body weight and body measurement and between the body measurements of the two sexes and three age groups are shown in Table (4). From Pearson’s coefficients of correlation, there were high, positive and significant (p<0.01) correlations between LBW and body measurements. The correlation coefficients ranged from 0.594 to 0.999 between live body weight and the body measurements. The correlations between different body measurements ranged from 13% to 100% in Boer goat. Obviously here that the most of correlation coefficients between measurements were high and significant (P < 0.01) in both males and females. The highest and strongly positive correlation (P < 0.01) was recorded between LBW and NC (0.997) for the male and of PG (0.978) for female goats. On the other hand, The highest and strongly positive correlation (P < 0.01) was listed between LBW and CD (0.938) for 1 pair, of WH (0.956) for 2 pairs and of NC (0.999) for 3 pairs goats.
While, lower estimates were recorded for the correlation of LBW with both CG (r= 0.84) for male, of HEL (r= 0.59) for female, of CC (r= 0.65) for 1 pair and 2 pairs and of CC (r= 0.76) for 3 pairs. The results are supported by Nor Azhani et al. (2011), who decided high and significant (p<0.01) correlations between LBW and BL, WH and CG with correlation coefficients (r) of 0.93, 0.91 and 0.97, respectively, and also between the body measurements in Boer goats. Similarly, Abd-Allah et al. (2019), Abdel-Ma
Table 3: Statistical description of of live body weight (kg) and body measurements (cm) of Boer goats based on age.
|
Group Statistics |
N |
LBW (kg) |
Body Measurements (cm)
|
|||||||||
| CG | WH | BL | CD | PL | CC | HEL | PG | PH |
NC |
|||
|
Mean ± SE |
Mean ± SE |
Mean ± SE |
Mean ± SE |
Mean ± SE |
Mean ± SE |
Mean ± SE |
Mean ± SE |
Mean ± SE |
Mean ± SE |
Mean ± SE |
||
|
1 Pair |
6 |
25.16 a ± 1.13 |
68.83a ± 0.98 |
55.83a ± 0.98 |
77.83a ± 1.01 |
27.33a ± 0.33 |
34.33a ± 1.28 |
8.333a ±0.21 |
16.16a ± 0.30 |
87.66a ± 2.55 |
28.66a ± 0.21 |
29.33a ± 0.80 |
|
2 Pairs |
8 |
44.00 b ± 1.19 |
80.25b ± 1.25 |
63.25b ± 0.45 |
84.12b ± 0.91 |
29.75b ± 0.25 |
39.75b ± 0.31 |
9.375b ± 0.18 |
17.87b ± 0.12 |
1.007b ± 1.48 |
30.50b ± 0.18 |
35.00b ± 0.59 |
|
3 Pairs |
6 |
60.50c ± 3.40 |
91.16 c ± 2.74 |
67.66 c ± 1.14 |
94.50 c ± 1.99 |
33.83 c ± 0.74 |
47.66 c ± 1.68 |
11.33 c ± 0.33 |
19.83c ± 0.40 |
1.121c ± 2.67 |
31.66c ± 0.42 |
54.00c ± 2.60 |
a, b and c Mean within column with different superscripts is significantly different (P < 0.05). (SE)standard error, (LBW) live body weight, (CG) chest girth, (WH) wither height, (BL) body length, (CD) chest depth, (PL) paunch length, (CC) canon circumference, (HEL) head length, (PG) paunch girth, (PH) paunch height and (NC) neck circumference.
Table 4: Correlation coefficients among live body weight (kg) and body measurements (cm) of Boer goats.
| Traits | Groups | LBW | CG | WH | BL | CD | PL | CC | HEL | PG | PH | NC |
|
LBW |
Male |
0.838** |
0.894** |
0.983** |
0.952** |
0.917** |
0.962** |
0.967** |
0.973** |
0.960** |
0.997** | |
| Female |
0.898** |
0.821** |
0.877** |
0.786** |
0.810** |
0.786** |
0.594 |
0.978** |
0.863** |
0.957** |
||
| 1 Pair |
0.812* |
0.812* |
0.785 |
0.938** |
0.906* |
0.649 |
0.937** |
0.808 | 0.741 |
0.791 |
||
| 2 Pairs |
0.920** |
0.956** |
0.914** |
0.837** |
0.906** |
0.653 |
0.717* |
0.885** |
0.791* |
0.875** |
||
| 3 Pairs |
0.981** |
0.975** |
0.994** |
0.974** |
0.894* |
0.764 |
0.964** |
0.997** |
0.976** |
0.999** |
||
| CG | Male |
0.838** |
0.680* |
0.801** |
0.811** |
0.663* |
0.784** |
0.841** |
0.760* |
0.758* |
0.848** |
|
| Female |
0.898** |
0.712* |
0.813** |
0.743* |
0.561 |
0.721* |
0.427 |
0.812** |
0.768** |
0.883** |
||
| 1 Pair |
0.812* |
1.000** |
0.766 | 0.748 |
0.857* |
0.699 | 0.793 |
0.835* |
0.753 |
0.946** |
||
| 2 Pairs |
0.920** |
0.898** |
0.949** |
0.943** |
0.798* |
0.800* |
0.486 |
0.957** |
0.832* |
0.956** |
||
| 3 Pairs |
0.981** |
0.978** |
0.963** |
0.925** |
0.872* |
0.715 |
0.911* |
0.973** |
0.958** |
0.986** |
||
| WH | Male |
0.894** |
0.680* |
0.870** |
0.850** |
0.832** |
0.936** |
0.794** |
0.883** |
0.871** |
0.886** |
|
| Female |
0.821** |
0.712* |
0.644* |
0.419 |
0.712* |
0.784** |
0.298 |
0.824** |
0.693* |
0.779** |
||
| 1 Pair |
0.812* |
1.000** |
0.766 | 0.748 |
0.857* |
0.699 | 0.793 |
0.835* |
0.753 |
0.946** |
||
| 2 Pairs |
0.956** |
0.898** |
0.937** |
0.867** |
0.943** |
0.700 |
0.709* |
0.915** |
0.834* |
0.923** |
||
| 3 Pairs |
0.975** |
0.978** |
0.977** |
0.959** |
0.886* |
0.757 |
0.919** |
0.961** |
0.921** |
0.982** |
||
| BL | Male |
0.983** |
0.801** |
0.870** |
0.942** |
0.930** |
0.938** |
0.962** |
0.974** |
0.963** |
0.988** |
|
| Female |
0.877** |
0.813** |
0.644* |
0.664* |
0.649* |
0.598 | 0.421 |
0.855** |
0.669* |
0.876** |
||
| 1 Pair | 0.785 | 0.766 |
0.766 |
0.921** |
0.957** |
0.676 | 0.767 |
0.962** |
0.884* |
0.874* |
||
| 2 Pairs |
0.914** |
0.949** |
0.937** |
0.878** |
0.887** |
0.813* |
0.644 |
0.976** |
0.775* |
0.947** |
||
| 3 Pairs |
0.994** |
0.963** |
0.977** |
0.992** |
0.901* |
0.802 |
0.978** |
0.989** |
0.951** |
0.993** |
||
| CD | Male |
0.952** |
0.811** |
0.850** |
0.942** |
0.949** |
0.901** |
0.973** |
0.966** |
0.966** |
0.951** |
|
| Female |
0.786** |
0.743* |
0.419 |
0.664* |
0.589 |
0.682* |
0.612 |
0.702* |
0.749* |
0.781** |
||
| 1 Pair |
0.938** |
0.748 | 0.748 |
0.921** |
0.962** |
0.632 |
0.868* |
0.888* |
0.791 |
0.789 |
||
| 2 Pairs |
0.837** |
0.943** |
0.867** |
0.878** |
0.798* |
0.683 | 0.429 |
0.890** |
0.756* |
0.956** |
||
| 3 Pairs |
0.974** |
0.925** |
0.959** |
0.992** |
0.915* |
0.845* |
0.979** |
0.967** |
0.915* |
0.973** |
||
| PL | Male |
0.917** |
0.663* |
0.832** |
0.930** |
0.949** |
0.878** |
0.948** |
0.947** |
0.932** |
0.903** |
|
| Female |
0.810** |
0.561 |
0.712* |
0.649* |
0.589 | 0.482 |
0.801** |
0.893** |
0.792** |
0.843** |
||
| 1 Pair |
0.906* |
0.857* |
0.857* |
0.957** |
0.962** |
0.781 |
0.902* |
0.975** |
0.822* |
0.885* |
||
| 2 Pairs |
0.906** |
0.798* |
0.943** |
0.887** |
0.798* |
0.545 |
0.798* |
0.825* |
0.603 |
0.858** |
||
| 3 Pairs |
0.894* |
0.872* |
0.886* |
0.901* |
0.915* |
0.929** |
0.870* |
0.867* |
0.812* |
0.902* |
||
| CC | Male |
0.962** |
0.784** |
0.936** |
0.938** |
0.901** |
0.878** |
0.897** |
0.907** |
0.908** |
0.950** |
|
| Female |
0.786** |
0.721* |
0.784** |
0.598 |
0.682* |
0.482 | 0.131 |
0.695* |
0.571 |
0.660* |
||
| 1 Pair | 0.649 | 0.699 | 0.699 | 0.676 | 0.632 |
0.781 |
0.857* |
0.847* |
0.500 |
0.657 |
||
| 2 Pairs | 0.653 |
0.800* |
0.700 |
0.813* |
0.683 |
0.545 |
0.293 |
0.904** |
0.775* |
0.816* |
||
| 3 Pairs | 0.764 | 0.715 | 0.757 | 0.802 |
0.845* |
0.929** |
0.830* |
0.735 | 0.632 |
0.767 |
||
| HEL | Male |
0.967** |
0.841** |
0.794** |
0.962** |
0.973** |
0.948** |
0.897** |
0.959** |
0.953** |
0.963** |
|
| Female | 0.594 | 0.427 | 0.298 | 0.421 | 0.612 |
0.801** |
0.131 |
0.665* |
0.803** |
0.693* |
||
| 1 Pair |
0.937** |
0.793 | 0.793 | 0.767 |
0.868* |
0.902* |
0.857* |
0.864* |
0.686 |
0.766 |
||
| 2 Pairs |
0.717* |
0.486 |
0.709* |
0.644 | 0.429 |
0.798* |
0.293 | 0.553 | 0.378 |
0.478 |
||
| 3 Pairs |
0.964** |
0.911* |
0.919** |
0.978** |
0.979** |
0.870* |
0.830* |
0.967** |
0.919** |
0.955** |
||
| PG | Male |
0.973** |
0.760* |
0.883** |
0.974** |
0.966** |
0.947** |
0.907** |
0.959** |
0.986** |
0.974** |
|
| Female |
0.978** |
0.812** |
0.824** |
0.855** |
0.702* |
0.893** |
0.695* |
0.665* |
0.854** |
0.946** |
||
| 1 Pair | 0.808 |
0.835* |
0.835* |
0.962** |
0.888* |
0.975** |
0.847* |
0.864* |
0.826* |
0.890* |
||
| 2 Pairs |
0.885** |
0.957** |
0.915** |
0.976** |
0.890** |
0.825* |
0.904** |
0.553 |
0.827* |
0.966** |
||
| 3 Pairs |
0.997** |
0.973** |
0.961** |
0.989** |
0.967** |
0.867* |
0.735 |
0.967** |
0.985** |
0.994** |
||
| PH | Male |
0.960** |
0.758* |
0.871** |
0.963** |
0.966** |
0.932** |
0.908** |
0.953** |
0.986** |
0.966** |
|
| Female |
0.863** |
0.768** |
0.693* |
0.669* |
0.749* |
0.792** |
0.571 |
0.803** |
0.854** |
0.908** |
||
| 1 Pair | 0.741 | 0.753 | 0.753 |
0.884* |
0.791 |
0.822* |
0.500 | 0.686 |
0.826* |
0.919** |
||
| 2 Pairs |
0.791* |
0.832* |
0.834* |
0.775* |
0.756* |
0.603 |
0.775* |
0.378 |
0.827* |
0.791* |
||
| 3 Pairs |
0.976** |
0.958** |
0.921** |
0.951** |
0.915* |
0.812* |
0.632 |
0.919** |
0.985** |
0.970** |
||
|
NC
|
Male |
0.997** |
0.848** |
0.886** |
0.988** |
0.951** |
0.903** |
0.950** |
0.963** |
0.974** |
0.966** |
|
| Female |
0.957** |
0883** |
0.779** |
0.876** |
0.781** |
0.843** |
0.660* |
0.693* |
0.946** |
0.908** |
||
| 1 Pair | 0.791 |
0.946** |
0.946** |
0.874* |
0.789 |
0.885* |
0.657 | 0.766 |
0.890* |
0.919** |
||
| 2 Pairs |
0.875** |
0.956** |
0.923** |
0.947** |
0.956** |
0.858** |
0.816* |
0.478 |
0.966** |
0.791* |
||
| 3 Pairs |
0.999** |
0.986** |
0.982** |
0.993** |
0.973** |
0.902* |
0.767 |
0.955** |
0.994** |
0.970** |
**. Correlation is significant at the 0.01 level (2-tailed). *. Correlation is significant at the 0.05 level (2-tailed).
(LBW) live body weight, (CG) chest girth, (WH) wither height, (BL) body length, (CD) chest depth, (PL) paunch length, (CC) canon circumference, (HEL) head length, (PG) paunch girth, (PH) paunch height and (NC) neck circumference.
geed and Ghanem (2013), Mukherjee et al. (1981) and Singh and Mishra (2004), who reported a higher significant correlation between body weight with chest girth in Shami, brown Bengal does, grey Bengal and Barbari goats, rspectively. The results of the study for males were in contrast to with what is found by Bhattacharya et al. (1984) and Islam et al. (1991) who reported that chest girth in males is a good predictor of LBW in Bengal goats, which is maybe used as a good reliable predictor to assess LBW. Since there are high correlation coefficients between LBW and MM, either of these variables or combination could provide a good estimate for predicting LBW in Boer goats. Khan et al. (2006) reported that, since the MM had a high correlation with the LBW, this may be used as selection criteria. On the other hand, Ott (1986) concluded that determination of scrotal length and circumference is an important aspect of breeding soundness examination (BSE) and scrotal circumference has great value as an indicator of genetic trait, puberty and total spermatozoa production.
Prediction of Body Weight (kg) from Body Measurements (cm)
Stepwise regression analysis was used to obtain the best prediction equations for live body weight from linear and circumferences body measurement traits as seen in Table (5). Different live body weight prediction equations were obtained based on different body part measurement. According to R2, the best prediction equations were LBW= - 41.170 + 0.748* NC + 0.524* PG 0.220* CC. According to the importance of the independent variables in predicting LBW of Boer goats, six body measurements namely; chest girth, wither height, chest depth, cannon circumference, paunch girth, and neck circumference were found to be more efficient. Thus, they were the variables entered to obtain the optimal regression models. As stated by the results of this study, the highest correlation was determined between LBW and NC in the male group. It is necessary here to say that, LBW of goats can be predicted from NC with R2 (0.99) for male and PG, CG and CC with R2 (0.996) for female. Based on age type LBW can be predicted from (CD), (WH) and (NC, PG, CC) for 1 pair, 2 pairs and 3 pairs with R2 0.88, 0.91 and 1, respectively.
Table 5: Regression equations developed to estimate weight (kg) from body measurements (cm) of Boer goats
| Groups | Model | R |
R2 |
Adj. R2 |
±S.E |
R2 Change |
F Change | Sig. F Change |
|
Male |
1 |
0.997a |
0.993 | 0.992 | 1.68329 | 0.993 | 1158.810 |
0.000 |
| Model Summary | Prediction equations | |||||||
| a. Predictors: (Constant), NC |
LBW= -24.997+ 1.561*NC |
|||||||
| Female | 1 |
0.978a |
0.956 | 0.950 | 2.10061 | 0.956 | 172.598 |
0.000 |
| 2 |
0.994b |
0.988 | 0.985 | 1.16777 | 0.032 | 18.886 |
0.003 |
|
| 3 |
0.998c |
0.996 | 0.993 | 0.76538 | 0.008 | 10.295 |
0.018 |
|
| Model Summary | Prediction equations | |||||||
| a. Predictors: (Constant), PG | LBW= -53.920+ 0.981* PG | |||||||
| b. Predictors: (Constant), PG, CG | LBW= -64.735+ 0.730* PG + 0.449* CG | |||||||
| c. Predictors: (Constant), PG, CG, CC | LBW= -68.972+ 0.688* PG + 0.361* CG + 1.663* CC | |||||||
| 1 Pair | 1 |
0.938a |
0.879 | 0.849 | 1.08397 | 0.879 | 29.050 |
0.006 |
| Model Summary | Prediction equations | |||||||
| a. Predictors: (Constant), CD | LBW = -62.300+3.200*CD | |||||||
| 2 Pairs | 1 |
0.956a |
0.914 | 0.900 | 1.07001 | 0.914 | 63.873 |
0.000 |
| Model Summary | Prediction equations | |||||||
| a. Predictors: (Constant), WH | LBW= -115.500+2.522*WH | |||||||
| 3 Pairs | 1 |
0.999a |
0.998 | 0.998 | 0.40524 | 0.998 | 2112.119 |
0.000 |
| 2 |
1.000b |
1.000 | 1.000 | 0.13919 | 0.002 | 30.902 |
0.011 |
|
| 3 |
1.000c |
1.000 | 1.000 | 0.02241 | 0.000 | 113.786 |
0.009 |
|
| Model Summary | Prediction equations | |||||||
| a. Predictors: (Constant), NC | LBW= -9.912+1.304*NC | |||||||
| b. Predictors: (Constant) NC, PG | LBW= -36.535+ 0.829* NC+ 0.466* PG | |||||||
| c. Predictors: (Constant), NC, PG, CC | LBW= -41.170+ 0.748* NC + 0.524* PG + 0.220* CC | |||||||
Dependent Variable: LBW (LBW) live body weight, (CG) chest girth, (WH) wither height, (CD) chest depth, (CC) canon circumference, (PG) paunch girth and (NC) neck circumference.
Table 6: Measured and predicted live body weights (kg) of Boer goats in Egypt
| Groups | Prediction equations |
Adj. R2 |
MLBW, kg | PLBW, kg |
Residual |
| Male | LBW= -24.997+ 1.561*NC |
0.99 |
45.70 | 45.72 |
-0.02 |
|
Female
|
LBW= -53.920+ 0.981* PG |
0.95 |
40.90 |
41.57 |
-0.85 |
|
LBW= -64.735+ 0.730* PG + 0.449* CG |
0.98 |
40.92 |
-0.02 |
||
| LBW= -68.972+ 0.688* PG + 0.361* CG + 1.663* CC | 0.99 | 40.88 |
0.12 |
||
| 1 Pair | LBW = -62.300+3.200*CD | 0.85 | 25.16 | 25.15 |
0.01 |
| 2 Pairs | LBW= -115.500+2.522*WH | 0.90 | 44.00 | 44.02 |
-0.02 |
| 3 Pairs | LBW= -9.912+1.304*NC | 0.99 |
60.50 |
60.50 |
0.00 |
| LBW= -36.535+ 0.829* NC+ 0.466* PG | 1.00 | 60.42 |
0.08 |
||
| LBW= -41.170+ 0.748* NC + 0.524* PG +0 .220* CC | 1.00 | 60.39 |
0.11 |
LBW: Live body weight, MLBW: Measured live body weight, PLBW: Predicted live body weight, Adj. R2 : Adjusted R2, CG: Chest girth, WH: Wither height, CD: Chest depth, CC: Cannon circumference, PG: Paunch girth And NC: Neck circumference.
The best-fitted regression models in each group were included in Table (5).
Predicted Live Body Weights (kg) from Body Measurements (cm) of Boer Goat Based on Sex and Age
The measured and the predicted live body weight using the best-fitted regression models, as found in the study, are summarized in Table (6). PLBW based on NC measurements had an adjusted R2 value of 0.992 to MLBW for male, while PLBW obtained using PG, CG and CC model gave an adjusted R2 value of 0.993 to MLBW for female (Table 6). The predictive value of the linear body measurement had been used to determine LBW by Abd-Allah et al. (2019) and Benyi (1997) in goats and Abd-Allah et al. (2018) and Atta and El-Khidir (2004) in sheep, who recorded that CG was a useful tool in this regard. in past studies, when they were used linear regression equations to estimate live body weight from the measurement of CG in 78 West African Dwarf and 73 Sahel cross West African Dwarf goats. The coefficients of variations (R2) ranged from 0.87 to 0.92 for the linear equations, respectively (Benyi, 1997). On the other hand, PLBW based on CD measurements had an adjusted R2 value of 0.894 to MLBW for 1 pair, in addetion, PLBW based on WH measurements had an adjusted R2 value of 0.900 to MLBW for 2 pairs while PLBW obtained using NC, PG and CC model gave an adjusted R2 value of 1.00 to MLBW for 3 pairs (Table 6). The high adjusted R2 values between PLBW and MLBW indicate to the validity of using these models for predicting LBW of Boer goats. Furthermore, the obtained results of this study are in close agreement with Abd-Allah et al. (2019) and Matsebula et al. (2013), who reported that measurements give credence to the validity of using these models for predicting LBW of Shami and Swazi goats, respectively.
CONCLUSION
To our knowledge, this may be the first fieldwork to characterize Boer goat breed using morphological characteristics in Egypt. Boer goats is one of the breeds that were used to improve the Egyptian breeds of goats by application crossbreeding schemes in Egypt, especially as it is an attractive morphological breed of great potential for meat and show compared with our local Egyptian breeds. in this context, we may conclude that, in order to practice good goats husbandry, the measurement of LBW is totally essential for breeding, nutrition and management. The results obtained from this research indicate the positive and significant correlation of LBW with MM, as such indicates that MM can be used as a marker to estimate LBW using regression equations. In the current research both of the effects of age and sex were evaluated, but, this field of study in Boer goats needs further studies with increasing the sample size to clarify the influence of age and sex on the predicting models.
LIST OF ABBREVIATIONS
LBW: live body weight,. MM: morphometric measurements, CG: chest girth, WH: wither height, BL: body length, CD: chest depth, (PL) paunch length, CC: canon circumference, (HEL) head length, HG: heart girth, PG: paunch girth, PH: paunch height and NC: neck circumference, BSE: breeding soundness examination, BCS: body condition score, SPSS: Statistical Package for Social Sciences. FASS: Federation of Animal Science Societies, BSE: Breeding soundness examination, CFM: concentrate feed mixture, SD: standard deviation, SE: standard error, CV: coefficient of variation, MLBW: measured live body weight, PLBW: predicted live body weight and Adj. R2 : Adjusted R2.
CONFLICT OF INTEREST
All authors declared that this field work was performed without any conflict of interest.
ACKNOWLEGEMENTS
The authors gratefully acknowledge the technical and financial support of Agricultural Directorate in El-Tor city, South Sinai Governorate, through the project of (Technology Transfer for the Development of Small Ruminant in Southern Sinai in cooperation with Animal Production Department, National Research Centre.
AUTHOR CONTRIBUTIONS
AS performed the fieldwork and wrote the manuscript. MMS (PI of the project) and FMS reviewed the manuscript. MIM, HHA and AAA participated in performed the farm experiments and collected data. All authors wrote, read and approved the final manuscript.
REFERENCES


