Advances in Animal and Veterinary Sciences
Research Article

A proposal of Carcass Grading System for Cull Cows Using Principal Component Analysis
Ahmed Slimene1*, Chokri Damergi2, Taha Najar2, Moncef Ben Mrad2
1Interprofessionnal Group for Red Meats and Dairy Products, 8 Rue Claude Bernard 1002, Tunis, Tunisie; 2Department of Animal Resources, Fisheries and Food Technology, National Institute of Agronomy of Tunisia, 43, Avenue Charles Nicolle, 1083, Tunis, Tunisie.
Abstract | A total of 55 carcasses of cull cows between 6 and 13 old years were evaluated for conformation and fatness in the objective to develop a carcass grading standard using morphometric measurements. The slaughtered cull cows are mainly Holstein. Carcass measurements performed at the slaughterhouse were: length of the carcass, perimeter of the hind leg, depth of the carcass, length and thickness of the hind leg. Hot carcass weight, thickness of fat cover at the sixth rib and kidney fat weight were recorded. Carcass characterization was performed using principal component analysis and cluster. Correlations were determined among the carcass measurements. Analysis of variance was also performed to determine significant difference between the three classes of carcasses found in this study (P<0.05). Our results showed the existence of three groups of carcass defined as following: Carcasses with a low conformation and a small frame size, Carcasses with an average conformation and a medium frame size and Carcasses with a fairly good conformation and a large frame size. This study provides a basis for a carcass classification grid using quantitative measurements that meets the needs of butchers and meat processors to balance price grade of marketed carcasses.
Keywords | Carcass measurements, Cull cows, Classification, Component analysis, Cluster analysis.
Received | March 21, 2019; Accepted | June 10, 2019; Published | September 25, 2019
*Correspondence | Ahmed Slimene, Interprofessionnal Group for Red Meats and Dairy Products, 8 Rue Claude Bernard 1002, Tunis, Tunisie; Email: a_slimene@yahoo.com
Citation | Slimene A, Damergi C, Najar T, Mrad MB (2019). A proposal of carcass grading system for cull cows using principal component analysis. Adv. Anim. Vet. Sci. 7(10): 858-865.
DOI | http://dx.doi.org/10.17582/journal.aavs/2019/7.10.858.865
ISSN (Online) | 2307-8316; ISSN (Print) | 2309-3331
Copyright © 2019 Slimene et al. This is an open access article distributed under the Creative Commons Attribution License, which permits unrestricted use, distribution, and reproduction in any medium, provided the original work is properly cited.
INTRODUCTION
Several countries worldwide have established systems of cattle carcass classification to better balance between market prices and the value of the carcasses marketed. These different systems are based on assessing the carcass by measurements or visual appraisal by trained personnel working in the slaughterhouse. The system used in the European countries uses two main parameters (Office for Official Publications of the European Communities, 1981). The first one is conformation and the second is fatness degree using a template grid developed by professionals. In the United States of America (USA) the system is composed of two grades, the quality grade includes marbling and maturity and the yield grade includes the hot carcass weight (USDA, 1997). Australia and Canada have identified several measurements similar to those used in the USA to allow a better evaluation of their conformations (AUS-MEAT, 2005; CBGA, 2010). In Tunisia, however, there is no carcass classification grid used in either the slaughterhouse or in the meat processing plant. Butchers make their transactions mainly through a subjective evaluation of fattening degree and conformation. Hence, there is a need to develop a carcass classification system based on objective measurements that consider the criteria taken into account by butchers. This will facilitate commerce among the various operators involved in the red meat industry in Tunisia (Belhadj, 1998).
Several authors used a multivariate and a principal component analysis to characterize carcass from many species such as beef cattle, sheep and goats (Laville et al., 1996; Destefanis et al., 2000; Spanghero et al., 2004; Alberti et al., 2005; Alberti et al., 2008; Santos et al., 2008; Slimene et al., 2012; Konarska et al., 2017; Prieto et al., 2018; Cadavez et al., 2019). Others used carcass measurements to determine carcass characteristics of several beef breeds at different ages and to identify variability between dairy and beef breeds. (Clarke et al., 2009; Campion et al., 2009; Yilmaz and Denk, 2009; Gagaoua et al., 2018). Measurements on the beef carcasses were taken to establish carcass cut yields. (Abraham et al., 1968; Busch, et al., 1968; Epley et al., 1970; Cross et al., 1973; Huerta-Leidenz et al., 2018; McEvers et al., 2018; Gudex et al., 2019). The objective of this study was to characterize carcasses of cull cows aged between 6 and 13 years in terms of conformation and fatness degree using objective measurements to determine the different carcass grades perceived by butchers and producers in the livestock markets. The result of this study can be used as a basis for the development of a carcass grading system for cattle in Tunisia.
MATERIAL AND METHODS
The experiment was conducted in accordance with the principles and specific guidelines described in the Tunisian regulations (Livestock Law No 2005-95) with regards to breeding and slaughtering. The Livestock rules and regulations of Tunisia is aimed to organize the livestock sector, enhance the genetic improvement of the herd and its productivity, preserve and protect the livestock health as well as ensure the quality and safety of foods of animal origin.
Animal and Collected Data
A total of 55 Holstein cull cows selected randomly were slaughtered in a small commercial plant to characterize their carcasses quality. The small commercial plant (private) is located in the northern region of the country and harvests an average of 15 head per day. In general, cull cows could come from two production systems: a large scale dairy cattle intensive system composed by Holstein, where cows are raised on hay, corn silage, and concentrate; and landless small scale dairy cattle system composed by Holstein and local crossbred cows raised on hay and concentrate. Animals were slaughtered at an average age of 8 years at slaughter. No production information was available. Chest girth measurement was recorder before the slaughter. Live weight before slaughter was determined using chest girth measurement and applying the formula (live weight, kg = 0.00029 *(chest girth, cm)2.75) established by Brody et al. (1937). Live weight of a cow was averaged at 550 kg.
Carcass Measurements
Slaughter procedures and postmortem inspection of the carcass were carried out according to the Regulation of the Tunisian Ministry of Agriculture (Livestock Law No 2005-95). Cull cows were slaughtered according to the Muslim rite (Halal). Hot carcass weights were recorded before the chilling process at 2°C for 24 hours. Hot carcass weights averaged 220kg. Dressing percentage was calculated as (hot carcass weight/slaughter live weight)*100 (Alberti et al., 2008).
The data on the hot carcass weight, slaughter age, kidney fat weight, and the degree of fat thickness were recorded according to the method described by De Boer et al. (1974). Immediately after carcass split along the midline, measurements (cm) were recorded from the left-side of the carcass:
Length of the carcass (LC), measured from the anterior edge of symphysis pubis to the middle of the anterior edge of the visible part of the rib.
Length of hind leg (LL), measured from the medial malleolus of the tibia in a straight line to the anterior edge of the symphysis pubis.
Depth of carcass (DC), measured from the last sternebra to the dorsal tip of the spinous process of the sixth thoracic vertebra.
Depth of hind leg (DL), measured as the horizontal distance between the outermost points on the anterior and posterior surface of the leg.
Perimeter of leg (PL), the maximum measurement of the horizontal contour of the leg at the symphysis pubis level.
Length and perimeter measurements were taken by tape measure, whereas width and depth measurements were taken by using a caliper. From these measurements a carcass compactness index was calculated. This index expresses the relationship between hot carcass weight (kg) and carcass length (cm) as follows:
Carcass compactness index= Hot carcass weight*100/carcass length
Measurements for the fat cover thickness (FC, mm) were also recorded at the level of the sixth rib on the carcass using a caliper (Alberti et al., 2005).
Statistical Analyses
Statistical analyses were conducted using SAS software version 9.1 (SAS Inst., Inc., Cary, NC, USA). Pearson Correlations were also determined using the PROC CORR for all the variables measured on the carcass. Principal component analysis was performed using PROC PRINCOMP for all the variables measured on the carcasses to determine the number of independent variables to distinguish among different groups of carcasses. To avoid ghost effects on the principal component analysis due to different measurement scales, the variables for PC analysis were standardized (zij = (xij - averagej)/(standard deviation)j) to a mean of zero and variance of one, to give each variable equal weight in the statistical analysis. In this analysis, two principal components retained with eigenvectors are great er than or equal to 1. Cluster analysis on principal components using the “WARD” method was conducted using the function PROC CLUSTER to identify the different
Table 1: Means, standard deviation (SD) and coefficient of variation (CV) of the variables measured on the carcass (n=55)
| Variables | Mean | SD | CV (%) | Minimum | Maximum |
| Age (years) | 9.0 | 1.4 | 16.2 | 6.0 | 13.0 |
| Carcass weight (kg) | 217.3 | 47.3 | 21.8 | 138.5 | 364.0 |
| Length of carcass (cm) | 145.8 | 8.0 | 5.5 | 125.0 | 158.0 |
| Depth of carcass (cm) | 50.2 | 3.2 | 6.3 | 43.0 | 55.0 |
| Length of hind leg (cm) | 83.3 | 3.9 | 4.7 | 70.0 | 92.0 |
| Perimeter of leg (cm) | 87.1 | 6.1 | 7.1 | 75.0 | 99.0 |
| Depth of leg (cm) | 18.1 | 1.3 | 7.3 | 15.0 | 21.0 |
| Fat thickness (mm) | 1.6 | 0.7 | 46.5 | 1.0 | 4.5 |
| Weight of kidney fat (kg) | 1.1 | 0.6 | 58.5 | 0.3 | 2.9 |
| Dressing percentage (%) | 43.3 | 5.8 | 13.4 | 32.2 | 53.7 |
| Carcass compactness index (kg/cm) | 1.4 | 0.2 | 18.9 | 0.9 | 2.3 |
Table 2: Pearson correlation coefficients among culled cows’ carcass measurements
| AGE | LC | DC | LL | DL | PL | CW | FKW | FC | DP | |
| AGE | ||||||||||
| LC | -0.38** | |||||||||
| DC | -0.31 | 0.76*** | ||||||||
| LL | -0.35** | 0.30* | 0.47*** | |||||||
| DL | -0.12 | 0.24 | 0.07 | 0.22 | ||||||
| PL | -0.05 | 0.32* | 0.14 | 0.16 | 0.70*** | |||||
| CW | -0.38** | 0.58*** | 0.36** | 0.10 | 0.62*** | 0.51*** | ||||
| FKW | -0.33* | 0.40** | 0.27 | 0.12 | 0.49*** | 0.37** |
0.78*** |
|||
| FC | -0.23 | 0.36** | 0.19 | -0.01 | 0.40** | 0.29* | 0.61*** | 0.88*** | ||
| DP | -0.05 | 0.22 | -0.10 | -0.06 | 0.46*** | 0.35** | 0.72*** | 0.58*** | 0.49*** | |
| CCI | -0.35** | 0.39** | 0.19 | 0.21 | 0.64*** | 0.49*** | 0.97*** | 0.76*** | 0.58*** | 0.77*** |
* (P < 0.05); ** (P < 0.01); *** (P < 0.001).
CW, Carcass weight; LC, length of carcass; DC, depth of carcass; LL, length of hind leg; FC, carcass fat cover; FKW, fat kidney weight; CCI, carcass compactness index; PL, perimeter of the leg; DP, dressing percentage; DL, depth of the leg.
groups of carcasses. Analysis of the variance was conducted using the procedure PROC GLM to determine if differences among the three classes of carcasses were significant at P less than 0.05.
RESULTS
Descriptive Parameters and Correlation Analysis
Means, standard deviations and the coefficients of variation of the cows are shown in Table 1. The coefficient of variation of some variables, such as length of carcass (LC), length of leg (LL), depth of carcass (DC), is lower than 10%, while some others, like fat cover thickness (FC), weight of kidney fat (FKW), carcass weight (CW), is higher than 20%. Coefficients of correlation among carcass traits are given in Table 2. Correlations between carcass weight and the fat cover thickness (FC) and the kidney fat weight (FKW) were highly significant (P <0.001). However, age was negatively correlated with all these parameters. High correlations (P <0.001) were also found between the weight of kidney fat (CFW) and the fat cover thickness (FC) of the carcass (r =0.88). Depth of carcass (DC) was positively correlated with the carcass length (LC) (r = 0.76) and the carcass weight (CW) (r =0.58). In addition, high positive correlations (P <0.001) were found between carcass weight (CW), depth of the leg (LL) (r =0.62) and dressing percentage (DP) (r =0.72).
Principal Component Analysis (PCA)
Results of the PCA of the parameters of carcass quality are summarized in Table 3. Two main components in descending order were extracted in this analysis. The first component explained 54.98% of the variability, whereas component 2 explained 16.65%. These two components e xplained about 71.63% of the total variability in the data which summarized the carcass measurements.
Table 3: Principal component (CP) loading
| Variables | CP1 | CP2 |
| Age | -0.29 | -0.28 |
| CW | 0.95 | -0.02 |
| DL | 0.78 | -0.02 |
| PL | 0.70 | 0.04 |
| DP | 0.74 | -0.48 |
| FC | 0.58 | -0.15 |
| FKW | 0.73 | -0.10 |
| CCI | 0.92 | -0.15 |
| LC | 0.56 | 0.47 |
| LL | 0.30 | 0.82 |
| DC | 0.30 | 0.65 |
| Eigenvalue | 3.84 | 1.16 |
| Portion of variance (%) | 54.98 | 16.65 |
| Cumulative Variance (%) | 57.98 | 71.63 |
CW, Carcass weight; LC, length of carcass; DC, depth of carcass; LL, length of hind leg; FC, carcass fat cover; FKW, fat kidney weight; CCI, carcass compactness index; PL, perimeter of the leg; DP, dressing percentage; DL, depth of the leg.
Table 4: Means of carcass characteristics of the three cull cow’s classes
| Parameters | Cluster 1 | Cluster 2 | Cluster 3 | SEM | P-value |
| Observations (n) | 10 | 31 | 14 | - | - |
| Age (years) | 9.7 | 9.1 | 8.3 | 0.19 | .06 |
| Carcass weight (kg) |
155.6a |
209.6b |
278.2c |
6.39 | <0.01 |
| Length of carcass (cm) |
136.8a |
146.0b |
151.9c |
1.08 | <0.01 |
| Depth of carcass (cm) | 48.6 | 50.1 | 51.6 | 0.43 | .06 |
| Length of hind leg (cm) | 80.9 | 84.0 | 83.5 | 0.53 | .09 |
| Depth of leg (cm) |
16.6a |
18.1b |
19.1c |
0.17 | <0.01 |
| Perimeter of leg (cm) |
79.6a |
87.8b |
91.0c |
0.83 | <0.01 |
| Weight of kidney fat (kg) |
0.7a |
0.8a |
1.9b |
0.08 | <0.01 |
| Fat thickness (mm) |
1.1a |
1.4a |
2.6b |
0.10 | <0.01 |
| Dressing percentage (%) |
37.7a |
42.4b |
49.3c |
0.78 | <0.01 |
| Carcass compactness index (kg/cm) |
1.1a |
1.4b |
1.8c |
0.03 |
<0.01 |
a,b,c means in the same row with different superscripts are significantly different at P < 0.05.
SEM, standard error of means.
Results showed high correlations (P<0.001) between the first component, carcass weight (CW) (r = 0.95), depth of the hind leg (DL) (r = 0.78), perimeter of the hind leg (PL) (r = 0.70), carcass weight (CW) (r = 0.74), weight of kidney fat (FKW) (r = 0.73) and carcass compactness index (CCI) (r = 0.73). On the other hand, the age was negatively correlated with the first component (r = -0.29) (P <0.05). The second component had a high positive correlation with the length of the hind leg (LL) (r = 0.82) and that with the chest depth of the carcass (DC) (r =0.65). The second component was negatively correlated with all carcass measurements except for the perimeter of the leg (PL), length of the carcass (LC), length of the hind leg (LL) and chest depth (DC).
The coefficients of these variables are the correlations of values with these components. Component 1 presented a high positive correlation with the carcass weight, the compactness index, the depth of the leg, the weight of the kidney fat, and the perimeter of the carcass. Component 2 showed a negative correlation with the carcass weight, the depth of the leg, the dressing percentage, the fat thickness, the carcass compactness index and the weight of the kidney fat. In addition, the two components were negatively correlated with the age.
Principal component analysis allowed identifying two groups of variables. The first principal component was correlated with variables related to width and depth indicating the conformation of carcass, whereas the second principal component was correlated to length showing that frame size can be considered as an indicator of the axis of the carcass bone structure.
Cluster Analysis
The agglomeration of the 55 live animals yielded the dendrogram shows the formation of three clusters identified in this study (Figure 1). A possible practical decision might be to take the grouping at the level where differences within the same breed type appear. Cluster analysis based on the two previously identified components (Figure 2) revealed the identification of three classes of carcasses as follows:
Cluster 1: cull cows with a carcass weight between 130 and 180kg, perimeter of the hind leg between 70 and 80 cm and a carcass length between 125 and 140cm.
Cluster 2: cull cows with a carcass weight between 180 and 250kg, perimeter of the hind leg between 80 and 90 cm and a carcass length between 140 and 150cm.
Cluster 3: cull cows with a carcass weight between 250 and 370kg, perimeter of the hind leg between 90 and 100 cm and a carcass length between 150 and 160cm.
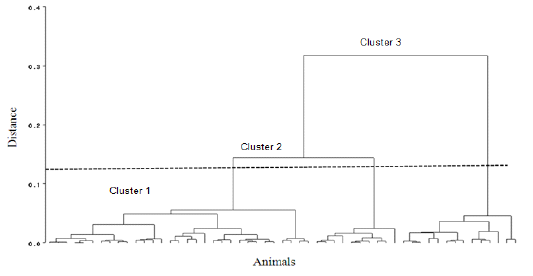
Figure 1: Dendrogram resulting from cluster analysis grouping lives cull cows in three classes according to the morphometric traits.
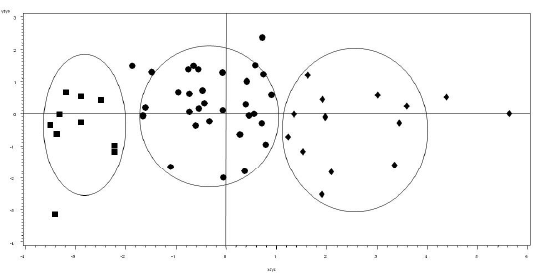
Figure 2: Projection of the carcass trait measures of the three animal groups identified by the cluster analysis based on the two principal components. Symbols: : cluster 1; : cluster 2; : cluster 3.
Table 4 shows the results of the different measurements performed on the three different classes of carcasses identified through the cluster analysis on the basis of the two principal components identified in this study. These results showed that carcass weight, width and perimeter of the hind leg increase as far as we change from cluster 1 to cluster 3. Furthermore, carcasses form cluster 3 compared to those classified in the two first clusters 1 and 2 showed the higher values in terms of carcass weight (278 kg vs 256 and 210 kg), perimeter of the hind leg (92 cm vs 80 and 88 cm), carcass length (152 cm vs 137 and 146 cm) and width of the hind leg (19 cm vs 17 and 18 cm). Significant differences (P <0.05) were also found among the three classes for the carcass length, weight, width, and the perimeter of the hind leg. We also found a relevant significant difference (P <0.05) for the compactness index between the three clusters showing the highest value for the cluster 3.
DISCUSSION
The main objective of the present study based on the carcass measurements collected at the slaughterhouse was to establish a carcass grading system for cull cows. In Tunisia, cull cows breed were mainly Holstein housed either in a large or landless scale dairy farms. In addition, identification animal coverage is considered as a major constraint in the country due to the lack of technicians and financial means. As a result to that issue, tracking animals during transportation and slaughter process is not possible under those conditions, and makes data collection from the slaughterhouse for the cull cows quite limited. Therefore, it can be assumed that the results in the present study give a good presentation of the different types of carcasses that could be found in the market. Overall, it is difficult to make direct comparisons between the results found in the present study and earlier research studies where individual factors were used as a source of variation such as slaughter age, breed, and finishing regime. In addition, a limitation of the present study is that we used a small number of cull cows because of traceability issue. However, the present results reflect a valid point of view of the classification system that could be implemented in practice by butchers and meat producers in the country. The results of the present study of carcass measurements were quite similar to those reported in previous studies (Fredeen et al., 1971; Laville et al., 1996; Alberti et al., 2005). These authors found that measurement for carcass length, leg length and leg perimeter were highly correlated with carcass weight. In agreement with our findings, these authors also reported similar coefficient of variation for carcass length, leg length and carcass depth. However, Correlations between carcass weight, leg length and round depth reported by Abraham et al. (1968) were higher than those found in this study. Bozkurt et al. (2008) performed carcass measurement to predict carcass weight of Holstein breed using digital image analysis. These authors reported high positive correlation between the weight and the length of the carcass (r=0.93). These disparities could be because the animals in their study were specialized breeds for meat production, and it has been shown that carcass measurements are influenced by animal breed and sex (Mukhoty and Berg, 1973; Alberti et al., 2008). O’Mara et al. (1998) studied cow carcass composition using live animal and carcass traits measurements reported similar coefficient of correlations between carcass dressing and total fat percentage after cutting than those found in the present study. Ripoll et al. (2016) reported positive correlation between carcass weight and fatness degree (r=0.57). Furthermore, correlations found by these authors between the carcass weight and the fat thickness were similar to those reported in the present study. On the contrary, lower correlation values between kidney fat and carcass weight had been observed in previous studies compared to those found in the present study (Berry et al., 1973; Wilson et al., 1964; Epley et al., 1970; Dernnan et al., 2008; Huerta-leidnez et al., 2018). These differences could be explained by the variability of carcass weights of cull cows used in our study, and it has been showed that the degree of fatness according to the SEUROP grid increased with carcass weight, and had a strong inverse correlation with carcass conformation (Minchin et al., 2010; Alberti et al., 2005).
The first principal component extracted in the present study explained more than 54% of the variability, whereas the second component explained 16.65%. Alberti et al. (2005) showed that the first component explained about 58%, while the second explained about 19.62% of the variance in the data. Furthermore, these results were quite higher to those found in our study especially for the correlation between the carcass weight, the width and the perimeter of the hind leg, and the first component. The principal component analysis performed by Alberti et al. (2005) for carcass measurements mainly for those related to the length of the carcass and length of the hind leg showed higher correlation coefficients with the second principal component. In another study, Alberti et al. (2008) performed a principal component analysis using data from 15 European beef breeds and reported that the first components explained about 48.8% of carcass variability and was related to compactness index, dressing percentage, and carcass weight. However, the second component explained 24.5% of variation and was related to fat percentage and kidney fat weight. These disparities with our results could be related to the low number of cull cows used in the present study.
Franco et al. (2009) reported that the dressing percentage and the fat thickness of the carcass increase simultaneously with the increase of the score of conformation of Holstein cull cows. On the other hand, Minchin et al. (2010) reported that conformation score and fatness degree increased with the carcass weight. These finding were similar to those recorded in our study showing that fat thickness and compactness index of the carcass increased with the cluster 1 and 3. Results reported by Shemeis et al. (1994) for the back fat thickness showed that this parameter increased with increasing carcass weight and, body score condition for the cull cows. These results reflect the trend in our study showing that the back fat thickness for the carcasses obtained from the cull cows classified in the cluster 3 was higher than those recorded for the cluster 1 and 2 simultaneously with the increase of the carcass weight. Vestergaard et al. (2007) showed also the same tendency for the back fat thickness. On the other hand, Sawyer et al. (2004) reported that carcass weight, conformation score, dressing percentage, and back fat thickness decrease with the advancing age of the cull cows. These findings are similar to those recorded in this study. Berry et al. (1973) showed an increase in carcass weight as far as the carcass length increased. This trend is similar to the one found in our study. However, the results reported by Berry et al. (1973) for measurements related to the fat thickness and kidney fat was not in concordance with those found in the present study.
CONCLUSION
This study revealed the importance of carcass measurements in the assessment and the value of carcass obtained from cull cows aged between 6 and 13 years. The use of the principal component analysis allowed the identification of two groups of components; the first one related to the conformation and the second one to the frame size. Cluster analysis permitted the distinction between the different groups of carcasses obtained after the slaughter of cull cows and then marketed in Tunisia. Results of the present study provide valuable information regarding the relationship of carcass weight and length to the fat thickness to establish a carcass grading system for cattle in Tunisia, which could serve as a basis for the negotiation and reflect real price differences for carcasses purchased by butchers and allow for more transparent transactions among meat sector operators.
Acknowledgements
This study was conducted in collaboration with “Société Viande du Cap-Bon” which we are gratefully acknowledged. We also wish to express our sincere gratitude to the Professor Michael Thonney in the Animal Science Department at Cornell University for his advice and being helpful in the redaction and revision of this article.
conflict of interest
All authors declare there is no conflcit of interest.
AUthors contribution
All authors contributed equally.
References


