Advances in Animal and Veterinary Sciences
Research Article

Morphological Characterisation of Indigenous Cattle Breeds in Eritrea
Solomon Goitom1,2, Mathew Gitau Gicheha2*, Kiplagat Ngeno3, Francis Kimani Njonge2
1Hamelmalo Agricultural College, Keren, Eritrea; 2Jomo Kenyatta University of Agriculture and Technology, Nairobi, Kenya; 3Egerton University, Njoro, Kenya.
Abstract | Cattle production plays important socio-economic roles at household and national levels in Eritrea. The grazed cattle sector dominates the agricultural production occurring mainly in pastoral and agro-pastoral systems. Indigenous cattle breeds are almost exclusively reared in the two production systems. The breeds have notable physical differences but no scientific research has been carried out to determine the extent of the morphological diversity. We hypothesized that there exist morphological differences that can distinguish the indigenous cattle population (ICPs) into distinct groups using the guidelines on morphological characterisation of different livestock species provided by Food and Agriculture Organisation (FAO). A total of 4617 data were collected for analysis. This included data from 13 morphometric and physical characteristics measurements from 243 head of indigenous cattle spread in 27 populations in the three agro ecological zones of Eritrea. The measurements were equally shared between production and reproduction traits. Homogenous groups were formed from cluster analysis based on single-linkage agglomerative hierarchical and non-overlapping (SAHN) technique while discriminant function analysis was performed to ascertain the accuracy of the classification. The Eritrean ICPs clustered around two groups. These were the Highland and East Coast cluster (Arado) and the Western lowland cluster (Barka). Individuals from cluster Arado had low mean linear measurements for the wither height (114.4±0.8), body length (111.75±2.1), and heart girth (134.65±0.9) than those in cluster Barka whose respective values were 125.3±0.6, 126.8±0.7, and 156.4±0.7. Analysis of the data obtained from this study indicated the existence of a wide variation in morphological characteristics within and between cattle populations reared in Eritrea. This information is useful in design of a breeding program that utilizes the available within and between breed variation in enhancing productivity and profitability of indigenous cattle populations in Eritrea.
Keywords | Eritrea, Barka, Arado, Classification, Morphometric
Received | May 24, 2019; Accepted | July 01, 2019; Published | September 25, 2019
*Correspondence | Mathew Gitau Gicheha, Jomo Kenyatta University of Agriculture and Technology, Nairobi, Kenya; Email: gicheham@jkuat.ac.ke
Citation | Goitom S, Gicheha MG, Ngeno K, Njonge FK (2019). Morphological characterisation of indigenous cattle breeds in eritrea. Adv. Anim. Vet. Sci. 7(10): 848-857.
DOI | http://dx.doi.org/10.17582/journal.aavs/2019/7.10.848.857
ISSN (Online) | 2307-8316; ISSN (Print) | 2309-3331
Copyright © 2019 Gicheha et al. This is an open access article distributed under the Creative Commons Attribution License, which permits unrestricted use, distribution, and reproduction in any medium, provided the original work is properly cited.
Introduction
Optimal utilisation of livestock biodiversity is crucial in ensuring sustainable food production, enhanced food security, higher household incomes and development of animal based agro-industry sector in Africa (Kugonza et al., 2011). Phenotypic characterisation is important in design and implementation of efficient breed use and conservation programmes (Pilling et al., 2010, Kugonza et al., 2011). The morphological differences within and between livestock populations are attributable to the genetic makeup of individuals and environmental conditions in which they exist (Rege and Tawah, 1999). This implies that performance of different breeds will vary in different environments (Pilling et al., 2010). The differences can be captured through morphological measurements (phenotypic characterisation) which are then related to suitability of the selected individuals to perform in the specified environment. Phenotypic characterisation is easy and cheap to implement and can be used for rapid selection of animals in the field (Dossa et al., 2007) making it suitable for resources constrained developing countries. It is however important to support the morphological classifications by molecular characterization techniques (Gizaw et al., 2011) as it is highly influenced by environmental effects as well as the strong genetic and environmental interactions.
In Eritrea, cattle production plays important socio-economic roles both at household and national levels (Goitom et al., 2016) with the grazed cattle sector dominating the livestock production industry. Much of the country’s landmass is classified as arid or semi-arid (ASAL) and is therefore more suited to grazed animal production. Even in areas where crop production is practiced, mixed livestock-crop production system is common as animals are reared to utilise the crop residues to supplement grazing. According to the Government of the State of Eritrea National Livestock development Project Report (NLDP, 2007), most of the country’s animal production occur in the smallholder production systems which are mostly dominated by pastoral and agro-pastoral systems. The main livestock breeds kept are indigenous to the country and are therefore well adapted to the nutritional and environmental constraints experienced in the country’s ASALs conditions. The indigenous cattle reared are characterised by low productivity forcing the government and other livestock sector stakeholders to invest in programmes to improve the performance (NLDP, 2007).
Designing effective genetic improvement programme requires adequate knowledge of the available genetic resources. Genetic diversity is the most important resource in livestock plans. Besides, communities have different sets of cultural and social values by which to judge, appraise and decide on breeding animal based on physical appearance (Solkner et al., 1998). The genetic diversity information of the ICPs in Eritrea is lacking making genetic improvement of animal populations a daunting task. This is despite the fact that cattle production is a very important component of the Eritrean economic growth and one which has the potential to increase food security in the country and the region in general.
In the sub-Saharan Africa about 180 breeds of cattle have been recognized; among which 150 are indigenous to the continent (Rege and Tawah, 1999; Rege et al., 2003). In a review of the African cattle breeds, Rege and Tawah (1999) grouped Eritrean cattle population into North Sudan Zebu comprising mainly of the Barka breed and Small East Africa Zebu comprising of the Arado breed. The Barka inhabit the Western lowland of Eritrea, with a small population being found in the neighbouring country of Ethiopia. The breed is primarily kept for milk and meat production. The breed has potential to be improved for use in the ASAL areas of Africa. The Arado breed which is smaller in body size as compared to Barka is suited in mountainous regions and has been traditionally used in provision draught power (Genzebu et al., 2016) which is important in crop lands. Margaret (2002) indicated that Arado cattle is an intermediate between Zebu and Sanga breeds and noted the importance of the breed as a source of meat and milk.
In light of the climatic change being experienced and the anticipated changes in animal farm systems in response to the subsequent increase in climatic variability, there is need for Africa to determine the performance of the breeds that exist in the continent with a view of conserving those that can withstand higher ambient temperatures as well as fluctuating pastures supply and quality. The Barka and Arado breeds are good candidates for use in mitigating the effects of climate change as they have undergone natural selection to produce and reproduce in the arid and semi-arid areas of Eritrea and parts of Ethiopia characterised by high ambient temperatures and low quality grazed pastures. In order to sustainably utilise and conserve these breeds, there is need to determine their phenotypic and genetic diversity. Phenotypic categorisation is the first step in characterization of genetic resources (Delgado et al., 2001) for use in design of sustainable improvement programmes. The objective of this study was to phenotypically characterise indigenous cattle resources in Eritrea.
Materials and methods
Study Area
The study was conducted in Eritrea which lies between latitudes 120 42’ N to 180 2’ N and longitudes 360 30’ E to 430 20’ E. The country’s total land area is 124,300 sq. km much of which is arid and semi-arid. Data was obtained from all the regions representing all the main agro ecological zones namely Western lowland, the Highlands and Eastern Coast region. A total of 243 head of cattle were sampled for qualitative and quantitative phenotypic characters data necessary for identification and description of distinct populations, breeds or eco-types. The three ecological zones account for the six administrative units (Zoba) namely Anseba, Debub, Gash-Barka, Maekel, Northern Red Sea and Southern Red Sea that make up Eritrea. Each Zoba contributed differently to the total samples collected depending on the size of the cattle population and agro ecological conditions. The lowest number of samples were collected from Southern Red Sea zone which had the least cattle population due to its desert climate conditions. Samples were collected from a total of 27 sites spread out in the six Zoba and which were Golul, Awgaro, Tekreret, Tekombia, Cambo-10, Keru, Barentu, Akordat, Shambuko, Serejeka, Zighb, Mai-alba, Bada, Sheha, Enghel-Eila, Menkanile, Emberemi, Shieb-Seleba, Afelba, Rekumbedin, Habero, Hamelmalo, Shieb-Mensheb, Shieb-Gedged, Foro, Cheguaro and Dongolo.
Table 1: Description of morphological characterisation traits recommended by FAO (1986)
| Measurement | Description | Abbreviation |
| Morphometric | ||
| Body length | the distance between point of shoulder to the pin bone | BL |
| Heart girth | circumference of the body behind the base of the hump | HG |
| Height at withers | the vertical distance from ground to the point of wither | HW |
| Horn length | base of the horn to tip of the horn | HL |
| Ear length | base of the ear to the pointed end | EL |
| Dewlap width | the widest part of dewlap | DW |
| Tail length | from the base of the tail to the pointed end of the tail | TL |
| Physical | ||
| Horn type | Horned, polled, loose | HT |
| Horn orientation | Lateral, curved upward, curved to front | HO |
| Head profile | Straight/flat, concave, markedly convex | HP |
| Ear formation | Erect, semi-pendulous | EF |
| Hair characteristic | Short and coarse, short and smooth | HC |
| Colour | ||
| Colour type | White, brown, red, black, mixed | CT |
The traits considered in the characterisation were adopted from FAO (1986) report which has proposed a comprehensive list of animal descriptors relevant in morphological description of a breed. Besides the survey data, images of adult males and female animals in their natural habitat is required for purposes of identification and differentiation of local animal categories.
Data Collection
A pilot survey was carried out prior to the actual characterisation. This was to establish the distribution of cattle populations and composition in the study area as well to test the suitability of the questionnaire and other data collection tools to obtain all the information and samples necessary for the study. The data collection tools were adjusted following the pilot study for use in the main characterisation. Morphological characterisation in this study adopted the 13 body characteristics proposed by FAO (1986) with 7 morphometric measures, 5 physical traits and 1 colour type characteristic as summarised in Table 1.
Besides the data presented in Table 1, corresponding images of the sampled cattle in their habitat were also taken. Female animals in late pregnancy were excluded from sampling for morphometric measurements. A total of 4617 data were collected for analysis.
Data Analysis
Descriptive statistics were carried out to describe different cattle populations. Frequencies of each level of the qualitative data of the studied characteristics were computed using SPSS statistical software (SPSS, 2006). Chi-square analysis and student’s t-test were used to determine the effect of the agro ecological zone on morphological and physical traits among the studied populations. The mixed model of analysis of variance was used to analyse quantitative data taking agro ecological zones as fixed effect and animal populations as random effect.
Analysis of variance was used to assess the statistically significant differences between cattle populations and the corresponding agro ecological zones. The statistical model that was used for the quantitative measurements was:
where γijk is an observation of a quantitative measurements on ith agro ecology and jth cattle population; µ is the overall mean; αi is ith fixed effect of agro ecological zone (ith = one of the ecological zones); βij is random effect of jth cattle population nested in agro ecological zone (jth = is one of nine populations); (α ×β)ij is the interaction between the effect of agro ecological zones and cattle populations and εijk is the random residual effect.
Principal Component Analysis
The data was first entered into Microsoft Excel for filtering and detection of inconsistencies before the analysis. The data was then exported to SPSS database system for the design of the structure of the variables for analysis. Principal Component Analysis (PCA) was carried out to visualize grouping and variation of the components. The first two principal components (vectors) were selected based on the rule of the highest proportion of variance (eigen value). This was important so as to detect the high variation by avoiding redundancy of characteristics. Rotation of principal components was done using VARIMAX to obtain high correlation within a single component besides increasing difference between new principal components (Manly, 1994).
The classification was based on the 27 cattle populations studied and was aimed at forming distinct homogenous cattle populations. Cluster analysis was applied based on the model of nearest neighbour clustering using hierarchical single linkage algorithm technique (Sneath and Sokal, 1973). Distance between two clusters was calculated based on the average distance among members within a single cluster to average distance of other cluster. Homogenous groups of cattle populations were formed based on their morphological characteristics resemblance. Grouping of similar animal populations were expressed by graphical hierarchical classification tree (dendrogram) and heuristics decisions were extracted to determine the number of clusters.
Discriminant Analysis
Discriminant function analysis was carried out to certify whether the classification of cattle populations into clusters was correct. Furthermore, the analysis was used to determine which variable had more discriminating power in classification of cattle populations. The percentage of correct allocation for each cattle group was calculated to determine how well populations were separated using the available variables. Stepwise discriminant function analysis was used to determine characteristics with the largest canonical coefficients implying a higher contribution of the discrimination between populations. The Mahalanobis square distance obtained through discriminant analysis was used to measure variability among cattle populations found in different agro ecological zones. The Pearson correlation analysis was done between all morphometric and physical characteristics followed with a statistical significance test on the traits to determine the actual differences among the correlation values.
Results
Morphometric Measurements
The morphometric measurements of cattle populations in different agro ecological zones in Eritrea are shown in Table 2. The Western lowland cattle (Barka) population recorded higher morphometric measurements, (BL; 126.8±0.7), (HG; 156.4±0.7), (HW; 125.3±0.6) and (DW; 18.7±0.6) than the Highland (Arado), (BL; 112.2±2.1), (HG; 131.7±1.0), (HW; 110.7±0.8) and (DW; 11.4±1.1) and the East Coast (Arado), (BL; 111.3±2.2), (HG; 137.6±0.8), (HW; 108.1±0.8) and (DW; 14.3±0.4) regions.
Table 2: Morphometric measurements of cattle populations in different agro ecological zones
| Population | BL | HG | HW | DW |
| Highland (Arado) |
112.2
±2.1 |
131.7 ±1.0 |
110.7 ±0.8 |
11.4 ±1.1 |
| Western lowland (Barka) |
126.8 ±0.7 |
156.4 ±0.7 |
125.3 ±0.6 |
18.7 ±0.6 |
| East Coast (Arado) |
111.3 ±2.2 |
137.6 ±0.8 |
108.1 ±0.8 |
14.3 ±0.4 |
| Mean |
116.77 ±1.7 |
141.90 ±0.8 |
114.70 ±0.9 |
14.80 ±0.7 |
| P-value | P<0.001 |
Table 3: Frequency and proportion of coat colour and head profile of populations in different agro ecological zones
| Highland and East Coast | Western lowland | |||
| Arado | Barka | |||
| Frequency | % | Frequency | % | |
| Coat colour | ||||
| White | 7 | 8.7 | 1 | 1.2 |
| Brown | - | - | 5 | 6.2 |
| Red | 44 | 54.3 | 2 | 2.5 |
| Black | 10 | 12.3 | 28 | 34.6 |
| Grey | 7 | 8.7 | 13 | 16.0 |
| Mixed (black & white) | 13 | 16.0 | 32 | 39.5 |
| Head profile | ||||
| Straight/flat | 73 | 90.1 | 53 | 65.4 |
| Concave | 8 | 9.9 | 27 | 33.3 |
| Markedly convex | - | - | 1 | 1.3 |
| Horn type | ||||
| Horned | 75 | 92.6 | 63 | 77.8 |
| Polled | 2 | 2.5 | 5 | 6.2 |
| Loose | 4 | 4.9 | 13 | 16 |
| Horn orientation | ||||
| Lateral | 5 | 6.2 | - | - |
| Curved upward | 60 | 74.1 | 68 | 84 |
| Curved to front | 16 | 19.7 | 13 | 16 |
| p-value | P<0.01 | P<0.01 | ||
Physical Characteristics
Results for the coat colour, head profile, horn type and horn orientation are presented in Table 3. Red coat dominated the cattle populations found in the Highland and East Coast regions at 54.3% while white and grey coat coloured cattle types were least at 8.7%. The Barka breed was dominated by mixed coloured cattle at 39.5% followed closely by individuals coloured black at 34.6%. White coloured individuals were least at 1.2%. Approximately 6.2% of the
Table 4: Frequency and proportion of ear formation, ear length, hair type and tail length of different cattle populations in different agro ecological zones.
| Highland and East Coast | Western lowland | |||
| Arado | Barka | |||
| Frequency | % | Frequency | % | |
| Ear formation | ||||
| Erect | 77 | 95.1 | 59 | 72.8 |
| Semi-pendulous | 4 | 4.9 | 22 | 27.2 |
| Ear length | ||||
| Long | - | - | 38 | 46.9 |
| Medium | 78 | 96.3 | 43 | 53.1 |
| Short | 3 | 3.7 | - | - |
| Hair characteristic | ||||
| Short and course | 9 | 11.1 | 8 | 9.9 |
| Short and smooth | 72 | 88.9 | 73 | 90.1 |
| Tail length | ||||
| Long | 68 | 84.0 | 60 | 74.1 |
| Medium | 13 | 16.0 | 20 | 24.7 |
| p-value | P<0.01 | P<0.01 | ||
Table 5: Pearson’s correlation coefficients of the physical and morphometric characteristics of Arado and Barka breeds1
| Arado | ||||||||||
| BL | HG | HW | CT | HP | DW | TL | HT | EL | ||
| BL | .148 | .140 | .050 | -.046 |
.279** |
-.137 | -.005 | .108 | ||
| HG | .173 | .164 | -.104 | .094 |
.312** |
-.013 | .130 | -.103 | ||
| HW |
.371** |
.276* |
-.078 | -.079 | .007 | -.042 | .064 | .114 | ||
| Barka | CT | -.014 |
-.276* |
-.026 | .124 |
-.229** |
-.099 | .025 | -.078 | |
|
|
HP | .086 | -.128 | .036 | -.131 | -.085 | .027 | .009 | -.062 | |
| DW | .043 | .067 | -.138 | -.219 |
-.013 |
.211** |
-.056 | -.042 | ||
| TL | .060 | -.080 | .105 | .033 | .024 | .024 | -.135 | -.111 | ||
|
|
HT | -.038 | -.023 | -.043 | .011 | .102 | -.037 | .044 | .079 | |
| EL | .135 | -.049 | -.084 | -.062 | -.119 | -.059 | -.013 |
.136 |
||
*Correlation is significant at the 0.05 level (2-tailed) ** Correlation is significant at the 0.01 level (2-tailed)
1See Table 1 for the description of the physical and morphometric characteristics of the Arado and Barka breeds
Western lowland cattle had brown coat colour while there was none in the Highland and East Coast cattle populations. Besides, only 2.5% of the Western lowland cattle had red coat compared to 54.3% in the Highland and East Coast regions. A 90.1% of the Arado cattle had a straight/flat head profile. There was no single individual with a markedly convex head/face profile among the cattle populations in the Highland and East Coast regions and only 1.2% in the Western lowland. Straight/flat head accounted for 65.4% of the sampled cattle in the Western lowland with the concave shaped individuals representing a 33.3%.
Approximately 92.6% of the Highland and East Coast cattle populations were horned while only 2% were polled. The respective for the Western lowland cattle was 77.8% and 6.2%. Most cattle had upward curved horns at 74.1% for the Highland and East Coast regions and 84% for the Western lowland cattle.
Table 4 presents frequency and proportion of ear formation, ear length, hair type and tail length of different cattle populations in different agro ecological zones. A total of 95.1% of the Arado cattle types had erect ears while it was 59% for the Barka cattle type. No individual was sampled with long ears type amongst the Highland and East Coast cattle populations.
The most common hair type was short and smooth at 88.9% for the Highland and East Coast region cattle populations while it was 90.1% in the Western lowland cattle populations. Similarly, most sampled cattle had long tail at 84% for the Highland and East Coast and 74.1% for the Western lowland cattle types.
Table 5 presents the Pearson’s correlation coefficients of the physical and morphometric characteristics of Arado and Barka breeds. Significant positive correlations were found among HW, HG and BL for the Barka breed but not for Arado breed.
Classification of Indigenous Cattle Types
Table 6 shows the latent vectors and proportion of variation of the first two principal components obtained using the Multivariate Technique (PCA and cluster analysis) based on different characteristics in the cattle classification. The first two principal components accounted for 87.7% of the total variance. The first principal component focused on the contrast between high negative value of morphological measurements (BL and HG) with the low negative values of physical characteristics (CT, HP, HO, HT and HC). The second principal component indicated the contrast between the high positive value of HG (0.63) and the low negative value of BL (-0.77).
Table 6: Latent Vectors and proportion of variation of the first two principal components
| PC1 | PC2 | |
| Proportion of variation | 74.48 | 3.20 |
|
Characteristics1 |
||
| BL | -0.515 | -0.767 |
| HG | -0.704 | 0.633 |
| CT | -0.032 | -0.008 |
| DW | -0.175 | -0.097 |
| EF | -0.013 | -0.005 |
| EL | -0.016 | -0.005 |
| HC | 0.001 | 0.004 |
| HP | -0.007 | -0.002 |
| HW | -0.454 | -0.102 |
| HO | -0.026 | 0.006 |
| HT | -0.005 | 0.001 |
| TL | -0.034 | 0.011 |
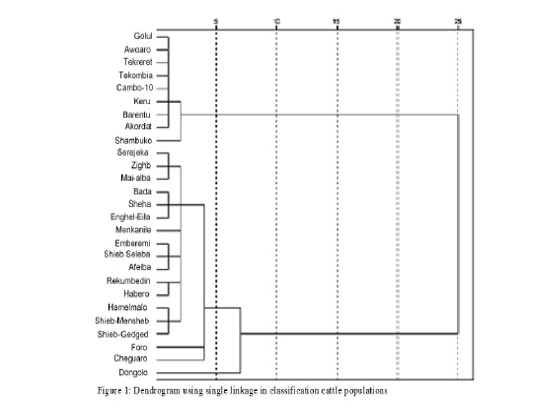
Figure 1 shows the dendrogram obtained using single linkage in the classification cattle populations. Two clusters emerged for cattle populations in the Western lowland and those in the Highland and East Coast regions.
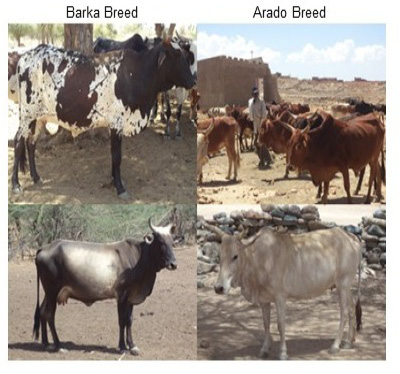
The first cluster had cattle populations from Golul, Awgaro, Tekreret, Tekombia, Cambo-10, Keru, Barentu, Akordat and Shambuko areas while the second cluster had populations from Serejeka, Zighb, Mai-alba, Bada, Sheha, Enghel-Eila, Menkanile, Emberemi, Shieb-Seleba, Afelba, Rekumbedin, Habero, Hamelmalo, Shieb-Mensheb, Shieb Gedged, Foro, Cheguaro and Dongolo. The Shambuko sub-population formed as sub-cluster within the first cluster while Dongolo formed a sub cluster in the second cluster. Figure 2 shows the photo of the two major clusters (breeds).
Classification of cattle populations based on specific agro ecological zones was carried out in order to evaluate diversity within the animals in similar ecological condition. The Highland cattle populations formed two clusters with the first comprising of cattle populations from Serejeka, Sheib-Seleba, Hamelmalo, Sheha, Habero, Mai-alba, Zighb and Afelba while Cheguaro population formed a second sub cluster. Cattle in East lowland had two sub clusters with populations in Bada, Enghel-Eila, Menkanile, Rekumbedin, Shieb-Mensheb, Shieb-Gedged and Dongolo belonging to sub cluster one while Foro and Emberemi populations were in the second sub cluster. All the cattle populations in Western lowland (Golul, Awgaro, Tekreret, Tekombia, Cambo-10, Barentu, Akordat and Shambuko) clustered together.
Results from the canonical discriminant analysis are presented in Table 7. The analysis resulted in significant (P<0.001) first and second canonical discriminant functions. The first function accounted for 95.7% of the total variance. Further results from stepwise discriminant analysis which were used to check the discriminating powers of the variables within a function showed that out of the 7 variables considered, only three had significant (P< 0.001) discriminating power. The HW, CT and TL had the best discriminating power in the first canonical function. The TL and DW had good discrimination power when used in the classification populations in the second function.
Table 7: Standardized canonical discriminant function coefficients
|
Characteristics1 |
First function | Second function |
| HG | 0.347 | 0.217 |
| HW | 0.511* | -0.545 |
| CT | 0.418* | -0.082 |
| HP | 0.228 | -0.172 |
| DW | 0.271 | 0.563* |
| TL | 0.464* | 0.437* |
| EL | 0.416 | -0.360 |
1See Table 1 for the description of the characteristics
*Characteristics with discriminating power
Table 8 presents the results for the Mahalanobis distance between Western lowland cattle populations in one group and the Highland and East Coast cattle types in the second group.
Table 8: Mahalanobis distance between western lowland and highland and East coasts of cattle populations
|
Groups ( Functions) |
Wilks' Lambda | % of variance | P-value |
| Western lowland | 0.101 | 95.7 | P<0.0001 |
| Highland and East Coast | 0.769 | 4.3 | P<0.0001 |
The squared distances between standardized classes means allows pairwise comparisons of morphological characteristics between the different populations. The squared mahalanobis distances between highland and East lowland cattle populations was the longest distance at 5.1 as presented in Table 9.
Table 9: The squared mahalanobis distances between highland and East lowland cattle populations
| AEZ | HL | WL | EL |
| Highland | ** | ||
| Western lowland | 1.93 | ** | |
| East Coast | 5.10 | 4.72 | ** |
Result of classification of cattle populations found in different agro ecological zones based on the first two canonical discriminant functions are presented in Figure 3. The first canonical discriminant function separated the cattle populations into two cattle breeds.
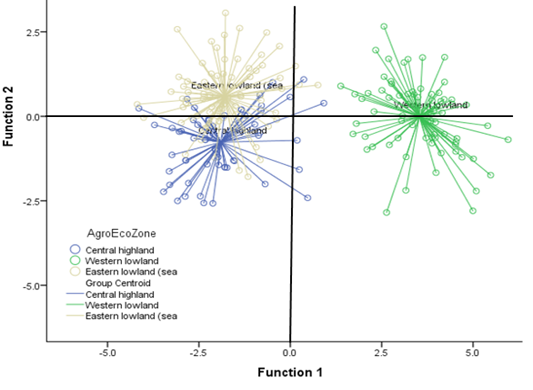
Figure 3: Result of classification of cattle populations found in different agro ecological zones based on the first two canonical discriminant functions
Table 10 presents results of discriminant analysis based on the number of observations and percentages of correct classification in brackets in respective agro ecological zones. Analysis of correctness of the breeds/agro ecological zones allocation were 100% for the Western lowland, 77% for the Highland and 77.8% for the East Coast regions. Generally, 84.9% of the original grouping of the populations according to different agro-ecology zones were correctly allocated.
Table 10: Classification results of discriminant analysis by the number of observations and percent correctly classified (bracket) in different agro ecological zones
| Agro ecological zone | Highland | Western lowland |
East lowland |
| Highland | 47 (77.0) | 1(1.6) | 13 (21.3) |
| Western lowland | 0 (0.0) | 74(100.0) | 0 (0.0) |
| East Coast | 18 (22.2) | 0 (0.0) | 63 (77.8) |
Discussions
Results from this study indicate that there exist differences in the physical and morphometric measurements between and within the indigenous cattle breeds reared in Eritrea. Yakubu et al. (2009) and Mwacharo et al. (2006) noted that the differences in morphometric measurements are usable in categorising between and within breed variation. The differences were used to morphologically characterise the cattle breed in Eritrea where two major cattle types were identified by clustering. The two groupings represent the Barka and Arado breeds shown in Figure 2. The Barka mainly includes cattle types from the Western lowlands while the Arado is majorly composed of cattle breed types found in the Highland and East Coast regions.
The Barka breed had higher values for heart girth (156.4±0.7) and height at the withers (125.3±0.6) which correspond to its larger than Arado breed stature. The HG and HW have been used to determine the liveweight of cattle in Senegal (Tebug et al., 2016). The HG has been identified as the most reliable body measurement parameter to predict body weight (Lesosky et al., 2012; Lukuyu et al., 2016). In areas where feed resource is not a constraint in Eritrea it would be advisable for producers to keep Barka breed to increase the meat productivity per unit area of grazing land. Furthermore, the breed can be crossed with the smaller Arado breed to take advantage of the higher liveweight. The lower values of the HG (131.7±1.0; Highland Arado and 137.6±0.8; Eastern Coast Arado) and HW (110.7±0.8; Highland Arado and 108.1±0.8; Eastern Coast Arado) in Arado breeds can be explained by the low quantity/quality feeds and high ambient temperatures found in the areas where the breed is found. The range of the HW values in the Arado breeds in this study are comparable to those obtained for Nandi and Mongalla indigenous cattle breeds (Arado) (Abdulmojeed, 2010; 111.84) and white Fulani (Barka) (Kanai et al., 2013; 151) in Nigeria, Arado breed in Ethiopia (Dessalegn 2012; 138.0) and Baggara (Barka) breed in Sudan (Alsiddig et al., 2010; 132.35). The production conditions from which these results were obtained are similar implying that the environment has played an important part in dictating the morphology of the breeds.
Most of the cattle populations in Eritrea had short and smooth hair type. The hair type was expected as an adaptation to high temperatures as much of the country is characterised by high ambient temperatures. Dry areas are also characterised by high number of biting insects which corresponds to the medium to long tail length observed in most of the cattle populations studied. The long tails are an adaptation the high external insect infestation as its used by the animals to brush off the insects (Desta et al., 2011).
Coat colour has been used to identify cattle types by farmers and has been associated with predation and thermal regulation selection pressure (Finch et al., 1984) with dark coated animals absorbing more heat from solar radiation than light coated contemporaries (Seo et al., 2007; Desta et al., 2011). Results obtained from this study indicated that the Arado breed was mainly reddish compared to the black and white observed in Barka. This matches the characteristic ambient temperatures in the environments which each of the breeds dominate.
Analysis of the morphological characteristics data obtained in this study indicate that there are two major groups (Barka and Arado) accounting for the cattle populations in Eritrea. The morphological characterisation uses taxonomic units (Sneath and Sokal, 1973) in which the aggregation is based on the similarity relationships. However, there were sub populations within the main groups as evidenced by the cattle populations found in Shambuko area. This is possibly due to speciation from a common ancestor with the other Barka breed populations. Besides, Shambuko area has higher rainfall implying the cattle populations have access to better quality and sufficient feed resource. The Dongolo cattle populations from the Arado breed also formed a sub population probably due to similar reasons since the area they are mainly kept is characterised by two rainy seasons resulting to higher supply of forage compared to the other areas in the Highland and East Coast regions where the breed is found.
Results from the PCA indicated that the first two principal components accounted for about 87.7% of the variation indicating that there was no relationship between morphometric measures and physical attributes such as the coat colour. However, the contrasting effect of HG at 0.63 and BL at -0.77 in the second principal component showed that a high value for HG did not necessarily imply a high value for BL.
Findings from the discriminant analysis confirmed that there were no animals from the Barka breed that were clustered together with the Arado breed. It also resulted in perfect (100%; see Table 10) allocation of the Barka breed to Western lowland which implies that the breed is clearly distinguishable based on its morphological characteristics. Moreover, the Arado breed found in the Highland and the East Coast regions had similar correct allocations at 70% and 74% respectively indicating that they have common morphological features.
Conclusions
There exists between and within breeds variation amongst cattle populations reared in Eritrea. Morphological and physical characteristics cluster all the cattle populations in two groups mainly the long bodied Western lowland Barka breed and the smaller statured Arado breed found in the Highland and East Coast regions. Based on the finding from this research, a cattle genetic improvement programme based on within and/or between breed types would be feasible for the indigenous cattle populations in Eritrea. This would be important in that the genetic diversity of Eritrea indigenous cattle would be maintained. The larger bodied Barka cattle could be used as the sire breed to improve meat production. The results in this study further indicate that there has been little loss of genetic diversity in Eritrean indigenous cattle populations. There is need to back up the findings of this study with a molecular characterisation of the cattle breeds of Eritrea.
COnflict of interest
No potential conflict of interest was reported by the authors.
Authors contribution
All the authors contributed equally to the writing of the manuscript.
Acknowledgements
The authors would like to recognize Japan International Cooperation Agency (JICA) for provision of project funds, National Commission for Higher Education Board (NCHE) of Eritrea for study scholarship to the first author, Jomo Kenyatta University of Agriculture and Technology (JKUAT) of Kenya for provision of research facilities and Hamelmalo Agricultural College (HAC) of Eritrea for granting the first author study leave.
References


