Advances in Animal and Veterinary Sciences

Effect of arsenic and spirulina platensis on the body weight among different experimental groups. The values are expressed as the means ± SD, where n=5. Superscript a refers to a significance from control group, Superscript b refers to a significance from As group in the same column.
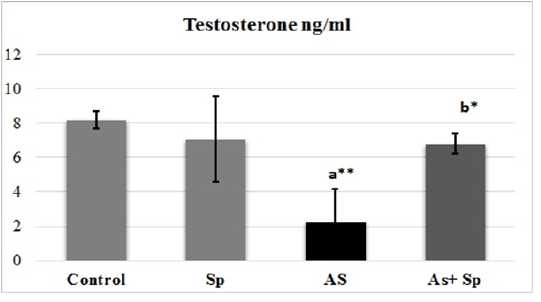
Mean values of Testosterone ± SD among different experimental groups.
Superscript a refers to a significance from control group, Superscript b refers to a significance from As groups.
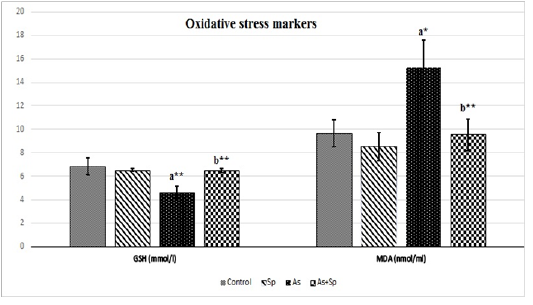
Effect of arsenic and spirulina platensis on serum GSH and MDA ± SD among different experimental groups (n=5) during the study. Superscript a refers to a significance from control group, Superscript b refers to a significance from As groups.
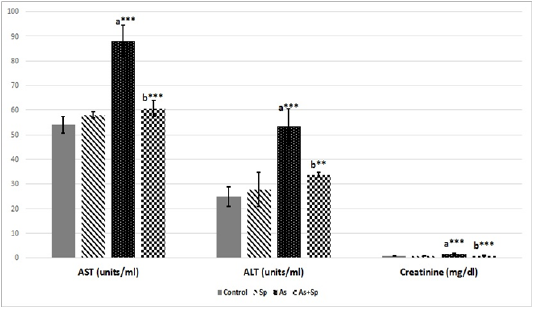
Effect of arsenic and spirulina platensis on serum ALT, AST and creatinine ± SD among different experimental groups (n=5) during the study. Superscript a refers to a significance from control group, Superscript b refers to a significance from As group.

Testis of rat from a) control, untreated group showing the normal histological structure of seminiferous tubules with normal spermatogonial cells and complete spermatogenesis with sperm production, b) As-treated group showing marked degeneration and necrosis of spermatogonial cells lining seminiferous tubules, the affected seminiferous tubules became void of cellularity with reduced diameter of seminiferous tubules (short arrow) and interstitial edema (long arrow), c) As-treated group showingmarked necrosis, exfoliation and absence of germ cells (short arrow) with formation of spermatid giant cells in the lumen of some seminiferous tubules (long arrow), d)Sp+As co- treated group showing an evidence of maintaining the normal seminiferous tubules with no histopathological alterations and complete spermatogenesis.(H & E scale bar 50 um).
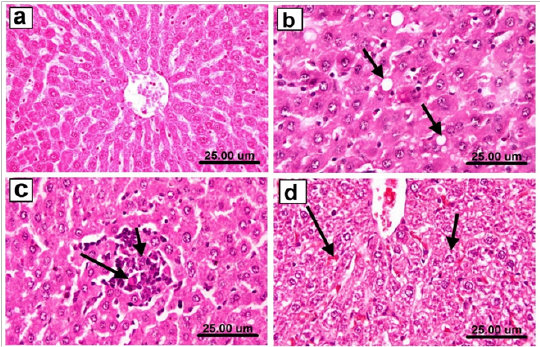
Liver of rat from a) control group showing the normal histological structure of hepatic lobules, b) arsenic treated group showing Kupffer cell activation and marked cytoplasmic vacuolization of hepatocytes (arrows), c) arsenic treated group showing focal necrosis of hepatocytes associated with mononuclear cell infiltration as well as apoptosis of hepatocytes, d) Sp+As co- treated group showing slight hydropic degeneration of hepatocytes (short arrow) and slight congestion of hepatic sinusoids (long arrow) (H & E scale bar 25 um).
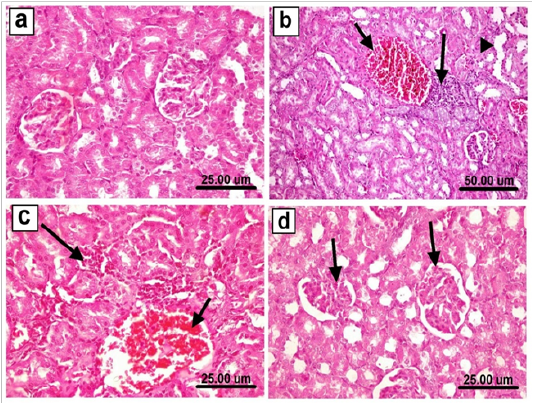
Kidneys of rat from a) control group showing the normal histological structure of renal parenchyma, b) arsenic treated group showing congestion of renal blood vessels (short arrow), focal necrosis of epithelial lining renal tubules associated with mononuclear cells infiltration (long arrow) as well as cystic dilatation of some renal tubules (arrow head), c) arsenic treated group showing congestion of renal blood vessel (short arrow) and interstitial peritubular mononuclear inflammatory cells infiltration (long arrow), d) As+Sp co-administered group showing slight congestion of glomerular tufts (arrows). (H & E scale bar 25 um (a, c & d) and 50 um (b)).
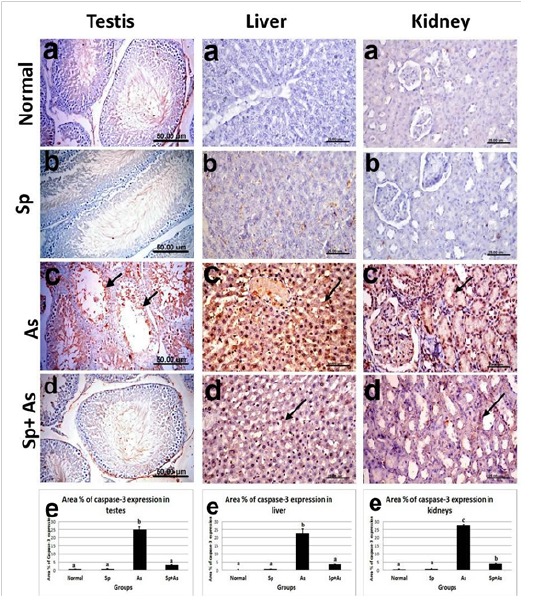
Immunostaining of caspase-3 in testes, liver and kidney of, a) control rat showing no caspase-3 immune-reactive cells, b) Sp- treated rat showing no caspase-3 immune-reactive cells. c) arsenic-treated rat showing strong positive immune expression. d) Sp + As co-treated group showing weak positive caspase-3 expression. e )immunostaining area % of caspase-3 expression. Data shown as mean±SE; error bars showing the variations of determinations in terms of standard error. One−way analysis of variance was used for data analysis (n=5), mean values with unlike superscript letters were significantly different (p ≤ 0.05).


