Advances in Animal and Veterinary Sciences
Research Article

The Effect of Aflatoxin B1 Contamination on the Antioxidant Status of Broilers’ Liver and Breast Muscle
Abdou Khaled1, Walaa A. Moselhy1, Marwa A. Ibrahim2*, Mahmoud A. R.3, Rowaida R. Abd El-Wahab4
1Department of Forensic Medicine and Toxicology, Faculty of Veterinary Medicine, Beni-Suef University, Egypt; 2Department of Biochemistry and Chemistry of Nutrition, Faculty of Veterinary Medicine, Cairo University, Egypt; 3Department of Toxicology and Biochemistry, Animal Health Research Institute, Dokki, Egypt; 4Department of Toxicology and Biochemistry Beni Suef provincial Lab, Animal Health Research Institute, Dokki, Egypt.
Abstract | Aflatoxin (AFB1) hampers the animal husbandry and causes a health hazard to human through the transfer of toxins through contaminated animal products leading to hepatocellular carcinoma. The aim of this study was to assess the presence of AFB1 in feed, liver and breast muscles among five broiler farms in Egypt by immune affinity fluorometric method.The effects of aflatoxin on antioxidant components (Lipid peroxidation (LPO), glutathione (GSH) and superoxide (SOD)) were determined. Moreover, the expression levels of the SOD And GPx genes were determined. A total of 300 samples (100 feed stuff, 100 liver 100 and breast muscles samples) were collected from different farms at age of marketing. The results revealed that the aflatoxin B1 level in the feed stuff, liver and muscle samples were higher than the permissible limit of European Commission with increased significant difference in feed samples comparing with permissible limit. Also the mean values of liver samples were higher than those detected in muscle. On the other hand, the concentrations of LPO and SOD were increased in chicken livers at farms with high AFB1 concentration, whereas GSH levels decreased. Both SOD and GPx genes were up-regulated in positive correlations to the AFB1 levels.
Keywords | Aflatoxin B1, AFB1, Broiler, LPO, SOD, GPx
Received | January 06, 2019; Accepted | February 02, 2019; Published | April 23, 2019
*Correspondence | Marwa Ibrahim Abd El Hamid, Department of Biochemistry and Chemistry of Nutrition, Faculty of Veterinary Medicine, Cairo University, Egypt; Email: marwa199@gmail.com
Citation | Khaled A, Moselhy WA, Ibrahim MA, Mahmoud AR, El-Wahab RRA (2019). Current trend on the economic and public health significance of salmonellosis in Iraq. Adv. Anim. Vet. Sci. 7(6): 492-497.
DOI | http://dx.doi.org/10.17582/journal.aavs/2019/7.6.492.497
ISSN (Online) | 2307-8316; ISSN (Print) | 2309-3331
Copyright © 2019 Khaled et al. This is an open access article distributed under the Creative Commons Attribution License, which permits unrestricted use, distribution, and reproduction in any medium, provided the original work is properly cited.
Introduction
The most economic influences of mycotoxins are the loss of human and animal life, the increased veterinary care costs, the disposal of contaminated food and feed andthe reduced livestock production. Internationally, efforts have continued to set guidelines and control mycotoxins, but practical measures have not been implemented (Zain, 2011).
Mycotoxins mainly contaminated the animals feed. However, their levels were not high enough to cause apparent diseases but may cause subclinical changes in animal growth, production, immunosuppression and consequently economic loss (Nahla et al., 2015). Significantly, mycotoxins not only cause problems for the animal feed industry but also threaten the consumer’s safety (Bryden, 2012). In Egypt, the poultry industry is highly based on the imported feed ingredients thus, the contamination with fungi are very high either during the stages of production or during transportation period or may occur during storage stages in the markets (Hassan et al., 2012).
The oxidative stress caused by AFB1 may be one of the underlining mechanisms for AFB1-induced cell injury and DNA, protein and lipid damages, which might lead to tumorigenesis (Daniela & Ionelia, 2012). Oxidative stress describes various deleterious processes resulting from an imbalance between limited antioxidant defenses and the excessive formation of ROS (Hossam El-Din, 2013). The cell can tolerate a small and moderate amount of oxidative stress which, under normal conditions are cleared from the cell through antioxidant molecules (Halliwell & Gutteridge, 2007). This study aimed to evaluate the prevalence of aflatoxins among broiler farms in Beni-Suef province and determine the effect of AF1 on the antioxidant status. We examined feed, liver and muscle samples.
Materials and methods
Study Area
Five poultry farms were selected from West, North, South and Central of Beni Suef province respectively [Ehnasiadistrict (farm 1), Naser district (farm 2), Bebadistrict (farm 3), New Beni Suef (farm 4) and Beni Suefdistrict (farm 5).
Data Collection
This survey was conducted between July and September 2017. A questionnaire was collected from each visited farms which focused on the information of the general farm management (Table 1).
Samples Collection
A total of 100 feedstuff samples and broiler chickens were collected from the five broiler farms at the age of marketing (40 days). The breast muscle and liver samples were taken after slaughtering.All collected samples were frozen at -80oC till the time of analysis.
Determination of Aflatoxin B1 Residuesin Feed Stuff, Liver and Muscle Samples
The VICAM AflaTest immunoaffinity fluorometric method VICAM, (1997) was used according to Hansen (1993).
Determination of the Antioxidant Status in Liver Homogenate
Determination of lipid peroxidation content (LPO) was done according to the method of Yagi, (1987) while determination of Glutathione (GSH) content was performed according to the method of Beutler et al. (1963). The estimation of SOD activity was done according to the method of Marklund & Marklund (1974).
Quantitative Real-Time Pcr Analysis of Gpx and Sod Genes
A 100 mg of liver tissue was used for total RNA extraction using a Total RNA Extraction Kit. After confirming the concentration and purity of RNA, (Reverse transcriptase) RT-PCR was performed using M-MuLV Reverse Transcriptase (NEB#M0253) (Abdel Aziz et al., 2018). Quantitative assessment of c-DNA amplification for each gene was performed relative to beta-actin (ACTB) by a fluorescence based real-time detection method with a fluorescent SYBR Green dye (Thermo Scientific, Cat. No. K0221). The sequence of primers sets used for qRT- PCR analysis of gene expression were designed using primer 3 program. Glutathione peroxidase (GPx) (NM_001277853.2) Forward:-GATGACCAACCCGCAGTACA Reverse: AGCTTTGAAAACATCGGGCG Superoxide dismutase (SOD) (NM_204211.1) Forward:- TACAGCTCAGGTGTCGCTTC Reverse: GCGAAGGAACCAAAGTCACG. Changes in the concentration of the product were assessed by measuring the fluorescence level during the elongation phase of PCR. The real-time PCR conditions were performed as follows: 95 °C for 5 min (initial denaturation) and then 40 cycles at 95 °C for 15 s, 60 °C for 20 s, and 72 °C for 15 s. After the final cycle, the melting curve analysis of all samples was performed through one cycle of 95 °C for 15 s, 58 °C for 15 s, and 95 °C for 15 s. B-actin is used as internal control (Afifi et al., 2018). Negative controls that were free of the template were included in each experiment. Each qRT-PCR was performed with three biological replicates and each biological replicate was assessed three times (Kamel et al., 2018). The comparative 2−ΔΔCTmethod was used to calculate the relative transcription levels (Ibrahem and Ibrahim, 2014) using Mxpro software Stratgene (Morgan et al., 2017).
Statistical Analysis
Data were subjected to statistical analysis using the One-Way Analysis of Variance as a Complete Randomized Design (CRD) using the general linear model’s procedure of statistical analysis software (SPSS 16 for windows). The means showing significant differences (P<0.05) were compared using Duncan’s Multiple Range Test (DMR).
Results
Aflatoxin B1 Concentrations
The mean values of AFB1 in the feed (Table 2) were significantly higher in all examined farmsin comparing with the permissible limit of the European Commission, 2003 (20μg/kg).
Moreover, the mean values of AFB1 in muscles samples (Table 2) were significantly higher than the permissible limit of the European Commission (EC) No 1881/2006 (5μg/kg). The highest significant difference was detected in farm 2.
In the other hand, the mean values of AFB1 in liver samples were higher than the permissible limit ofthe European Commission (EC) No 1881/2006 (5μg/kg) in farm 1,2 and 5. The farm 3 and 4 recorded non-significant higher values than the permissible limits.
Table 1: The data collected from the farms
| Item | Farm 1 | Farm 2 | Farm 3 | Farm 4 | Farm 5 |
| Number of chicken in the farm | 12000 | 36000 | 2000 | 14000 | 12000 |
| Age of chicken at the time of experiment. | 40 day | 40 day | 40 day | 39 day | 40 day |
| Weight of bird | 1600-2100 g | 1800-2100 g | 1800-2000 g | 1600- 2200 g | 1600- 2200 g |
| System of breeding | On the floor | Battery | On the floor | On the floor | On the floor |
|
System of ventilation.
|
Window and ventilator | Window and ventilator | Window and ventilator | Ventilator | Window |
| Composition of ration and feed additives. | yellow corn- Soybean oil- soya- Gluten of corn- Mineral salts and vitamins | yellow corn- Soybean oil- Gluten of corn- antioxidant- antifungal- Mineral salts and vitamins | yellow corn- Soybean oil- soya- Gluten of corn- antioxidant- antifungal- Mineral salts and vitamins | yellow corn- Soybean oil- soya- Gluten of corn- antioxidant- antifungal-anticoccidial and clostridia Mineral salts and vitamins | yellow corn- Soybean oil- soya- Gluten of corn- antioxidant- antifungal-anticoccidial and clostridia Mineral salts and vitamins |
| Frequency of bedding exchange. | Sawdust change according to the conditions | Sawdust change according to the conditions | Sawdust change according to the conditions | Sawdust change according to the conditions | Sawdust change according to the conditions |
| Source of water supply. | Tap water | Tap water | Tap water | Tap water |
Tap water |
The correlation coefficient between the levels of AFB1 residues in feed and their levels in breast muscle and liver.
Table 2: Aflatoxin B1 residues (ppb) in samples collected from Beni-suef province (mean± S.E).
| Item | Feed stuff | Liver | Breast Muscle |
| Farm 1 |
70±2.30 b |
27±1.73 a |
4.67±1.35 a |
| Farm 2 |
47±1.73 a |
15±2.64 c |
9.37±1.66 b |
| Farm 3 |
42.67±2.60 a |
9.33±1.56 b |
6.20±1.70 ab |
| Farm 4 |
41±2.01 a |
8.50±0.92 b |
7.30±1.68 ab |
| Farm 5 |
60±2.30 c |
27±1.70 a |
6.26±1.21 ab |
−Data expressed as mean ± S.E.
− The different letter in the same column indicates significant difference according to one way ANOVA (p≤ 0.05).
Table 3: The correlation between levels of AFB1 residues in feed stuff and their levels in muscles and liver
| Item | Feed to muscles | Feed to liver |
| Farm 1 |
-1** |
1** |
| Farm 2 | -0.991 | 0.982 |
| Farm 3 |
0.999* |
-0.996 |
| Farm 4 | 0.334 | 0.207 |
| Farm 5 | 1 |
1** |
-* Correlation is significant at the 0.05 level (2-tailed).
-** Correlation is significant at the 0.01 level (2-tailed).
The positive feed to muscle correlation was detected in the farms 3, 4 and 5, while the negative correlation was detected in the farms 1 and 2. In addition to, the highest significant correlation between feed and liver was recorded in the farms 1 and 5, followed by the farms 2, 4 which were showed positive correlation but the negative correlation was recorded in farm 3, (Table 3).
Table 4: The mean values of (LPO), (GSH) and (SOD) in liver tissue homogenate of different broiler farms
| Item | LPO nmoles/100mg tissue/hr | GSH nmoles/100mg tissue | SOD mu/100mg tissue |
| Farm 1 |
4.026±0.67 a |
15.049±2.04 a |
59.885±4.92a |
| Farm 2 |
2.355±0.24 b |
16.133±2.25 a |
45.200±3.59b |
| Farm 3 |
2.231±0.46 b |
21.723±2.89 a |
51.054±4.14ab |
| Farm 4 |
2.147±0.26 b |
30.50±2.58 b |
48.648±5.53ab |
| Farm 5 |
3.200±0.30 b |
17.353±3.20 a |
56.157±2.43ab |
Table 5: The relative m-RNA expression level of the GPx and SOD genes.
| Farms | GPx | SOD |
| Farm 1 |
1.1±0.2a |
5.76±0.4a |
| Farm 2 |
1±0a |
1±0b |
| Farm 3 |
2.3±0.4b |
5.4±-0.23a |
| Farm 4 |
4.1±0.32c |
4.2±0.55c |
| Farm 5 |
3.2±0.22b |
5.5±0.23a |
−Data expressed as mean ± S.E.
− The different letter in the same column indicates significant difference according to one way ANOVA (p≤ 0.05).
Oxidative Stress
The highest LPO level was recorded in farm 1 followed by 5, 2, 3 and 4 respectively. The GSH were low in farm 1, 2, 5, 3 and finally 4 respectively. While, the SOD was high in farm 1, 5, 3, 4 then farm 2 respectively, (Table 4).
The relative mRNA expression levels of GPx and SOD:
The results of relative m-RNA levels of both SOD and GPx were shown in Figure 1 and Table 5. Up-regulation of the studied genes were detected in farm 3,4 and 5 for the GPx and in farms 1,3,4 and 5 for the SOD genes.
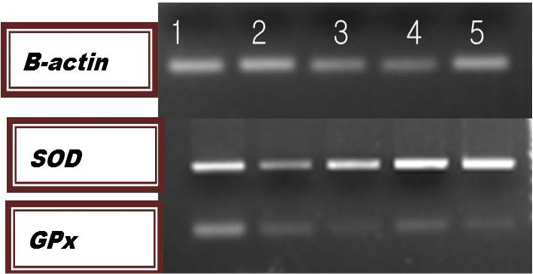
Figure 1: Agarose gel Electrophoresis of the PCR products for the examined genes. Lane Lane 1: farm1; lane 2: farm 2; lane 3: farm 3: lane 4: farm 4; lane 5: farm5.
Discussion
AFB1 is the most toxic agent of aflatoxins and it is categorized as a human carcinogen (Talebi et al., 2011). AFB1 is known in experimental humans and animals as the most potent hepatocarcinogen (Lopez et al., 2002). Significantly, the cell-mediated immunity was reduced in chicks fed on ration contaminated with (2 ppm) Aflatoxin B1 (Nedeljković-Trailović et al., 2004; Verma et al., 2004).
At this study, the highest results of AFB1 in feedstuff samples were recorded in farm 1 and5 and the same results were detected by Alkhalaf et al. (2010), Mngadi et al. (2008) and Azab et al. (2005). However, Khalil et al. (2015) reported the lower levels of AFB1 in the feed. The differences in the prevalence and levels of contamination of aflatoxins in poultry feed depend on a number of factors such as the geographical area, climatic conditions, storage conditions, type of raw material andthe damage of the grains by insects (Rashid et al., 2012).
Consequently, high levels of AFB1 in feed samples led tohighlevels of AFB1 in liver and muscle samples respectively. Similar results were recorded in the liver and muscle (Faten et al., 2016; Eleftheriadou et al., 2004) whereas, the higher results of AFB1 residues were reported in liver and muscle samples (Begum et al., 2001) while Saqer, (2013) and Zahid et al. (2010) detected the lower average of AFB1 in liver and muscles.Our results were in accordance with the positive correlation between feed and liver whereas, the correlation between feed and muscle showed a direct relationship (Hussain et al. 2010).
Low qualified, poor hygienic handling of chicken carcasses and improper evisceration lead to an increase in the bacterial count. In addition, bad chilling cause mold contamination and food spoilage enhanced toxins production as aflatoxins (Martín-Sánchez et al., 2011).
AFB1 caused ROS production and lipid peroxidation (Farombi et al., 2005). The enzymatic antioxidants are the major determinants of the antioxidant status of the cell (Verma and Nair, 2001). SOD, and GPx are vital antioxidant enzymes responsible for scavenging ROS.We recorded up-regulation the SOD and GPx genes. The increases in the expression level were correlated to AFB1 concentration in feed and muscle samples. The GSH-Px, SOD were markedly decreased in the AFB1 group (Wang et al., 2013). The elevated expression of the hepatic SOD and GPx genes might reduce the conjugation of the reactive metabolites by the hepatocytes.
Our results were supported by the detection of LPO, GSH and SOD in the homogenized liver. The LPO results offarms 1, 2 and 5 were higher than other farms which might be due to higher levels of AFB1in liverat these farms. Our findings agreed with those of Hou et al. (2013); Yang et al. (2012). The increased LPO levels may lead to depletion of non-enzymatic antioxidants (Salem et al., 2018). The GSH is mainly responsible for converting oxidized glutathione into reduced glutathione, and increased GSH activity means that reduced glutathione is increased (Yang et al., 2012). The levels of AFB1 increased the SOD levels and which is in accordance with Gökhan et al. (2005) and disagreed with Hou et al. (2013) who detected low levels of SOD associated toAFB1 contamination.The SOD plays a vital role in the conversion of O2–into H2O2 thus; the increase in SOD might be attributed to the removal of increased oxygen free radicals in AFB1 contamination (Yang et al., 2012).
Conclusion
The detected concentrations of aflatoxin B1 in feedstuff, muscles and liver samples were higher than the permissible limits. The AFB1 elevated the LPO and SOD and decreased the GSH activity. In addition, up-regulation of both SOD and GPx genes were detected in positive correlations with AFB1 levels.
Conflict of interest
The authors declare that they have no conflict of interests.
Authors’ contributions
All authors contributed equally in the planning of the study, drafting the manuscript. All of them approve the final version of the article.
References


