Advances in Animal and Veterinary Sciences
Research Article

Productivity and Qualitative Meat Indicators of Angus Steers of Various GH Genotypes
Ivan Fiodorovich Gorlov*1,2, Aleksandr Vasilevich Randelin1, Marina Ivanovna Slozhenkina1,2, Natalia Ivanovna Mosolova1, Valentina Viktorovna Randelina1, Oksana Aleksandrovna Sutorma3, Yuri Nikolaevich Fedorov4, Yuri Dmitrievich Danilov1
1Volga Region Research Institute of Manufacture and Processing of Meat-and-Milk Production, 400131, Rokossovskogo street, 6, Volgograd, Russian Federation; 2Volgograd State Technical University, 400005, Lenin avenue, 28, Volgograd, Russian Federation; 3Volgograd State Agrarian University, 400002, University avenue, 26, Volgograd, Russian Federation; 4All-Russian Research and Development and Technological Institute of Biological Industry, 141142, Shchelkovsky district, Biocombinate Village, Moscow region, Russian federation
Abstract | The paper presents the results of studies on the effect of a GH genotype of Angus steers on the growth rate and quality of meat products. It has been established that the GC and CC genotypes steers at the age of 8 months out yield their GG genotype agemates by 0.92 and 2.62% in terms of the live weight and at 16 months of age by 2.83 and 6.26%, respectively. Over the period of the experiment, the CC genotype steers had higher average daily gain in the live weight than the GG and GC genotypes steers by 9.87 and 5.15%. The control slaughter results have shown that animals of these genotypes exceeded their agemates in terms of the hot carcass weight by 9.17 and 4.76%, respectively, carcass yield by 1.65 and 0.81%, weight of carcass flesh by 10.37 and 5.17% and its yield by 0.91 and 0.31%. The results of the chemical analysis of an average flesh sample of carcasses has shown, that meat of the GG genotype steers contained more fat than that of the GC and CC genotypes steers by 1.22 and 1.77%. At the same time, higher protein content was found in meat of the CC genotype steers. Differences between groups of animals of different genotypes with respect to their amino acid composition of flesh proteins and culinary and technological indices have been revealed. It should be noted that meat of the GG genotype steers was tenderer and the cutting force was lower than that when cutting meat of GG and CC genotypes steers by 0.09 and 0.13 kg/cm2, respectively. Calculations have shown that the level of beef production profitability was higher in the group of the CC genotype steers by 4.5 and 2.1% in comparison with their GG and GC genotypes agemates.
Keywords | Angus breed, Polymorphism, Genes, Slaughter qualities, Beef quality.
Received | November 08, 2018; Accepted | February 18, 2019; Published | March 30, 2019
*Correspondence | Ivan Fiodorovich Gorlov, Volga Region Research Institute of Manufacture and Processing of Meat-And-Milk Production, 400131, Rokossovskogo street, 6, Volgograd, Russian Federation; Email: niimmp@mail.ru
Citation | Gorlov IF, Randelin AV, Slozhenkina MI, Mosolova NI, Randelina VV, Sutorma OA, Fedorov YN, Danilov YD (2019). Productivity and qualitative meat indicators of angus steers of various gh genotypes . Adv. Anim. Vet. Sci. 7(5): 427-433.
DOI | http://dx.doi.org/10.17582/journal.aavs/2019/7.5.427.433
ISSN (Online) | 2307-8316; ISSN (Print) | 2309-3331
Copyright © 2019 Gorlov et al. This is an open access article distributed under the Creative Commons Attribution License, which permits unrestricted use, distribution, and reproduction in any medium, provided the original work is properly cited.
INTRODUCTION
The intensity of the breeding process to improve breeds and cattle populations is largely related to the objectivity of the evaluation of breeding qualities of stud bulls and stud stock. At the same time, the age of animals influences the effectiveness of the assessment, i.e., the younger the animal (especially the bull) to be assessed is, the more effective the selection progress is. The DNA technologies make it possible to minimize the age for evaluation of the animal genotype.
Researchers in Russia and other countries (Barendse, 2003; Kaminski et al., 2008; Gorlov et al., 2014; Fedunin et al., 2014) have noted that it is possible to select the desired genotypes of animals right after their birth. Genetic markers associated with quantitative and qualitative indicators of productivity were identified (Lacorte et al., 2006; Barendse, 2007).
According to the authors (Mitra et al., 1995; Gorlov et.al, 2017), there are interpopulation and inter-breed differences in the allelic polymorphism of individual genes. There are also differences in allelic and genotypic polymorphism in animals within the breeds.
Particular importance is attached to the GH growth hormone that has an effect on growth and energy distribution in the body of cattle. Moreover, participating in metabolic processes, it has a wide spectrum of actions (Dybus, 2002; Tatsuda et al., 2008; Lazebnaya et al., 2011).
Selection of animals for further breeding according to genetic markers associated with quantitative and qualitative productivity indicators at an early age allows significant accelerating of the selection and genetic process in the herd, population and breed (Gorlov et al., 2016; Radchikov et al., 2018; Sulimova et al., 2016).
The purpose of our research was to study the growth rate, characteristics of the carcass quality formation and biological value of their flesh parts, depending on the GH genotype of the steers (GG, GC and CC).
MATERIALS AND METHODS
Experimental studies were carried out on animals of the Angus breed in OOO “Tingutinskoe” in the Svetloyarsky rayon of the Volgograd region.
Based on the results of typing the GH gene alleles, there were formed 3 groups of Angus breed steers at the age of 8 months, 10 heads each. Group I consisted of steers with the GG genotype associated with “marbling, “Group II included CG genotype associated with a greater weight of carcasses and a high level of “marbling” and Group III included CC genotype associated with greater weight of carcasses and lowered “marbling”.
From the blood samples of the experimental animals, the DNA was isolated using a DiatomTMDNA Prep200 kit (IsoGen, Russia) intended for this purpose according to the manufacturer’s instructions.
For the polymerase chain reaction (PCR), a Gene Pak TMPCR Core set (Iso Gen, Russia) and Encyclo PCR kit (Evrogen, Russia) were used with primers synthesized in the Research and Production Company Litech.
The alleles of the investigated gene were typed using amplification products by the restriction endonuclease Alul for the GH gene followed by the electrophoretic analysis of the restriction products in the agarose gel.
All groups of experimental steers were in similar keeping and feeding conditions. The youngsters were kept loose in standard rooms, on deep bedding, with free range to the feeding areas and access to water.
The digital material was processed by the method of variation statistics Microsoft office, Statistic and the Structure program with the determination of the reliability of the difference at three levels of Student-Fisher probability.
Statistical Analysis
The data on different variables, obtained from the experiment, were statistically analyzed by Statistica 10 package (StatSoft Inc.). The significance of differences between the indices was determined using the criteria of nonparametric statistics for the linked populations (differences with P>0.95 were considered significant: aP>0.999; bP>0.99; cP>0.95; ns = not significant at P<0.95). Student’s t-test was applied for the statistical analysis (Johnson and Bhattacharyya, 2010). The mean of a set of measurements was calculated according to the formula: 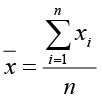 , where
  is a mean value;
  is the sum of all xi with i ranging from 1 to n, n is a number of measurements. The residual variation is expressed as a root mean square error (r.m.s.e.):
 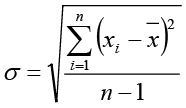 . The standard error of mean (s.e.m.) was calculated by the formula:
 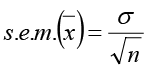 . The reliability of a sample difference (Student’s t-distribution) was estimated by the test of the difference validity, which is the ratio between the sample difference to the non-sampling error. The test of the difference validity was determined by the formula:
 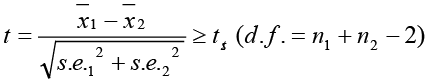 , where t is a Student’s t-distribution; (
 ) is a difference of the sample mean measurements;
  is a sample difference error; s.e.m.1, s.e.m.2 is a non-sampling error of the sample statistics compared; tst is a standard criterion according to the t-Table for the probability threshold preset depending on degrees of freedom; n1, n2 is a number of measurements in the samples compared; d.f. is a degrees of freedom for difference of two mean measurements.
RESULTS AND DISCUSSION
Feeding diets of experimental young animals were developed in accordance with the A.P. Kalashnikov’s recommendations (2003) using the “Korm Optima” program and were designed to obtain an average daily gain of live weight of 1000-1100 g.
The ration included grass and legume hay, Sudan grass haylage, grain mix, molasses, salt and premixes. The results of control feeding showed that in the groups of steers there were some differences in coarse fodder intake. So, the hay intake in Group III of the HC genotype steers was higher by 5.02 and 4.28% than in Group I, while haylage intake was higher by 4.20 and 3.52%. Over the period of the experiment, the steers in Group III consumed more dry matter than the steers in other two groups by 3.63 and 3.37%, energetic feed units (EFU) by 3.78 and 3.06% and digestible protein by 3.23 and 2.83%, respectively.
The observation over the growth and development of the animals has established that the CG and CC genotypes steers (Groups II and III) exceeded their GG genotype agemates (Group I) with respect to the live weight right after the formation of the groups. At the age of 8 months their superiority was 0.92 and 2.62%.
With age, differences in the live weight between the experimental groups increased. So, at 12 months of age, the difference in live weight showed the favor of the steers in Groups II and III of 2.28 (P>0.95) and 5.76% (P>0.99), at the 14 month of age 2.29 (P>0.95) and 6.16% (P>0.999) and at the 16 month of age 2.83 (P>0.95) and 6.26% (P>0.99), respectively.
Thus, the steers with the HS and CG genotypes of the GH growth hormone had the highest live weight.
During the rolling period, the highest average daily body weight gain was established in the HC genotype steers. In terms of the average daily weight gain, the youngsters in Group III (CC) exceeded their agemates in Groups I and II by 9.87 (P>0.99) and 5.15% (P>0.95), respectively. With respect to this indicator, the animals in Group II (CG) outperformed the steers in Group I (GG) by 4.49% (P>0.95) (Table 1).
The results of control slaughter showed that in terms of hot carcass weight, the HC genotype youngsters in Group III outperformed the steers in Groups I and II by 9.17 (P>0.999) and 4.76% (P>0.95). The carcass yield in Group III was higher by 1.65 and 0.81%, respectively.
In terms of the weight of internal fat, there was revealed superiority of the youngsters in Group I in comparison with their agemates in Groups II and III, which was 2.90 and 9.23% (P>0.95), respectively (Table 2).
In general, the slaughter weight of the steers in Group III was more than that of their agemates in Groups I and II by 8.17 (P>0.999) and 4.20% (P>0.99), and the slaughter yield was higher by 1.19 and 0.52%.
According to the results of the boning carcasses, it has been found that the weight of the carcasses flesh of animals in Group III was greater than that in Groups I and II by 10.37 (P>0.999) and 5.17% (P>0.99) and its yield by 0.91 and 0.31%. The weight of bones and their yield were greater from animals in Group I.
The fleshing index, indicating the ratio between flesh and bones in carcass, was higher in the CC genotype steers (Group III) by 0.21 and 0.08 compared with their agemates.
The conducted studies have shown that the highest dry matter content was in the average test sample of the GG genotype steers in Group I. With that in mind, there was more fat in flesh of the carcasses of young animals in Group I than in that of their agemates in Groups II and III by 1.22 (P>0.999) and 1.77% (P>0.999), respectively. The least amount of fat was found in flesh of animals in Group III. The weight fraction of protein in meat was higher in the CC genotype steers compared with their agemates by 0.34% in Group I and by 0.06% in Group II with unreliable difference.
The energy value of 1 kg of flesh of steers in Group I was higher than that of their agemates by 0.43 MJ or 5.19% (P>0.99) and 0.63 MJ or 7.79% (P>0.999), respectively. The most optimal ratio between protein and fat in meat (1:0.75) was found in animals in Group I.
The longissimus muscle of the GG genotype steers in Group I contained more fat than that of their agemates in Groups II and III by 0.35 (P>0.95) and 1.06% (P>0.999), less protein by 0.62 (P> 0.999) and 0.93% (P>0.999) (Table 3).
The M-longissimus of steers in Group I have been found to contain the most significant amount of amino acids. With that in mind, their muscles contained more essential amino acids than that in Groups II and III by 1.24 and 2.40% and nonessential ones by 0.65 and 0.81%, respectively.
There are also differences in the technological properties of flesh established. The moisture retention capacity of the longissimus muscle was higher in Group I than in Groups II and III by 0.65 (P>0.95) and 1.69% (P>0.999), and its ability to cook down was lower by 0.55 (P>0.95) and 1.67% (P>0.999), respectively.
Table 1: Average daily gain in live weight, g
|
Age period, months |
Numerical order of group |
||||||||
|
I (n = 10) |
II (n = 10) |
III (n = 10) |
|||||||
|
mean |
s.e.m. |
P* |
mean |
s.e.m. |
P* |
mean |
s.e.m. |
P* |
|
|
8-9 |
932.5 |
8.64 |
0.63ns |
940.4 |
9.15 |
1.49ns |
958.6 |
8.10 |
2.20c |
|
10-11 |
1011.6 |
10.21 |
5.19a |
1077.4 |
7.53 |
7.42a |
1161.8 |
8.52 |
11.3a |
|
12-13 |
998.3 |
8.11 |
2.38c |
1027.5 |
9.19 |
5.21a |
1099.7 |
10.38 |
7.70a |
|
15-16 |
924.3 |
10.16 |
4.97a |
989.8 |
8.41 |
3.25b |
1030.2 |
9.17 |
7.74a |
|
8-16 |
983.7 |
9.39 |
3.12c |
1027.9 |
10.60 |
3.75b |
1080.8 |
9.32 |
7.34a |
*Note: a = P>0.999; b = P>0.99;c = P>0.95 compared with data on the Reproduction I;
ns = not significant at P>0.05
Table 2: Slaughter qualities and morphological composition of carcasses
Indicator |
Numerical order of group |
||||||||
|
I(n = 10) |
II(n = 10) |
III(n = 10) |
|||||||
|
mean |
s.e.m. |
P* |
mean |
s.e.m. |
P* |
mean |
s.e.m. |
P* |
|
| Pre-slaughter weight, kg |
430.3 |
2.67 |
2.79c |
441.7 |
3.09 |
3.38b |
456.2 |
2.98 |
6.47a |
| Weight of hot carcass, kg |
237.8 |
2.03 |
3.52b |
247.8 |
1.98 |
4.07b |
259.6 |
2.12 |
7.42a |
|
Carcass yield, % |
55.26 |
– | – |
56.10 |
– | – |
56.91 |
– | – |
| Weight of internal fat, kg |
14.20 |
0.32 |
0.94ns |
13.80 |
0.28 |
2.29c |
13.0 |
0.21 |
3.14c |
| Slaughter weight, kg |
252.0 |
2.06 |
3.34b |
261.6 |
2.01 |
3.74b |
272.6 |
2.15 |
6.92a |
| Slaughter yield, % |
58.56 |
– | – |
59.23 |
– | – |
59.75 |
– | – |
| Weight of chilled carcass, kg |
235.9 |
2.14 |
3.30b |
245.7 |
2.06 |
3.78b |
257.4 |
2.31 |
6.83a |
| Flesh weight, kg |
186.1 |
1.89 |
3.77b |
195.3 |
1.54 |
4.45b |
205.4 |
1.67 |
7.65a |
| Flesh yield, % |
78.89 |
– | – |
79.49 |
– | – |
79.80 |
– | – |
|
Weight of bones, kg |
39.90 |
0.39 |
1.92ns |
40.80 |
0.26 |
3.53b |
42.20 |
0.30 |
4.67a |
| Bone yield, % |
16.90 |
– |
– |
16.60 |
– | – |
16.40 |
– | – |
| Weight of tendons, kg |
9.90 |
0.18 |
1.28ns |
9.60 |
0.15 |
0.78ns |
9.80 |
0.21 |
0.36ns |
| Tendons yield, % |
4.21 |
– | – |
3.91 |
– | – |
3.80 |
– | – |
| Fleshing index |
4.66 |
– | – |
4.79 |
– | – |
4.87 |
– |
– |
*Note: a = P>0.999; b = P>0.99;c = P>0.95 compared with data on the Reproduction I; ns = not significant at P>0.05
Table 3: Chemical composition of M-longissimus,%
|
Component |
Numerical order of group |
||||||||
|
I (n = 10) |
II (n = 10) |
III (n = 10) |
|||||||
|
mean |
s.e.m. |
P* |
mean |
s.e.m. |
P* |
mean |
s.e.m. |
P* |
|
|
Moisture |
76.55 |
0.14 |
1.44ns |
76.31 |
0.09 |
3.12c |
76.73 |
0.10 |
1.05ns |
|
Dry matter |
23.45 |
0.14 |
1.44ns |
23.69 |
0.09 |
2.96c |
23.27 |
0.11 |
1.01ns |
|
incl.: protein |
19.41 |
0.09 |
3.54b |
20.03 |
0.15 |
1.61ns |
20.34 |
0.12 |
6.20a |
|
fat |
3.02 |
0.05 |
4.48b |
2.67 |
0.06 |
9.85a |
1.96 |
0.04 |
16.55a |
|
ash |
1.02 |
0.01 |
2.12ns |
0.99 |
0.01 |
1.41ns |
0.97 |
0.01 |
3.53b |
*Note: a = P>0.999; b = P>0.99;c = P>0.95 compared with data on the Reproduction I;
ns = not significant at P>0.05
The culinary and technological parameter of meat of steers in Group I was higher than that of their agemates by 0.05 and 0.14. The M-longissimus of the GG genotype steers (Group I) had the least resistance when cutting. The force in cutting a muscle sample of animals in Group I was less than that in Groups II and III by 0.09 kg/cm2 or 18.75% (P>0.95) and 0.13 kg/cm2 or 25.00% (P>0.95), which indicated a more pronounced “tenderness” of meat of the GG genotype steers.
The quality of the carcass flesh was closely related to the content of connective tissues in it. Studies have shown that
Table 4: Lipids content in perirenal slaughter fat, mg/kg
Type of lipids |
Numerical order of group |
||||||||
|
I(n = 10) |
II(n = 10) |
III(n = 10) |
|||||||
|
mean |
s.e.m. |
P* |
mean |
s.e.m. |
P* |
mean |
s.e.m. |
P* |
|
| Triglycerides | 628.14 | 3.15 |
2.54с |
638.37 | 2.50 |
1.09ns |
642.51 | 2.87 |
3.37b |
| Phospholipids | 285.34 |
1.38 |
1.46ns |
281.55 | 2.19 |
0.92ns |
278.60 | 2.34 |
2.48c |
| Cholesterol | 27.98 | 0.26 |
3.41b |
26.82 | 0.22 |
4.85a |
25.41 | 0.19 |
7.98a |
| Cholesterol esters | 1.89 | 0.01 |
7.78a |
1.78 | 0.01 |
11.31a |
1.62 | 0.01 |
19.10a |
*Note: a = P>0.999; b = P>0.99;c = P>0.95 compared with data on the Reproduction I; ns = not significant at P>0.05
Table 5: Conversion of protein and fodder energy into meat products
Indicator |
Numerical order of group |
||||||||
|
I(n = 10) |
II(n = 10) |
III(n = 10) |
|||||||
|
mean |
s.e.m. |
P* |
mean |
s.e.m. |
P* |
mean |
s.e.m. |
P* |
|
| Edible part of the carcass, kg | 256.38 | 3.91 |
2.46c |
268.63 | 3.09 |
2.61c |
279.55 | 2.83 |
4.80a |
| deposited in tissues | |||||||||
| protein, kg | 48.30 | 0.39 |
5.41a |
51.36 | 0.41 |
4.60a |
53.62 | 0.27 |
11.21a |
| fat, kg | 36.35 | 0.46 |
2.75c |
34.81 | 0.32 |
0.23ns |
34.69 | 0.41 |
2.96c |
| energy, MJ | 2232.23 | 35.24 |
9.44a |
2226.94 | 29.43 |
0.80ns |
2261.15 | 31.15 |
0.62ns |
| Protein conversion ratio(PCR),% | 9.15 | – | – | 9.63 | – | – | 9.91 | ||
|
Total energy conversion ratio(TECR),% |
8.61 | – | – | 8.38 | – | – | 8.50 | ||
*Note: a = P>0.999; b = P>0.99;c = P>0.95 compared with data on the Reproduction I; ns = not significant at P>0.05
the supporting connective tissues framed the M-longissimus fibers. Parallel order of muscle bundles with lipid inter layers separating them was seen on the muscle sections. The most pronounced thickness of the fat layer was observed in the muscle sections of the GG genotype steers, the least pronounced in those of the CC genotype animals (Figure 1).
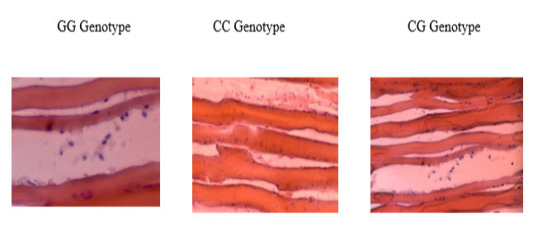
Figure 1: M-longissimus Microstructure of experimental steers (longitudinak sectionm 20x magnification)
Studies have shown that the synthesis and properties of adipose tissue in bodies of Angus young cattle differed depending on the steers’ GH genotype. So, the adipose tissue deposits in the bodies of the GG genotype steers in Group I was larger than that of their agemates in Groups II and III by 6.57 (P>0.95) and 18.78% (P>0.999), respectively.
Differences in the localization of fat in the bodies of experimental steers have been established. Higher deposition of subcutaneous adipose tissue was detected in steers in Group I compared with their agemates in Groups II and III by 5.42 and 10.33% (P>0.95), intermuscular adipose tissue by 12.31 (P>0.99) and 41,15% (P>0,999) and internal one by 2.90 and 9.23% (P>0.95).
With that in mind, the perirenal slaughter fat of the GG genotype steers in Group I contained more phospholipids than that of their agemates by 1.35 and 2.42% (P>0.95) and cholesterol by 4.35 (P>0.95) and 10.11% (P>0.999) (Table 4).
A higher content of triglycerides (least active lipids) was found in the slaughter fat of the CC gene animals in Group III in comparison with their agemates in Groups I and II by 2.29% (P>0.95) and 0.65%, respectively.
The content of saturated and unsaturated fatty acids indicated the biological value of adipose tissue and the nature of lipid metabolism in bodies of the test steers. The studies have shown that in the slaughter fat of the GG genotype steers contained more fatty acids. In terms of the sum of fatty acids, the steers exceeded their agemates in Groups II and III by 0.34 and 0.61%. With respect to the content of monoun saturated fatty acids, the differences were 0.58 and 1.44% and polyunsaturated ones 8.28 (P>0.95) and 8.65% (P>0.99), respectively. The level of saturated fatty acids was higher in the slaughter fat of the CC genotype steers by 0.95% and 0.39%.
The performed studies have established a higher deposition of protein in bodies of the CC genotype steers. In comparison with the steers in Groups I and II, their advantage was 11.01 (P>0.999) and 4.40% (P>0.99). A higher fat synthesis was established in bodies of the GG genotype steers in comparison with the iragemates in Groups II and III by 4.42 (P>0.95) and 4.79% (P>0.95),respectively (Table 5).
The youngsters in experimental groups have been established to have differences in the ratios of protein and energy conversions. The animals in Group III had higher protein conversion ratio by 0.76 and 0.28% in comparison with the steers in Groups I and II. The energy conversion ratio was higher in steers in Group I by 0.23 and 0.11%, respectively.
Calculations showed that the realization value of production was greater in Groups III and II due to the greater steers’ live weight that caused higher sale profit of animals in Group III than those in Groups I and II by 693.0 and 324.9 rubles, respectively, and the level of their profitability was higher by 4.5 and 2.1%.
Thus, the Angus steers with the CC genotype of the GH gene possessed higher growth energy; their carcasses were more massive and better muscled. The GG genotype young animals were observed to have a more intensive deposition of adipose tissue in their bodies. To obtain “marble” beef, animals with the GG genotype of the GH gene should be preferred; for leaner beef, the CC genotype steers are preferred.
Acknowledgments
The work was carried out within the framework of the grant of the Russian Scientific Foundation No. 15-16-10000 “Development and scientific substantiation of new approaches to the production of livestock raw materials and increasing the biological value of socially significant products based on modern biotechnological and molecular genetic methods”. Grant sponsors were not directly involved in the development, analysis, or writing of this article.
Conflict of Interest
Authors declare that they have no conflict of interest.
authors contribution
Study conception and design: Natalia Ivanovna Mosolova, Marina Ivanovna Slozhenkina.
Literature review: Aleksandr Vasilevich Randelin.
Measurements, Acquisition and Analysis of data: Oksana Aleksandrovna Sutorma, Aleksandr Vasilevich Randelin.
Interpretation of data and Drafting of manuscript: Yuri Dmitrievich Danilov, Aleksandr Vasilevich Randelin.
Critical revision: Ivan Fiodorovich Gorlov, Valentina Viktorovna Randelina, Yuri Nikolaevich Fedorov.
REFERENCES


