Advances in Animal and Veterinary Sciences
Research Article
Adv. Anim. Vet. Sci. 7(4): 280-288
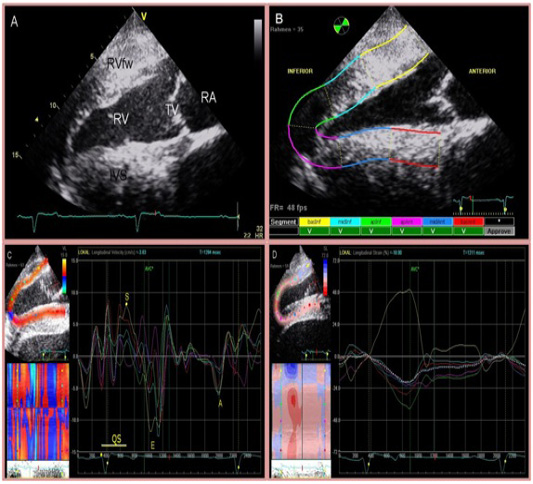
Figure 1
Four chamber view of the heart (A) and two-dimensional speckle tracking analysis (B). The right side of the image is cranial. Inferior is referred to as RV and anterior as IVS. The region of interest is manually divided into 6 segments starting at the IVS. Tracking quality is verified by the software and approved segments are marked with ‘V’. Segmental curves for long-axis images show the longitudinal velocity (C), and the longitudinal strain % (D). On the left, a greyscale image is displayed showing the tracked ROI. On the right, the segmental traces are displayed. The vertical axis represents values of the selected variable; the horizontal axis shows time (ms).


