Advances in Animal and Veterinary Sciences
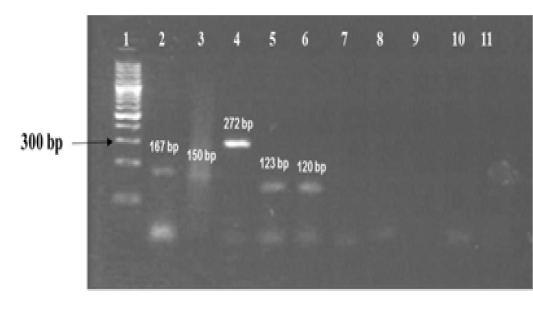
Standardization of PCRs for amplification of regions encompassing SNPs for differentiation of Mycobacterium strains using DNA templates from Mycobacterium tuberculosis H37Rv (MT) strain number 27294 from American Type Culture Collection (ATCC) USA, and Mycobacterium avium subspecies paratuberculosis (MAP) strain number 103963 from Collection de l’ Institut Pasteur (CIP) France.
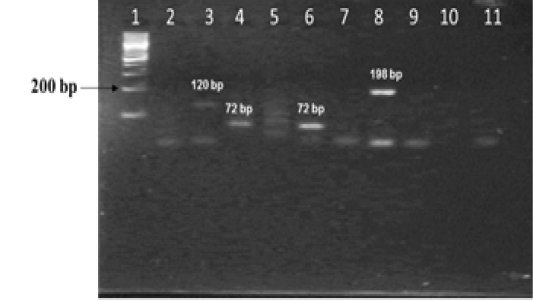
Standardization of PCRs for amplification of regions encompassing SNPs for differentiation of Mycobacterium strains using DNA templates from Mycobacterium tuberculosis H37Rv (MT) strain number 27294 from American Type Culture Collection (ATCC) USA, and Mycobacterium avium subspecies paratuberculosis (MAP) strain number 103963 from Collection de l’ Institute Pasteur (CIP) France.
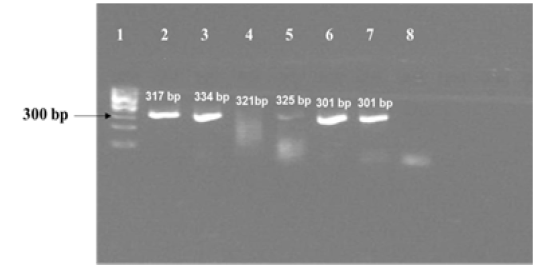
Results of PCR using primers for sequencing experiments on amplicon templates greater than 300 bp. Corresponding forward and reverse primer sets for 16S rRNA 1429, katG 463 , hsp 65 631, gyrA 95, gyrB (1410) and gyrB (675) gene targets were used for amplification of PCR products of expected sizes of 317 bp, 334 bp, 321 bp, 325 bp, 301 bp and 301 bp respectively.
Amplification of gyrA 95 gene from DNA extracted from cultures of field samples and reference strains.
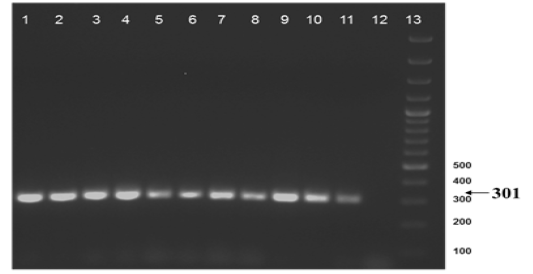
Amplification of gyrB (1410) gene from DNA extracted from cultures of field samples and refernce strains.
Relationship among field strains of Mycobacterium of animal origin with respect to reference strains compared on the basis of homology of sequences in the region of gyrB represented in the form of a Phylogenetic tree
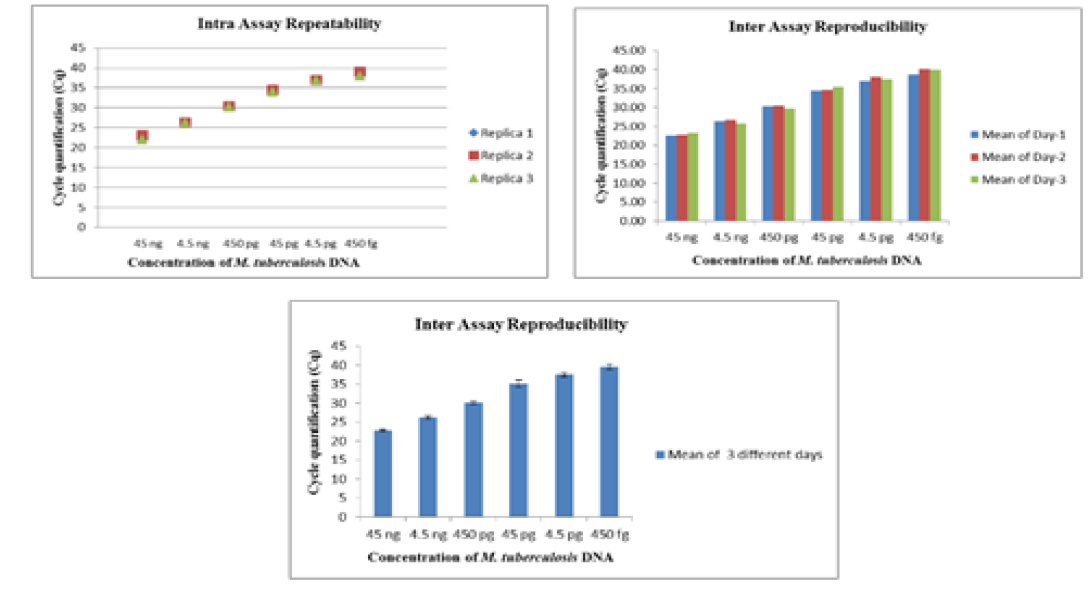
Intra-assay, inter-assay variability from 45 ng to 450 fg for gene target gyrA 95
Intra-assay, inter-assay variability from 45 ng to 450 fg for gene target gyrA 95
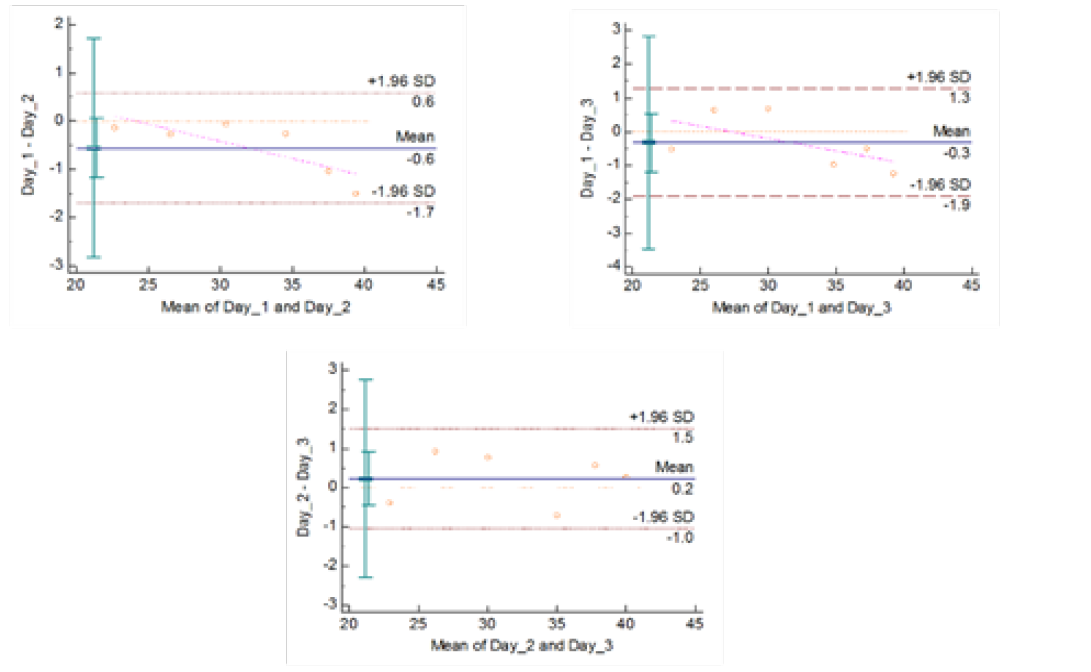
Reproducibility of gyrA 95 Real Time PCR: Variation in mean Cq values between days analysed by Bland-Altman Plot
Intra-assay, inter-assay variability from 60 ng to 600 fg for gene target gyrB (1410)
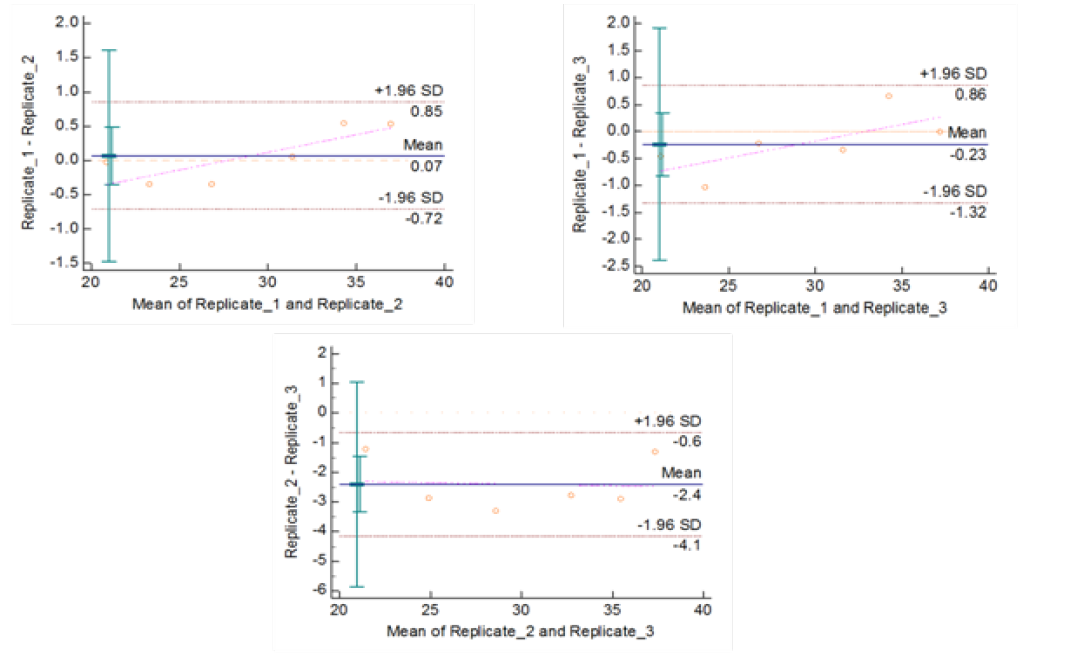
Repeatability of gyrB (1410) Real Time PCR: Variation in mean Cq values between replicates analysed by Bland-Altman Plot
Reproducibility of gyrB (1410) Real Time PCR: Variation in mean Cq values between days analysed by Bland-Altman Plot


