Advances in Animal and Veterinary Sciences
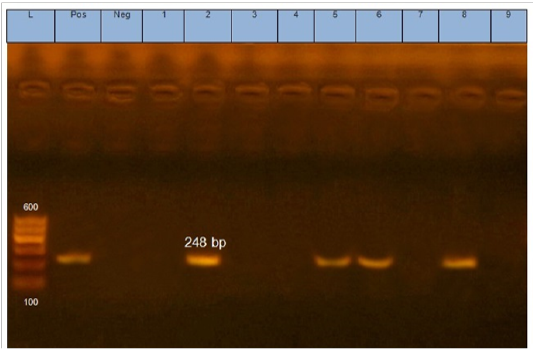
Gel electrophoresis of amplified eaeA gene (248bp): L= molecular weight marker (100bp), 2,5,6 and 8 E.coli samples were positive for eaeA gene. Neg=control negative reaction .pos=positive (previously known eaeA positive E. coli).
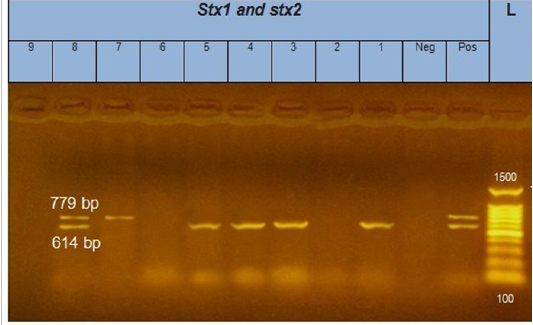
Gel electrophoresis of amplified stx1, stx2 genes (614bp), (779bp) respectively : L= molecular weight marker (100bp)=1,3,4,5 and 8 E. coli samples were positive for stx1 gene. While, 7 and 8 E. coli samples positive for stx2 gene. Neg= control negative reaction .pos=positive (previously known stx1, stx2 positive E. coli).

Gel electrophoresis of amplified hly gene (1177bp): L= molecular weight marker (100bp), from 1 to 9 E.coli samples were negative for hly gene. Neg=control negative reaction .pos=positive (previously known hly positive E.coli).


