Advances in Animal and Veterinary Sciences
Research Article
Adv. Anim. Vet. Sci. 6(12): 526-530
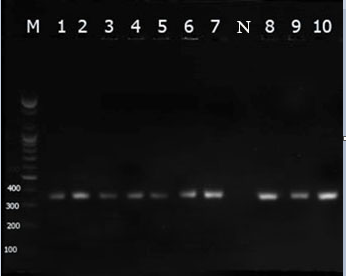
Figure 1
Visualization of toxA gene (352 pb) by 1.5% agarose gel analysis. The shown bands are representative of PCR products amplified from P. aeruginosa (lanes 1 -10), negative control (lane N), lane M represents 100 bp DNA ladder.
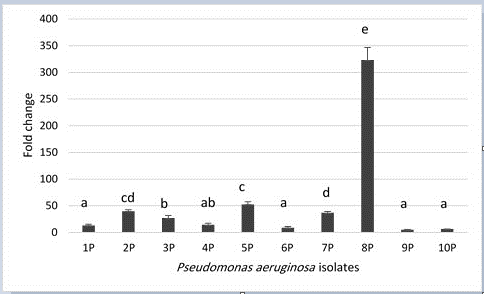
Figure 2
Fold change of toxA gene expression levels in P. aeruginosa isolates from bovine mastitis. P= 4.56 × 10⁻²¹, LSD0.05= 13.008. Columns with similar letter have insignificant differences. Error bars represent standard error of mean.


