Advances in Animal and Veterinary Sciences
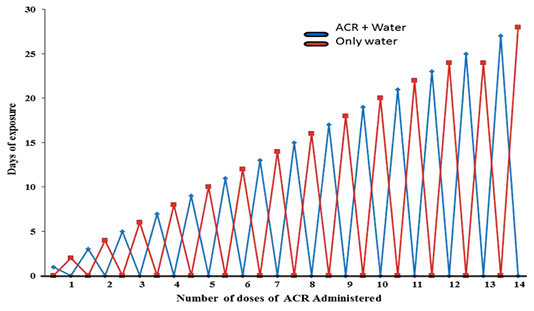
Schedule of rat exposure to ACR through drinking water

ACR induced alterations in liver biomarkers of rat.
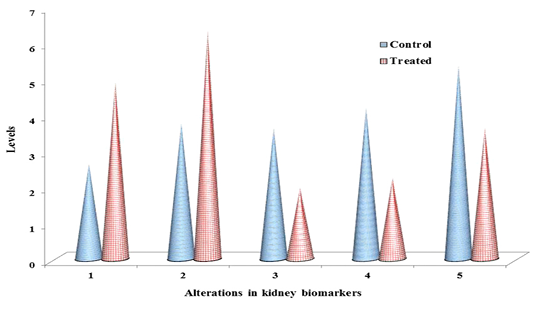
ACR induced alterations in kidney biomarkers of rat.
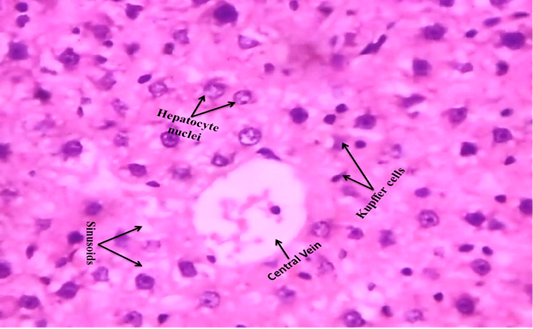
Control rat liver shows that normal hepatocyte nuclei, kupffer cells, sinusoids and central vein (H & E stain) (40X)
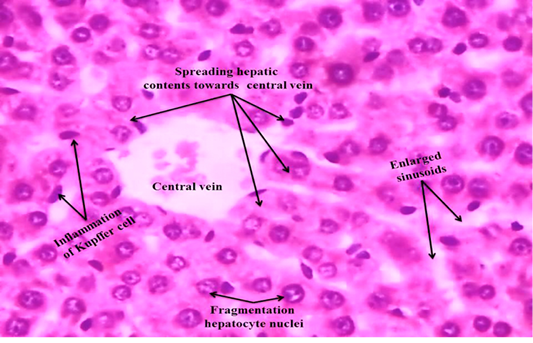
ACR administered rat liver section shows that enlarged sinusoid, fragmentation of hepatocyte nuclei, inflammation of Kupffer cells and spreading hepatic contents towards central vein (H & E stain) (40X).
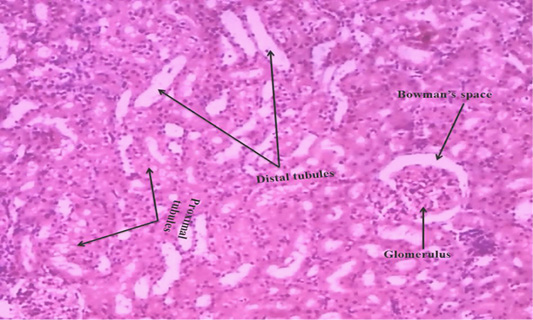
Control rat kidney section shows that normal proximal tubules, distal tubules, bowman’s space and glomerulus (H & E stain) (40X).
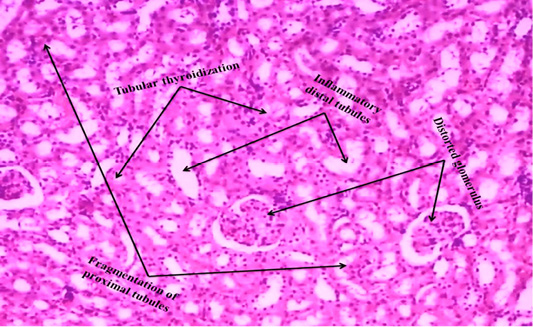
ACR administered rat kidney section shows that tubular thyroidisation, inflammation in distal tubules, distorted glomerulus and proximal tubules fragmentation (H & E stain) (40X).


