Advances in Animal and Veterinary Sciences
Research Article
Adv. Anim. Vet. Sci. 6(9): 384-387
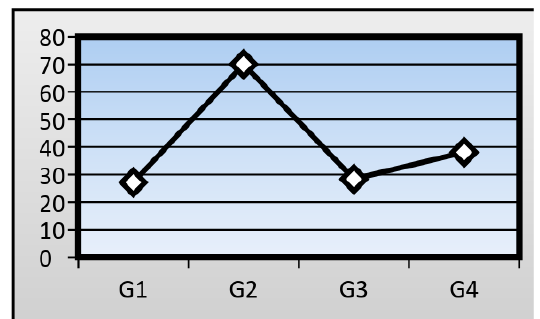
Figure 1
Mean serum level of ALT in experimental mice groups
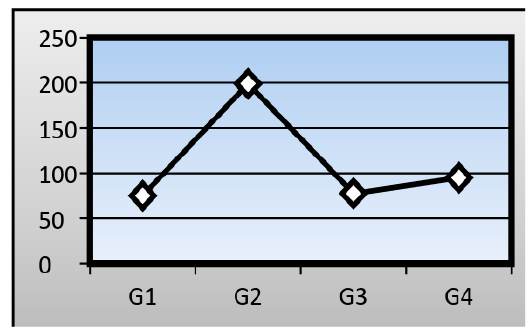
Figure 2
Mean serum level of AST in experimental mice groups
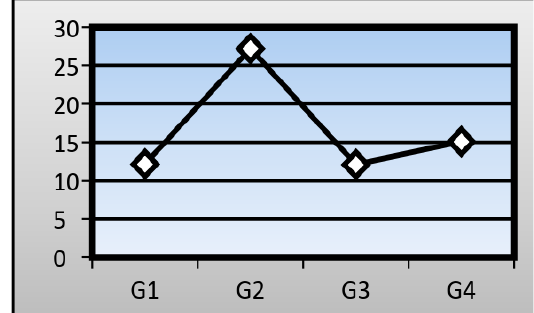
Figure 3
Mean serum level of GGT in experimental mice groups
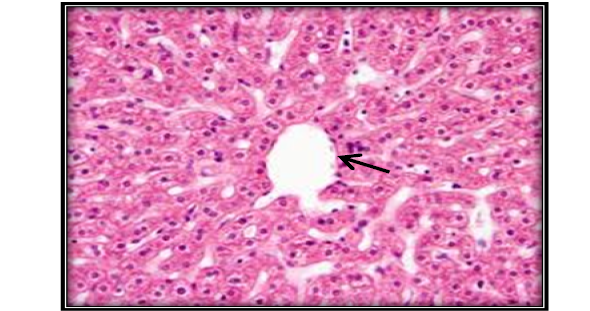
Figure 4
Liver section for untreated mouse (control) showing central vein ( ) surrounded with hepatic cord (H&E 200X).
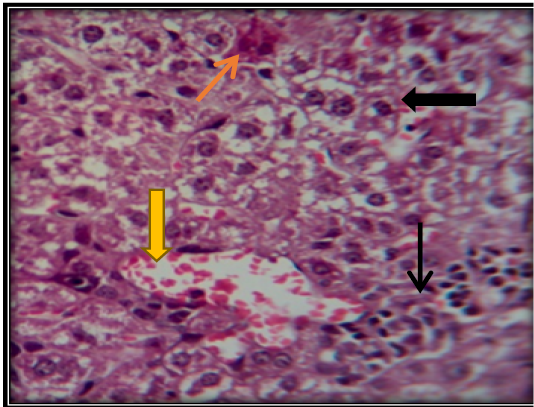
Figure 5
Liver section for mouse treated with AFB1showing congestion of central vein ( ) with vacuolation of hepatocyte ( ) and apoptotic cells ( ) and accumulation of inflammatory cells in necrotic areas ( ) (H&E 200X).
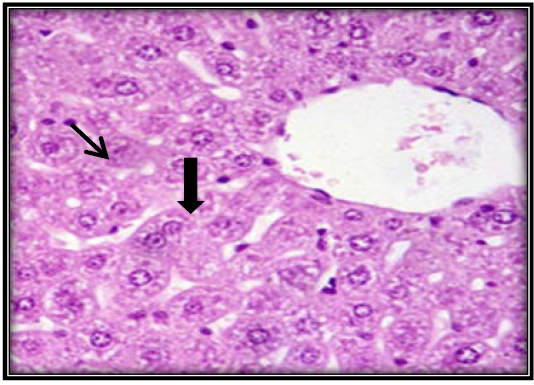
Figure 6
Liver section for mouse treated with AFB1 and ginger root extract showing single necrotic hepatocyte ( ) and mitotic figures of hepatocyte ( ) (H&E 400X).


