Research Journal for Veterinary Practitioners
Research Article

Relationships between Zoometric Measurements, Coat Colors and Body Condition Scores of the Nigerian Indigenous Dogs in Maiduguri, Northeastern
Yachilla Maryam Bukar-Kolo1, Muhammad Mustapha1, Musa Zakariah2, Abel Allo1, Lawan Adamu1*
1Department of Veterinary Medicine; 2Department of Veterinary Anatomy, Faculty of Veterinary Medicine, University of Maiduguri, P.M.B. 1069, Borno State, Nigeria.
Abstract | Zoometric measurements generally divulge inherent phenotypic and genetic physiognomies of species and breeds of animals, which also explains the aesthetic nature and endurance abilities of these animals globally particularly the canine species. Therefore, the present study evaluates the morphometric measurements, body condition scores and coat colors of the Nigerian indigenous dogs. One hundred and forty-four Nigerian indigenous dogs of different ages and sexes were investigated. In the male and female dogs, the average live weights were 15.99 ± 0.99 kg and 15.09 ± 0.93 kg, height at withers were 51.82 ± 0.77 cm and 51 ± 0.66 cm, body length were 59.23 ± 1.29 cm and 62.23 ± 1.08 cm, length of muzzle were 13.71 ± 0.29 cm and 14.11 ± 0.34 cm, head circumference were 35.49 ± 0.50 cm and 35.36 ± 0.31 cm respectively. The Nigerian indigenous dogs were weighed and assigned a BCS using the 9 point scale system in order to determine their adiposity and nutritional status. 45.2% of the females and 54.8% of the males had an ideal body weight base on the BCS, 33.3% and 66.7% of the females and males are classified as obese whereas 45.2% and 54.8% of the females and males were classified as being thin respectively. The Nigerian indigenous dogs appeared in distinct and combinations of coat colors. The association between gender and BCS was weak and not significant (Chi-squared = 0.480; P = 0.7866) however, an association between body condition scores and coat color was strong, but not significant (Chi-squared = 7.291; P = 0.2947) whereas the association between gender and coat color was strong and significant (Chi-squared = 9.892; P = 0.0195). In the ideal dogs there were strong positive and significant correlations between the zoometric measurements while, in the thin dogs there were variable correlations (both positive and negative) between the zoometric measurements. However, in the obese dogs there were positive perfect and significant correlations between body length and head circumference. In conclusion, the zoometric measurements and phenotypic traits of the Nigerian indigenous dogs may probably aid in the standardization and possible classification of these dogs and may assist in the selection of dogs based on aesthetic nature and endurance abilities.
Keywords | Phenotypic zoometric measurements, Body condition scores, Nigerian indigenous dogs
Editor | Muhammad Abubakar, National Veterinary Laboratories, Islamabad, Pakistan.
Received | June 20, 2016; Accepted | July 14, 2016; Published | July 28, 2016
*Correspondence | Lawan Adamu, Department of Veterinary Medicine, Faculty of Veterinary Medicine, University of Maiduguri, P.M.B. 1069, Borno State, Nigeria; Email: drlawan3758@yahoo.com.
Citation | Bukar-Kolo YM, Mustapha M, Zakariah M, Allo A, Adamu L (2016). Relationships between zoometric measurements, coat colors and body condition scores of the Nigerian indigenous dogs in Maiduguri, Northeastern Nigeria. Res. J. Vet. Pract. 4(3): 51-59.
DOI | http://dx.doi.org/10.14737/journal.rjvp/2016/4.3.51.59
ISSN | 2308-2798
Copyright © 2016 Bukar-Kolo et al. This is an open access article distributed under the Creative Commons Attribution License, which permits unrestricted use, distribution, and reproduction in any medium, provided the original work is properly cited.
Introduction
The domestic canine exhibits the highest morphological diversity than any mammal (Moody et al., 2006). Skeletal and cranial sizes are more variable in the single dog species than in all of the other Canidae species pooled together (Wayne, 1986a, b). Morphometry and body condition scores (BCS) are indispensable implements for assessing nutritional conditions, amount of fat and well-being of dogs (LaFlamme, 1997; Richard et al., 2009). The body composition is used to describe the percentage of adiposity, bone and muscles, however, dogs with the same body weight may have a different body composition and it could be estimated using dual-energy X-ray absorptiometry (Poppy et al., 2016). Nevertheless, with regular exercise and diet restriction by dog owners, vulnerability to obesity differs between dog breeds, which proposes the effect of genetic factors (Raffan et al., 2016).
Numerous methods are accessible for quantifying body composition and body fat in companion animals (Brunton et al., 1993, 1997; Ellis, 2000; German et al., 2006). Morphometric analysis, BCS, dimensional assessment (using tape measurement), and measurement of relative body weight provide an expedient measure of a dog’s general body composition (German et al., 2006). However, in the veterinary clinic setting the most widely accepted and practical process of body condition evaluation is body condition scoring using visual assessment and palpation. These methods are speedy, low-priced and non-invasive (German et al., 2006). A number of scoring systems are used; with 3, 5 or 9 points (Edney and Smith, 1986; Clution, 1988; LaFlamme et al., 1994; LaFlamme, 1997). The 9 points scheme is the most widely accepted (German et al., 2006). A score with 9 points correspond to a score system of 5 points, which uses half points. The authentication of the 9 point score has shown that dogs with an ideal BCS of 5 have 19 ± 8% fat mass. A 5% increase in fat mass is observed with each point (LaFlamme et al., 1994; LaFlamme, 1997). A 7 points procedure has also been developed to be used by owners to assess their pets (Burkholder WJ, 2001). Some studies, although limited, in companion animals have suggested an increase in morbidity when animals are underweight and overweight (German et al., 2006). Lowler et al. (2008) have demonstrated that in labrodor Retrievers a fat mass above 25% is associated with increased insulin resistance which independently predicts shorter lifespan and chronic diseases.
The Nigeria, indigenous dogs have not been classified or recognized as a breed and are commonly referred to as mongrels or “locals”. These dogs are commonly found in both rural and urban centres scavenging on refuse dumps. They are medium size dogs and appear in various coat colors. The phenotypic morphometric measurements and BCS of dogs have been studied elsewhere, however, there is a dearth of information on the morphometry and BCS of the Nigerian indigenous dogs in Maiduguri, Northeastern Nigeria. This study aims to determine certain dimensional evaluations, coat colors and BCS of the Nigerian indigenous dogs. The findings of this study will be germane to clinicians, pet owners and dog breeders.
Material and Methods
Study areas
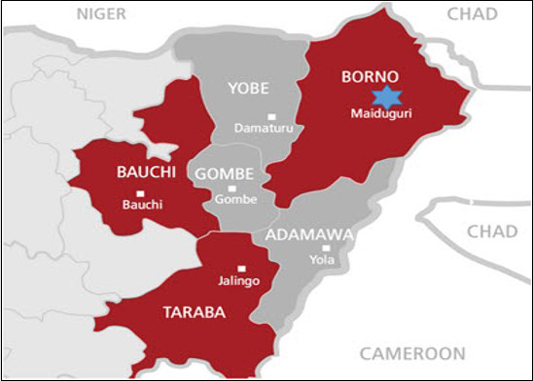
The study was conducted in Maiduguri, the capital of Borno State. The state lies between latitude 11° 32’ and 11° 4’ north and longitude 13° 32’ and 13° 25’ east and located between the Sudan Savannah and Sahel Savannah vegetation zones (Figure 1). The climate is characterized by two distinct seasons, yearly with a unimodal rainfall pattern, a long dry season of about 8-9 months. The dry season starts from November to April, while the rainy season is from May to October. The climate is generally very hot with mean annual rainfall of between 200-250 mm. The hottest months are March and April with a mean temperature of 37°C to 43°C (Carter, 1994).
Animal Subjects
The study involved one hundred and forty-four (144) owned (pet) Nigerian indigenous dogs of both sexes, 64 females and 80 males which were all sexually intact. Age ranged from 3.2-4.2 years. All the dogs were fed with similar food, i.e. leftover which generally consisted of carbohydrate (maize) or (rice), protein (beef) or (smoked fish) and sometimes with vegetables (in form of soups). All the dogs appeared, apparently healthy with temperatures and pulse rates within the normal range.
Data Collection
For consistency, all measurements were done by one person using Freeman’s measuring tape (Tailor’s tape) and a weighing balance (kg). Dogs were physically restrained and measurements were taken in the standing animal. Live body weight (LBW), wither height (HT), body length (BL), length of the muzzle (LM), and head circumference (HC) were measured. All the animals were randomly sampled.
The body weight was measured with a weighing balance in (kg). The tailor’s tape was used for measuring HT, BL, LM and HC in centimeters (cm). HT was the distance measured from the floor beneath the dog to the top of the withers.
Table 1: Morphometric measurements of Female and Male Dogs with Black Coat Colours and different Body Condition Scores
|
Female |
||||||
|
BCS |
HT (cm) |
Age (yrs.) |
BWT (kg) |
HC (cm) |
BL (cm) |
LM (cm) |
|
N |
54.61a ± 3.81 |
3.00a ± 0.50 |
22.00a ± 2.00 |
36.83a ± 1.27 |
71.12a ± 5.08 |
16.51a ± 1.27 |
|
T |
49.39a ± 1.47 |
4.22a ± 1.33 |
10.78b ± 0.22 |
34.15a ± 0.86 |
61.24a ± 1.96 |
12.42b ± 0.69 |
|
Male |
||||||
|
BCS |
HT (cm) |
Age (yrs.) |
BWT (kg) |
HC (cm) |
BL (cm) |
LM (cm) |
|
N |
56.19ab ± 1.91 |
2.63a ± 0.21 |
21.63b ± 0.63 |
37.15a ± 0.67 |
68.89a ± 1.47 |
15.72a ± 0.58 |
|
T |
50.04b ± 1.71 |
3.70a ± 1.14 |
10.40c ± 0.56 |
37.08a ± 3.08 |
56.39b ± 2.62 |
12.07b ± 0.47 |
|
OB |
59.69a ± 2.70 |
2.75a ± 0.59 |
42.50a ± 1.44 |
39.37a ± 0.73 |
74.93a ± 0.73 |
17.46a ± 0.32 |
All values are expressed as mean ±SE; a, b, c: Significantly different at p < 0.05; BCS: Body Condition Scores; HT: Height; BWT: Body Weight; HC: Head Circumference; BL: Body Length; LM: Length of Muzzle
Table 2: Morphometric measurements of Female and Male Dogs with Brown Coat Colours and different Body Condition Scores
|
Female |
||||||
|
BCS |
HT (cm) |
Age (yrs.) |
BWT (kg) |
HC (cm) |
BL (cm) |
LM (cm) |
|
N |
52.21b ± 0.86 |
1.83a ± 0.25 |
19.22b ± 0.43 |
36.41a ± 0.59 |
62.09ab ± 2.20 |
14.53b ± 0.64 |
|
T |
51.16b ± 1.38 |
3.43a ± 0.83 |
11.21c ± 0.39 |
35.11a ± 0.65 |
61.32b ± 2.18 |
13.79b ± 0.53 |
|
OB |
59.26a ± 0.85 |
3.17a ± 0.17 |
42.00a ± 1.73 |
38.10a ± 0.00 |
73.66a ± 0.00 |
17.78a ± 0.00 |
|
Male |
||||||
|
BCS |
HT (cm) |
Age (yrs.) |
BWT (kg) |
HC (cm) |
BL (cm) |
LM (cm) |
|
N |
57.57a ± 4.07 |
3.00a ± 1.95 |
21.67b ± 0.99 |
38.10a ± 1.48 |
70.27a ± 5.76 |
16.93a ± 1.14 |
|
T |
48.99a ± 1.88 |
5.14a ± 0.90 |
10.57c ± 0.46 |
33.66b ± 0.69 |
50.98b ± 2.67 |
12.15b ± 0.53 |
|
OB |
60.96a ± 7.05 |
4.00a ± 3.38 |
39.00a ± 1.71 |
38.10ab ± 2.57 |
73.66ab ± 9.98 |
17.78a ± 1.97 |
All values are expressed as mean ±SE; a, b, c, ab: Significantly different at p < 0.05; For abbreviations see Table 1
The body length was the distance from the point of the shoulders to the base of the tail, while the length of the muzzle was measured from the rostral area to the tip of the nose. The HC was measured by wrapping the tape around the circumference of the dog’s head behind the ears and across the forehead.
The Nestlé Purina body condition score (LaFlamme, 1997) was used for subjective assessment of body condition score. The dogs were given a score on a nine point scale, which ranged from 1 for thin to 9 for grossly obese. A dog with a BCS of 5 was considered to be ideal. This scoring system was based on a variety of features, which included palpability of the ribs, presence of a discernible waist and abdominal tucks, evidence of a bony prominence and fat deposit on the lumbar area and base of the tail.
Statistical Analysis
The data were analyzed with T-test, ANOVA with Tukey Kramer (HSD) test and multivariate pairwise correlation using JMP version 11 (SAS Institute, Inc. Cary, NC). The Chi-square test was analyzed with MedCalc Statistical Software version 15.6.1 (MedCalc Software bvba, Ostend, Belgium; https://www.medcalc.org; 2015). Analysis was considered significant at P<0.05.
Results
Table 1 shows the morphometric measurements of female and male dogs with black coat colors and different Body Condition Scores. There were significant differences between female dogs with black coat color exhibiting ideal (normal) body condition scores and those with thin BCS in terms of body weight and length of muzzle (P = 0.0042). The morphometric measurements of male dogs with black coat colors and different body condition scores showed significant differences between male dogs with black coat color with ideal (normal) body condition scores, obese BCS and those with thin BCS in terms of height at withers, body weight, body length and length of muzzle (P=0.0125).
Table 2 shows the morphometric measurements of female dogs with brown coat colors and different Body Condition Scores. There were significant differences between female dogs with brown coat colors showing ideal (normal) body condition scores, those with obese BCS and those with thin BCS in terms of height at withers, body weight, body length and length of muzzle (P = 0.0202). The morphometric measurements of male dogs with brown coat colors and different Body Condition Scores showed significant differences between male dogs with brown coat colors, presenting ideal (normal) body condition scores, obese BCS and those with thin BCS in terms of body weight, head circumference, body length and length of muzzle (P=0.0001).
Table 3: Morphometric measurements of Female and Male Dogs with Brown and White Coat Colours and different Body Condition Scores
|
Female |
||||||
|
BCS |
HT (cm) |
Age (yrs.) |
BWT (kg) |
HC (cm) |
BL (cm) |
LM (cm) |
|
N |
52.61a ± 2.05 |
3.36a ± 0.95 |
20.00a ± 1.27 |
36.29a ± 1.07 |
64.59a ± 4.18 |
14.88a ± 1.06 |
|
T |
49.60a ± 1.53 |
4.06a ± 0.73 |
11.00b ± 0.28 |
34.60a ± 0.61 |
59.02a ± 2.31 |
12.99a ± 0.52 |
|
Male |
||||||
|
BCS |
HT (cm) |
Age (yrs.) |
BWT (kg) |
HC (cm) |
BL (cm) |
LM (cm) |
|
N |
57.99a ± 2.07 |
2.75a ± 1.46 |
21.83b ± 0.54 |
38.10a ± 1.11 |
69.85a ± 3.13 |
15.88a ± 0.81 |
|
T |
48.13b ± 1.13 |
4.65a ± 0.80 |
10.65c ± 0.29 |
33.46b ± 0.61 |
51.94b ± 1.71 |
12.89b ± 0.44 |
|
OB |
60.96ab ± 5.07 |
3.50a ± 0.75 |
38.00a ± 1.31 |
38.10ab ± 2.73 |
73.66a ± 7.66 |
19.05a ± 1.98 |
All values are expressed as mean ±SE; a, b, c: Significantly different at p < 0.05; For abbreviations see Table 1
Table 4: Morphometric measurements of Female and Male Dogs with Black and White Coat Colours and different Body Condition Scores
|
Female |
||||||
|
BCS |
HT (cm) |
Age (yrs.) |
BWT (kg) |
HC (cm) |
BL (cm) |
LM (cm) |
|
N |
55.88a ± 2.88 |
2.50a ± 0.50 |
20.00a ± 4.05 |
38.10a ± 2.07 |
71.12a ± 7.89 |
15.24a ± 4.89 |
|
T |
53.34a ± 2.54 |
5.00a ± 3.00 |
11.00b ± 2.00 |
34.29a ± 1.27 |
62.23a ± 6.35 |
20.32a ± 5.08 |
|
Male |
||||||
|
BCS |
HT (cm) |
Age (yrs.) |
BWT (kg) |
HC (cm) |
BL (cm) |
LM (cm) |
|
N |
53.76a ± 2.55 |
2.25a ± 0.99 |
20.33a ± 0.49 |
36.83a ± 1.00 |
66.89a ± 4.09 |
14.11a ± 0.96 |
|
T |
48.99a ± 2.36 |
4.86a ± 0.92 |
10.86b ± 0.46 |
33.38b ± 0.93 |
56.11a ± 3.78 |
12.16a ± 0.89 |
All values are expressed as mean ±SE; a, b: Significantly different at p < 0.05; For abbreviations see Table 1
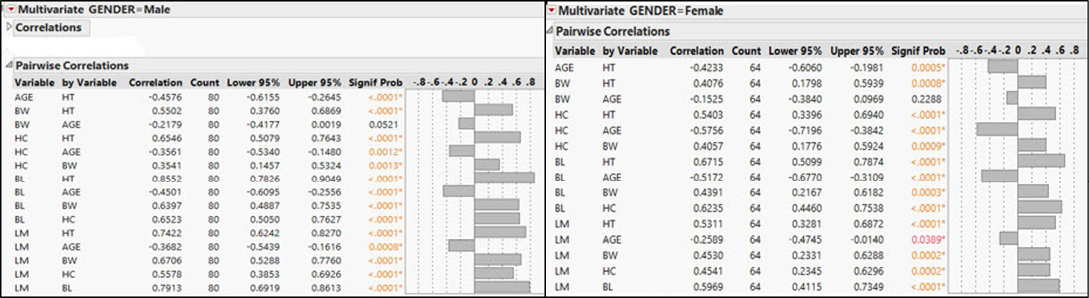
Figure 2: Pairwise correlation between the zoometric measurements in male and female dogs in Maiduguri
Table 3 shows the morphometric measurements of female dogs with brown and white coat colors and different Body Condition Scores. There were no significant differences between female dogs with brown and white coat colors that had ideal (normal) body condition scores and those with thin BCS in terms of all the morphometric measurements (P = 0.2815). The morphometric measurements of male dogs with brown and white coat colors and different Body Condition Scores showed significant differences between male dogs with brown and white coat colors, presenting ideal (normal) body condition scores, obese BCS and those with thin BCS in terms of height at withers, body weight, head circumference, body length and length of muzzle (P = 0.0005).
Table 4 shows the morphometric measurements of female dogs with black and white coat colors and different Body Condition Scores. There were no significant differences between female dogs with black and white coat colors that had ideal (normal) body condition scores and those with thin BCS in terms of all the morphometric measurements (P = 0.6667). The morphometric measurements of male dogs with black and white coat colors and different Body Condition Scores showed significant differences between male dogs with black and white coat colors that had ideal (normal) body condition scores and those with thin BCS in terms of body weights and head circumference (P = 0.0001).
Figure 2 shows pairwise correlations between the zoometric measurements in male and female Nigerian indigenous dogs. There were significant (P < 0.0001) strong positive correlations between HC and HT, BL and HT, BL and BW, BL and HC, LM and HT, LM and BW, LM and HC, LM and BL. Furthermore, there were significant (P < 0.0001) weak negative correlations between age and HT, HC and age, BL and age, LM and age, except BW and age which is not significant (P = 0.0521). The pairwise correlations between the zoometric measurements in female Nigerian indigenous dogs. There were significant (P < 0.0001) strong positive correlations between HC and HT, BL and HT, BL and HC, LM and HT, LM and BW, LM and HC, LM and BL. Additionally, there were significant (P < 0.0001) weak positive correlations between BL and BW, HC and BW, BW and HT. Furthermore, there were significant (P < 0.0001) weak negative correlations between age and HT, HC and age, BL and age, LM and age, except BW and age which is not significant (P = 0.2288).

Figure 3: Pairwise correlation between the zoometric measurements in Nigerian indigenous dogs with ideal, obese and thin BCS
Figure 3 shows the pairwise correlations between the zoometric measurements in Nigerian indigenous dogs with ideal (N), obese (OB) and thin (T) body condition scores (BCS). In those with N body condition scores, there were significant (P < 0.0001) strong positive correlations between BW and HT, HC and HT, HC and BW, BL and HT, BL and BW, BL and HC, LM and HT, LM and BW, LM and BL. Furthermore, there were weak negative correlations and not significant between age and HT (P = 0.4290), BW and age (P = 0.3607), HC and age (P = 0.0651), BL and age (P = 0.3176), except LM and age that was weak negatively correlated and not significant (P = 0.8508). The pairwise correlations between the zoometric measurements in Nigerian indigenous dogs with obese BCS. In the dogs with obese BCS, there was a perfect positive and significant (P < 0.0001) correlations between body length and head circumference. Furthermore, the Pairwise correlations between the zoometric measurements in Nigerian indigenous dogs with thin BCS, there were strong positive and significant (P < 0.0001) correlations between BL and HT, BL and HC, LM and HT, LM and BL. Furthermore, there were moderate positive and negative significant (P < 0.0001) correlations between LM and HC, age and HT respectively. There were moderate and weak negative significant (P < 0.0001) correlations between HC and age, LM and age, respectively. Moreso, there were weak negative and not significant correlations between BW and HT (P = 0.2445), HC and BW (P = 0.2619), BL and BW (P = 0.6076), LM and BW (P = 0.4079), BW and age (P = 0.7094) amongst the dogs with thin BCS.
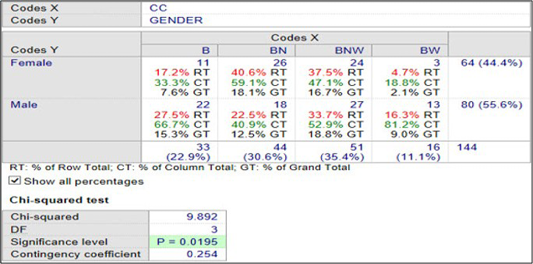
Figure 4 shows the association between gender and coat colors in Nigerian indigenous dogs in Maiduguri. The association between gender and coat colors of the dogs in Maiduguri is strong and significant. In a population of 33 (22.9%) black (B) dogs in Maiduguri, 22 (66.7%) of the male dogs were B compared with 11 (33.3%) of the female dogs that were B. In a population of 44 (30.6%) brown (BN) dogs in Maiduguri, 18 (40.9%) of the male dogs were BN compared with 26 (59.1%) of the female dogs that were BN. Furthermore, in a population of 51 (35.4%) of brown, white (BNW) dogs in Maiduguri, 27 (52.9%) of the male dogs were BNW compared with 24 (47.1%) of the female dogs that were BNW. Additionally, in a population of 16 (11.1%) of black, white (BW) dogs in Maiduguri, 13 (81.2%) of male dogs were BW while 3 (18.8%) of the female dogs were BW. The female population of dogs in Maiduguri 64 (44.4%), 11 (17.2 %) were B compared with 26 (40.6%) BN, 24 (37.5%) BNW and 3 (4.7%) BW.
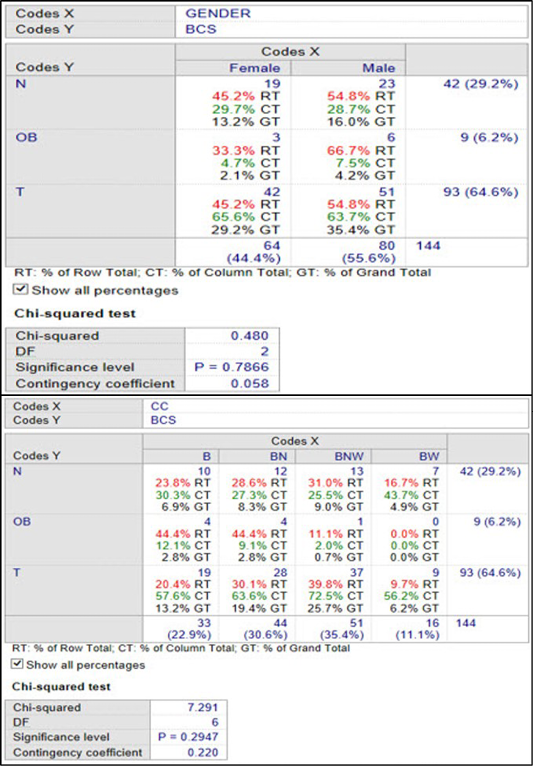
Figure 5: Association between gender, coat colour and body condition scores in Nigerian indigenous dogs in Maiduguri
Figure 5 shows the association between genders, coat color and body condition scores in Nigerian indigenous dogs in Maiduguri. The association between gender and body condition scores of dogs in Maiduguri is weak and not significant. With a population of 42 (29.2%) normal dogs in Maiduguri, 23 (54.8%) of the male dogs were normal compared with 19 (45.2%) of the female dogs. With a population of 9 (6.2%) obese dogs in Maiduguri, 6 (66.7%) of the male dogs were obese compared with 3 (33.3%) of the female dogs. Furthermore, in a population of 93 (64.6%) thin dogs in Maiduguri, 51 (54.8%) of the male dogs were thin compared with 42 (45.2%) of the female dogs. In the female population of dogs in Maiduguri 64 (44.4%), 42 (65.6 %) were thin compared with 19 (29.7%) and 3 (4.7%) that were normal and obese respectively. In the male population of dogs in Maiduguri 80 (55.6%), 51 (63.7%) were thin compared with 23 (28.7%) and 6 (7.5%) that were normal and obese respectively. The association between body condition scores and coat colors of the dogs in Maiduguri is strong and not significant. In a population of 42 (29.2%) ideal (N) dogs, the black (B) dogs in Maiduguri were 10 (23.8%) compared with 12 (26.8 %) that were brown (BN), 13 (31.0%) that were brown/white (BNW) and 7 (16.7%) were black/white (BW). Amongst the obese dogs 9 (6.2%), 4 (44.4%) were B, 4 (44.4%) were BN, 1 (11.1%) was BNW and 0 (0.0%) none was BW. 93 (64.6%) made up the population of thin dogs in the study area. 19 (20.4%) were B, 28 (30.1%) were BN, 37 (39.8%) were BNW and 9 (9.7%) were BW, respectively.
Discussion
The present study evaluated some morphometric features, BCS and coat colors of the Nigerian indigenous dogs. Zoometric measurements generally divulge inherent phenotypic and genetic physiognomies of species and breeds of animals, which also expounds on the aesthetic value and endurance capabilities of these animals globally particularly the canine species.
The relative average body weight of the male dogs was slightly higher than that of the female although not significant. Derek et al. (1994) reported that physical differences between male and female dogs are not quite explicit, however, a male of the breed tends to be physically larger and heavier than the female this simulates the current findings with the Nigerian indigenous dogs. Other report has also shown that sex differences in weight exists between animal species, with male dogs tending to be slightly heavier than the female at least within a single breed (Meara, 1974; Losey et al., 2014). This corroborates the present findings with the Nigerian indigenous dogs. The body weight is an important trait used in evaluating body condition and health status (Erat and Arikan, 2010). However, our findings are similar to results from a previous study that evaluated the body condition of show dogs, where 19 percent of dogs were overweight (Corbee, 2013; Such and German, 2015). The body weight also provides a rough measure of total body energy stores and changes in weight reflect the energy and protein balance (Richard et al., 2009). Furthermore, relatively slight differences were also observed in some of the dimensional measurements between the males and females however, these differences are not significant. In the present study, dogs that were characterized as ideal weight, the dog owners could be advised concerning the prominence of their dogs. Furthermore, owners of obese or overweight dogs could also be advised to pursue veterinary care. This option was also adopted by a study conducted by Poppy et al. (2016).
The female Nigerian indigenous dogs appeared slightly longer than the males, though the difference was not significant, however, the findings of the present study agree with that of Nathan et al. (2008) but, does not conform to the American kennel club standard (AKC, 1998). The Nigerian indigenous dogs appeared in several different coat colors and patterns. Some of the dogs have distinct colors while others appeared in combination of colors. This could probably be due to uncontrolled breeding (Lipinski et al., 2008) as these dogs move about freely and thereby mating indiscriminately. A higher percentage of the Nigerian indigenous dogs were classified as thin based on their BCS. All these dogs were apparently healthy during the course of the study, however, they’re being thin /underweight may probably be due to inadequate nutrition in terms of quantity and quality. Also the feeding routine is very inadequate as most dogs in households go without food if there are no leftovers. It has been stated that the BCS is in essence a contrivance that appraises nutritional condition, amount of fats and health status (Laflamme, 1997; Richard et al., 2009) which is in consonance with the current finding. However, German et al. (2006) stated that being underweight has its attendant consequences of morbidities. Only a few proportion of the Nigerian indigenous dogs were classified as obese. These dogs were fed ad libitum by the pet owners. When dogs are fed ad libitum, it may prompt them to overeat. Kienzle et al. (1998) associated obesity in dogs to the number of meals and snacks fed which agrees with the current study.
However, this study does not coincide with the report of McGreevy et al. (2005) which stated that 22-40% of the pet dog population around the world are obese. In the current study, only 6.2% of Nigerian indigenous dogs were obese. Nevertheless, with regular exercise and diet restriction by dog owners, vulnerability to obesity differs between dog breeds, which proposes the effect of genetic factors (Raffan et al., 2016). Also, dietary factors have been attributed to the development of obesity in small animals. However, the significance of obesity pertains to its role in the pathogenesis of diseases and its ability to exacerbate preexisting disease and decrease lifespan (German et al., 2006; Richard et al., 2009). A fair proportion of the Nigerian indigenous dogs had an ideal body weight. Keally et al. (2002) reported that dogs that were lean throughout their life lived 2 years longer than their litter mates that were overweight and did not need treatment for co-morbidities like osteoarthritis until later in life. The importance of the score system used in this study is its simplicity and affordability which can assist clinicians and pet owners to estimate the body compositions of their pets. In contrast, dual energy X-ray Absorptiometry (DEXA) and Computed tomography are excellent gizmos, but, very exorbitant for most dog owners to pay for such services, only a few individuals can afford the services especially in the study area.
The pairwise correlations for the measured traits of the male and female Nigerian indigenous dogs are quite similar and the results were in accordance with the report of Pendergrass et al. (1983) and Thuller et al. (2015) for mongrels dogs. All our dogs are of the same genetic source and this could possibly explain the similarities. The morphometric traits that were significantly correlated means whenever a selection is done for one of these physiognomies they will definitely influence improvement of the other physiognomies. The result of this study also showed that the morphometric traits are better determinants of weight, whereas age was not a determinant of weight for both the males and the females. For those dogs with ideal BCS a weak positive correlation was observed between length of muzzle and age, which was not significant which means age may be a determinant of length of muzzle. Snout length has been found to vary considerable among breeds (Udell et al., 2014).
In the obese dogs, a perfect positive correlation between head circumference and body length was observed. Morphometric traits are frequently interrelated with one another (Chase et al., 2002). The head circumference is similarly a determinant for body length. In the thin dogs the correlation between the zoometrics measurements were strong and positive which may be due to body conformation and less fats deposits possibly due to malnutrition as these dogs were not adequately fed. The association between gender and body condition score of the Nigerian indigenous dogs was weak and not significant which suggests a weak association between fat accumulation and conformational change. However, the association between BCS and coat color was strong, although not significant which may be attributed to the genetic makeup of the dogs and probably due to their indiscriminate mating behaviour. These conform to the findings of Lipinski et al. (2008). Correspondingly, Juliette, (2004) and Schmutz and Berryere (2007) found variations in coat types, colors and markings in dog breeds. These dogs were found to be mostly black, and this observation was consistent with the results of (Juliette, 2004; Schmutz and Berryere, 2007). In the present study, there was an observed significant association between the zoometric measurements of the female dogs whereas in the male dogs a significant and moderate inverse relationship was observed in their phenotypic variables which was similar to the report of Perdergrass et al. (1983).
The dogs have variations in size and body type than most species of domestic animals (Moody et al., 2006) and these could probably be attributed to the differences in the phenotypic variables of these dogs and possibly to their geographic locations. Similarly, smaller range of body sizes has been observed in the village non-breed dogs. Also a weak inverse not significant relationship was observed between the phenotypic measurements in the dogs with the ideal BCS whereas in the obese dog a perfect and significant relation between body length and head circumference was observed. These morphological similarities may be due to their uniform sizes and probably due to the genetic composition, diet restriction and regular exercise. These findings agree with the work of Raffan et al. (2016). In the thin Nigerian indigenous dogs a significant strong association was observed between their phenotypic variables this may be associated with their less body fat and possibly genetic composition.
Conclusion
In conclusion, this study has provided some of the basic morphometric features and BCS of the Nigerian indigenous dogs. The present findings may assist both owners and clinicians to assess the BCS of the Nigerian indigenous dogs and also improve on their management. Dog breeders can also explore some of the morphometric features to selectively breed these dogs. Further in-depth studies should be carried out in order to standardize the morphological characteristics of these dogs.
Acknowledgement
The authors appreciate the immense contribution of Ashe Abdullahi Abdulrahman for proofreading the manuscript. We also appreciate the dog owners for allowing us access to their pets and the assistants for restraining the dogs.
Conflict of interest
The authors declare no conflict of interest.
Authors’ contributions
The idea for the paper was conceived by Yachilla M. Bukar-Kolo; the study was designed by Yachilla M. Bukar-Kolo and Lawan Adamu; the experiments were performed by Muhammad Mustapha, Musa Zakariah and Abel Allo; the data were analyzed by Lawan Adamu and Yachilla M. Bukar-Kolo; the paper was written by Yachilla M. Bukar-Kolo and Lawan Adamu with the inputs of all the authors mentioned above.
References


