Research Journal for Veterinary Practitioners
Research Article

Effect of Renoprotective Amino Acids and a Dipeptide on Disease Progression, Nutritional Status, and Blood-Serum Phosphate Concentration in Cats with Chronic Kidney Disease
James D. Archer*
Applied Research Laboratory-Veterinary Studies Project, Villa Pompeii Campus, 4848 Olive Hill Road (28 Rolling View), Fallbrook, CA 92028, USA.
Abstract | Low-protein, low-phosphorus therapeutic diets (TDs) are often recommended for cats (Felis catus) with chronic kidney disease (CKD) in an attempt to slow disease progression. Studies in humans with CKD reveal that dietary supplementation with certain amino acids slows or prevents time-related increases in blood-serum creatinine concentration (SCr) and phosphate concentration (PHOS). The objectives of this study were to assess the influence of a renoprotective amino acid and a dipeptide complex (AB070597) on disease progression, PHOS, and protein oxidation/nitrogen-balance in non-protein, non-phosphorus-restricted diet cats with CKD. The treatment group included 67 privately-owned domestic cats with SCr and clinical signs consistent with CKD. A retrospective control group included 57 non-AB070597-treated CKD cats. Cats in the treatment group received 300-mg oral bi-daily doses of AB070597 for up to 104 weeks. SCr and PHOS were measured at approximate 12-week intervals.Treated cats experienced significantly reduced SCr (mg/dL) from baseline during all observation periods (P≤0.004), except week 12 (P=0.054). The overall least squares mean (LS-mean) difference between treatment and control groups was –0.5 (P<0.001). When International Renal Interest Society (IRIS) disease stage was expressed as LS-means change-from-baseline, treatment values were negative, whereas control values were positive, indicating a decline in stage for treatment and an increase for controls. The overall difference at 104 weeks for treatment was –0.4 (P<0.001). Treatment group mean and median PHOS (mg/dL) declined from baseline -1.3 (P < 0.002) and -0.2 (P <0.002), respectively, at 104 weeks, whereas control group mean and median values increased 0.14 (P<0.004) and 0.3 (P<0.002), respectively. Treatment group cats’ body weights (kg, standard deviation [SD]) remained stable: mean change (0.0, 0.75), P<0.001; while controls lost weight: mean change (-0.9, 1.07), P <0.001.Oral supplementation of renoprotective amino acids and a specific dipeptide prevented disease progression, maintained nutritional status, and preserved PHOS homeostasis in treated cats and may benefit the greater population of companion cats diagnosed with CKD.
Keywords | Cats, Chronic kidney disease, Supplement, Amino acid, Progression
Editor | Muhammad Abubakar, National Veterinary Laboratories, Islamabad, Pakistan.
Received | March 04, 2019; Accepted | March 25, 2019; Published| June 26, 2019
*Correspondence | James D Archer, Applied Research Laboratory-Veterinary Studies Project, Villa Pompeii Campus, 4848 Olive Hill Road (28 Rolling View), Fallbrook, CA 92028, USA; Email: jarcher@appliedresearchlaboratory.us
Citation | Archer JD (2019). Effect of renoprotective amino acids and a dipeptide on disease progression, nutritional status, and blood-serum phosphate concentration in cats with chronic kidney disease. Res. J. Vet. Pract. 7(2): 39-52.
DOI | http://dx.doi.org/10.17582/journal.rjvp/2019/7.2.39.52
ISSN (Online) | 2308-2798
Copyright © 2019 Archer et al. This is an open access article distributed under the Creative Commons Attribution License, which permits unrestricted use, distribution, and reproduction in any medium, provided the original work is properly cited.
INTRODUCTION
The prevalence of CKD rises with age, and approximately 5%, 7-10 years old, 10%,11-14 years old, and 30% of cats over 14 years of age develop CKD (Polzin et al., 1992). The mean age at diagnosis is 12.8 years (Boyd et al., 2008); however, cats have been diagnosed with CKD as early as 9 months and as late as 22 years (DiBartola et al., 1987). The course of the disease is variable, with some cats progressing to end-stage within months while others survive for years (Chakrabarti et al., 2012). Medical consensus considers CKD progressive and irreversible,
Table 1: IRISaCKDb Disease Stages in Cats
| Stage | Serum Creatinine | Comments | |
| mg/dL | umol/dL | ||
| Normal range | 0.6–2.2 | 53–194 | No clinical signs of renal disease. |
| At risk | <1.6 | <140 | No clinical signs of renal disease, but increased risk due to factors such as age, breed, exposure to nephrotoxins, etc. |
| 1 | <1.6 | <140 | Non-azotemic, but has at least one renal abnormality such as proteinuria, low urine specific gravity or abnormal imaging results. |
| 2 | 1.6–2.8 | 140–249 | Mild azotemia, often with mild or absent clinical signs. |
| 3 | 2.9–5.0 | 250–439 | Moderate azotemia. Extrarenal clinical signs may be present. |
| 4 | >5.0 | >440 |
Increasing risk of systemic clinical signs and uremic crises. |
aIRIS = International Renal Interest Society; bCKD = chronic kidney disease.
Source: http://www.iris-kidney.com/pdf/3_staging-of-ckd.pdf; accessed 24 May 2018.
thus treatments are supportive or palliative. Treatments may include hydration maintenance, calcium, vitamin D, erythropoietin supplementation; TDs, enteral phosphate binders, anti-hypertensive therapy, and histamine H2-receptor blockers to manage secondary gastritis.
The IRIS developed guidelines to categorize the severity of CKD (IRIS, 2016). The initial assessment is based on at least 2 measurements of fasting SCr, patient history, and the results of clinical examination. The IRIS stages are shown in Table 1.
Veterinarians often recommend TDs for cats with CKD. Restriction reduces PHOS, blood-urea nitrogen, and parathyroid hormone concentrations, and increases survival time in cats that accept the diet, when compared with cats on non-TDs (Elliot et al., 2000). Poor acceptance is common, however; with one study showing that 59.13% of cats rejected change from their former diet to TDs (Caney, 2017). TDs generally have decreased protein, phosphorus, increased carbohydrate, and variable fat content, compared with non-TDs.
A study by Salaun et al. (2017) confirmed an earlier finding by Hewson-Hughes et al. (2011) that a carbohydrate-consumption ceiling exists in cats which limits daily food intake based on daily carbohydrate intake; thereby creating deficits in protein and fat consumption, compared to their metabolic energy requirement, when fed high carbohydrate foods. Once they consumed food equivalent to 3 g carbohydrate/kg body-weight/day, they stopped eating.The carbohydrate-consumption ceiling established by Hewson-Hughes et al. was higher at 4.1 g carbohydrate/kg body-weight/day.
In a study by Bryan Kestenbaum et al. (2005) of humans with CKD, PHOS was independently and significantly related to mortality. For each 1mg/dL PHOS increase, there was a significant 23% increased risk of death (P < 0.001, 95% CI, 1.12-1.36). PHOS above the mid-range value of 3.5 mg/dL correlated with increased mortality risk, with an approximately linear relation for increased risk for each 0.5 mg/dL PHOS increase.
Cats with CKD that experience a PHOS increase of 1 mg/dL, within 1 year of diagnosis, have a 41% increased risk of progression to higher IRIS stages (Chakrabarti et al., 2012) and an 11.8% increase in the risk of death for the same increase over any time period. In a study by Boyd et al. (2008), PHOS was the only biochemical parameter that was predictive of survival.
Inorganic phosphate (Pi) absorption and reabsorption/excretion in all mammals are controlled by 3 Na+-dependent Pi cotransporter proteins (NaPiIIb, which mediates absorption in the small intestines, and NaPi-IIa and NaPiIIc, which control reabsorption/excretion in renal proximal tubules (Foster et al., 2006), so knowledge regarding PHOS homeostasis gained from studies in rodents and humans can apply to cats.
Regardless of the inciting cause, CKD evolves to progressive tubulointerstitial fibrosis accompanied by deteriorating renal function. L-carnosine, the dipeptide in AB070597, has been shown to increase bone morphogenetic protein-7 (BMP-7) gene expression in human periodontal ligament cells (Ito-Kato et al., 2004). Zeisberg et al. (2003) demonstrated that BMP-7 counteracts transforming growth factor-B1-induced epithelial-to-mesenchymal transition and reverses chronic kidney injury. Our laboratory organized an in vitro microarray experiment using human renal primary proximal tubule epithelial cells (hRPTEC) (feline cells were not available) that showed cells incubated with L-carnosine at 1.763 ug/mL increased BMP-7 messenger ribonucleic acid (mRNA) expression 2.13-fold while cells incubated with AB070597 at 3.125 ug/mL showed a 3.29-fold increase. L-carnosine blood-serum concentration in healthy cats is 10.17 ug/mL (Sabatino et al., 2013).
Studies of humans with CKD demonstrate that dietary supplementation with certain amino acids and keto-amino acids slows or prevents time-related SCr increase, disease progression, and significantly reduces PHOS in some patients (Yatzidis, 2004; Mitch et al., 1984). Further studies in humans and animals have determined that specific amino acids produce a protective effect on renal function; these include L-arginine (Reyes et al., 1994), L-aspartic acid (Tada et al., 2008), L-glutamic acid (Yatzidis, 2002), L-glutamine (Sadar et al., 2016), glycine (Yin et al., 2002), L-histidine (Watanabe et al., 2008), and the dipeptide L-carnosine (β alanyl-histidine) (Aldini et al., 2011).
AB070597 is a complex of these amino acids and dipeptide. A previous study of oral AB070597 supplementation to 27 cats with CKD showed a significant decrease in median SCr and lower median disease severity as assessed by IRIS Stage, compared with untreated controls (Archer, 2015). The objectives of this study were to assess the influence of the amino acids and dipeptide in AB070597 on disease progression, protein oxidation/nitrogen balance, and PHOS in cats with CKD fed non-protein and non-phosphorus-restricted diets.
MATERIALS AND METHODS
Cats
This study was open-ended. Qualified subjects entered as they became available from referring clinics; therefore, baseline and successive observation period (OP) times were asynchronous; thus, no relationship existed between the number of cats observed for any OP and survival or removal. Data collection extended to 104 weeks. The treatment group consisted of 67 privately-owned domestic cats that ranged in age from 4 to 21 years (median=14 years) and weighed 4.12 (1.2) kg. Cats were neutered males (33, 49.3%) and spayed females (34, 50.7%). Breeds represented were Domestic Short Hair (51, 76.1%), Domestic Medium Hair (6, 9.0%), Domestic Long Hair (6, 9.0%), and Exotic (4, 6.0%).Treatment group cats included 27 (40.3%) in Stage 2, 26 (38.8%) in Stage 3, and 14 (20.9%) in Stage 4. Owners provided informed consent before enrollment. Cats remained under the care of their owners and received standard care throughout the study, which exceeded requirements defined in United States Congressional Public Law 89-544 (Animal Welfare Act of 1966), including flea and tick prophylaxis, subcutaneous fluids, and antibiotics as prescribed by their supervising veterinarians. All cats had been fed commercial non-TDs before the study and continued their original diets so protein and phosphorus would not be restricted, which would have lowered amino acid and phosphorus intake from pre-study baseline values; as well as created a daily metabolic energy deficiency in some animals because of the carbohydrate-consumption ceiling. From within the United States, 46.7% and 73.3% of wet TDs (N=15; Salaun ceiling and Hewson-Hughes ceiling, respectively) and 100% and 100% of dry TDs, (N=9; Salaun ceiling and Hewson-Hughes ceiling, respectively) contain carbohydrate percentages that limit protein and fat intake, thus creating metabolic energy requirement deficiencies (Archer, unpublished work). Owners were instructed to notify Applied Research Laboratory of any diet change and were polled monthly for compliance verification. Cats were eligible for enrollment if serial SCr was persistently ≥2.3 mg/dL (or if serial SCr was<2.3 mg/dL but incrementally increased over time and was≥ 2.3 mg/dL at inclusion), and if history of clinical signs was consistent with CKD (e.g., chronic polyuria, polydipsia, or small kidneys on abdominal palpation). Cats with suspected or verified disease, including diabetes mellitus, neoplasia, bacterial pyelonephritis, systemic hypertension, uncontrolled hyperthyroidism, acute renal failure, or other comorbidities unrelated to CKD were excluded. Complete blood count, blood chemistry, and weight profiles were determined before or at enrollment to establish SCr, PHOS, and weight baselines.
A retrospective control group of 57 non-treated CKD cats, that ranged in age from 3 to 20 years (median = 13 years) and weighed 4.1 (1.6) kg, was selected from medical records at 5 participating clinics (A, B, C, D, E.). Cats and their respective IRIS stages were distributed at clinics as follows:
A = 20 stage 2, 4 stage 4
B = 7 stage 2, 4 stage 3, 2 stage 4
C = 6 stage 2, 4 stage 3
D = 2 stage 2, 1 stage 4
E = 4 stage 2, 3 stage 3
Control cats were neutered males (23, 40.4%), spayed females (18, 31.6%), intact males (10, 17.5%), and intact females (6, 10.5%). Breeds represented were Domestic Short Hair (43, 75.4%), Domestic Medium Hair (1, 1.8%), Domestic Long Hair (2, 3.5%), and Exotic (11, 19.3%). Control group cats included 39 (68.4 %) in Stage 2, 11 (19.3%) in Stage 3, and 7 (12.3%) in Stage 4.
Supplement
Amino acids and dipeptide were purchased from Nutriland Group, Inc. (Paramount, California, USA) and Dongyu USI (Irvine, California, USA), respectively. Each 300-mg dose included 25 mg L-arginine, 50 mg glycine, 50 mg L-glutamine, 25 mg L-histidine, 50 mg L-aspartic acid, 50 mg L-glutamic acid, and 50 mg L-carnosine. Cats were dosed twice daily. Each dose was mixed with 1.5 mL of water and was given by syringe directly into the subject’s mouth or sprinkled on a small amount of food.
Body Weight
Body weights were recorded at entrance, at the last clinic visit, and at various times between. Control group cats’ body weights were taken from their respective medical records.
Table 2A: Data-Recording Example
| Entry Points (days) | 0 | 1 | 2 | 3 | >>>>>>644 (92 weeks) | ||||||
| Animal | |||||||||||
| 1 |
SCra or PHOSb (mg/dL) |
n.n | n.n | n.n | n.n | n.n | n.n | n.n | n.n | n.n | |
| 2 | " | n.n | n.n | n.n | n.n | ||||||
| 3 | " | n.n | n.n | n.n | n.n | n.n | n.n | ||||
| 4 | " | n.n | n.n | n.n | n.n | n.n | n.n | n.n | n.n | n.n | |
|
5 |
" | n.n | n.n | n.n | n.n | n.n | n.n | n.n | n.n | ||
| 6 | " | n.n | n.n | n.n | n.n | n.n | n.n | n.n | n.n | n.n | |
| 7 | " | n.n | n.n | n.n | n.n | n.n | |||||
| 8 | " | n.n | n.n | n.n | n.n | n.n | n.n | n.n | n.n | ||
| 9 | " | n.n | n.n | n.n | n.n | n.n | n.n | n.n | n.n | n.n | n.n |
| 10 | " | n.n | n.n | n.n | n.n | n.n | n.n | n.n | n.n | ||
| 11 | " | n.n | n.n | n.n | n.n | n.n | n.n | n.n | n.n | ||
| 12 | " | n.n | n.n | n.n | n.n | n.n | n.n | n.n | n.n | n.n | n.n |
| 13 | " | n.n | n.n | n.n | n.n | n.n | n.n | n.n | n.n | n.n | |
| N…67 | |||||||||||
| Entry points for each animal (Table 2A) were translated to Synchronized-Baseline Cohorts (Table 2 B). | |||||||||||
aSCr = blood-serum creatinine concentration; bPHOS = blood-serum phosphate concentration.
Table 2B: Translation to Synchronized-Baseline Cohorts
| Observation Period (weeks) | 0 | 12 | 24 | 36 | 48 | 60 | 72 | 84 | 96 | 104 | |
| Animal | |||||||||||
| 1 |
SCra or PHOSb (mg/dL) |
n.n | n.n | n.n | n.n | n.n | n.n | n.n | n.n | n.n | n.n |
| 2 | " | n.n | n.n | n.n |
n.n |
||||||
| 3 | " | n.n | n.n | n.n | n.n | n.n | n.n | n.n | n.n | ||
| 4 | " | n.n | n.n | n.n | n.n | n.n | n.n | n.n | n.n | n.n | n.n |
| 5 | " | n.n | n.n | n.n | n.n | n.n | n.n | n.n | n.n | ||
| 6 | " | n.n | n.n | n.n | n.n | n.n | n.n | n.n | n.n | n.n | |
| 7 | " | n.n | n.n | n.n | n.n | n.n | |||||
| 8 | " | n.n | n.n | n.n | n.n | n.n | n.n | n.n | n.n | ||
| 9 | " | n.n | n.n | n.n | n.n | n.n | n.n | n.n | n.n | n.n | n.n |
| 10 | " | n.n | n.n | n.n | n.n | n.n | n.n | n.n | n.n | n.n | n.n |
| 11 | " | n.n | n.n | n.n | n.n | n.n | n.n | n.n | n.n | ||
| 12 | " | n.n | n.n | n.n | n.n | n.n | n.n | n.n | n.n | n.n | n.n |
| 13 | " | n.n | n.n | n.n | n.n | n.n | n.n | n.n | n.n | n.n | n.n |
| N…67 | |||||||||||
| Example Population | 13 | 13 | 13 | 13 | 12 | 11 | 11 | 11 | 7 | 6 | |
|
Treatment Popc |
67 | 67 | 59 | 51 | 45 | 39 | 32 | 31 | 23 |
18 |
|
aSCr = blood-serum creatinine concentration; bPHOS = blood-serum phosphate concentration; cPop = Population.
Blood Sample Collection
A blood sample (2.0-3.0 mL) was collected from the jugular or saphenous vein at each regularly-scheduled clinic visit and placed into a serum-separator tube. The whole blood sample was allowed to clot at room temperature and then centrifuged. Serum was separated and dispensed into a labelled transport tube. Each sample was sent to a local veterinary diagnostic reference laboratory (Antech Diagnostics, Headquarters, Irvine, California, USA or Idexx Laboratories, Headquarters, Westbrook, Maine, USA) for SCr and PHOS analysis.
Laboratory Measurements
SCr and PHOS were measured approximately every 12 weeks, up to 104 weeks or death, whichever occurred first. Measurements were performed at Idexx or Antech laboratories using an Olympus AU2700 Chemistry Analyzer and Beckman-Coulter AU5431 Chemistry Analyzer, respectively.
SCr and PHOS coefficients of variation (CV), as determined by Idexx Laboratories, were 3.33%, 1.88% and 3.51%, 3.08% (low end, high end of normal range), respectively; and less than 3% for within-run samples at Antech Diagnostics, with a total precision of less than 5%.
Control group SCr and PHOS analyses were also performed by Antech Diagnostics and Idexx Laboratories, except for 1 clinic that used in-house instrumentation supplied by Antech Diagnostics. Some laboratory reports were more than 4 years old, so the CV of the instrumentation used then is not known.
BMP-7 mRNA Expression and hRPTEC Viability Assays
BMP-7 mRNA expression and hRPTEC viability assays for L-carnosine and AB070597 were performed by Cyprotex US, LLC, Watertown, MA 02472, USA. hRPTEC (Catalog #: CC-2553) and Renal Epithelial Cell BulletKit™ (Catalog #: CC-3190) were purchased from Lonza Walkersville, Inc., Walkersville, Maryland 21793, USA.
BMP-7 mRNA Expression Assay
Cells were cultured at 37°C, 5% CO2 in renal epithelial cell growth medium, and passaged to 2 96-well plates with a density of 4000 cells/well. After 24 h culture, varying concentrations of L-carnosine and AB070597 were added to each well and incubated for 6 days. Total RNA was extracted from hRPTEC using MagMax™-96 Total RNA Isolation Kit (ThermoFisher Scientific, Waltham, MA, USA). Complementary deoxyribonucleic acid (cDNA) was synthesized from total RNA with High Capacity RNA-to-cDNA Kits and a Veriti thermal cycler (ThermoFisher, Waltham, MA, USA). Real-time-quantitative PCR (RT-qPCR) was performed in Applied Biosystems Real-Time Quantitative polymerase chain reaction system (Thermo Fisher, Waltham, MA, USA). Expression of BMP-7 mRNA in treated cells was determined by RT-qPCR and compared with reference vehicle treated hRPTEC. Peptidylproprolyl isomerase-A was used as an internal control.
hRPTEC Viability Assay
hRPTEC were plated on 384-well tissue culture treated polystyrene plates at 1.5 x 10^4 cells. After overnight incubation at 37°C, cells were dosed with AB070597 in a range of concentrations and incubated for 72 h at 37°C. Cell viability was measured using the Promega Cell Titer 96 Non-Radioactive Cell Proliferation Assay (MTT) kit (Promega Corporation, Madison, WI, USA) by adding dye solution to each well and incubating for 3 h at 37°C. After incubation, Promega Solubilization Solution/Stop Mix was added to each well. Plates were incubated at 37°C for 1 h and mixed on a plate shaker for 10 minutes. Spectrophotometric absorbance was read at 370 nm. The IC50 was calculated using GraphPadPrism (GraphPad Software, San Diego, CA, USA).
Statistical Analysis
Baseline (time 0) was the moment each cat entered the study. SCr and PHOS measurements were assembled into synchronized-baseline OP cohorts to adjust for asynchronous baseline entry dates, with the result that earlier OP cohorts included more cats than later cohorts, as shown in Table 2. Table 3 shows the number of treatment and control cats, versus length (OPs) of observation.
Table 3: Number of Cats vs. Time Observed*
| Number of Cats | ||
| OP (weeks) | Control Cats Observed | Treatment Cats Observed |
| 0 Baseline | 57 | 67 |
| 12 | 57 | 67 |
| 24 | 57 | 59 |
| 36 | 53 | 51 |
| 48 | 51 | 45 |
| 60 | 39 | 39 |
| 72 | 34 | 32 |
| 84 | 31 | 31 |
| 96 | 24 | 23 |
| 104 | 19 |
18 |
*Declining numbers at increasing observation periods do not correlate with removal or survival but result from an open-ended study design with asynchronous entry dates.
IRIS Stage data were analyzed by converting SCr measurements to disease stages: Stage 1 (SCr< 1.6 mg/dL), Stage 2 (SCr, 1.6–2.8 mg/dL), Stage 3 (SCr, 2.9–5.0 mg/dL) and Stage 4 (SCr> 5.0 mg/dL).
Data for SCr and IRIS stage were analyzed using the same method. For each endpoint, the change-from-baseline value was calculated for each OP as Week N–Week 0. Descriptive statistics were calculated by treatment and OP for each endpoint and for the change-from- baseline values for each endpoint. For each endpoint, the change-from-baseline values were modeled using a repeated measure analysis of covariance model, with an autoregressive first-order covariance structure. The following covariates were evaluated for inclusion in the repeated measures model: study (secondary-analysis data, included in Archer (2015), versus data from the current study), age, baseline value, gender, sterilized (spayed or neutered versus intact), and breed. The fixed effects for treatment, time, and treatment by time interaction were included in the model. LS-means for treatment and control SCr and IRIS stage change-from-baseline, for each OP, along with the 95% confidence intervals (CI) for the LS-means, were calculated. The same statistics for overall treatment over 104 weeks were calculated. In addition, the differences in LS-means between treatment and control for each OP and over the entire 104-week treatment period were determined, along with the corresponding 95% CIs and P-values for the differences. In addition, the counts and percentages for each IRIS stage for each OP were calculated for treatment and control groups. The P-value from the Cochran-Mantel-Haenszel (CMH) statistic, testing the alternative hypothesis that there was a linear association between treatment and stage, was calculated by OP. Normality assumptions were evaluated for each endpoint and, if the assumptions appeared violated, a sensitivity analysis was conducted using a ranked analysis of variance model like the original model used. The difference between these two models was that the change-from-baseline was ranked within OP and then the model was fit on these ranked values. A two-sided, 2-sample t-test,with Satterthwaite approximation for unequal variances, was employed to compare the change-from-baseline body weights between treatment and controls.Treatment and control PHOS change-from-baseline were analyzed with the Wilcoxon Signed Rank Test. Statistical power for SCr LS-means change-from-baseline and IRIS LS-means stage change-from baseline at each OP was calculated from control and treatment means, sampling ratio, and pooled standard error of mean (SEM). Analyses were conducted using SAS Institute, Inc. 9.4 analytics software (SAS Institute Inc., Cary, NC, USA) at significance level 0.05. AB070597 and L-carnosine induced BMP-7 mRNA fold-change in hRPTEC cells were analyzed with Applied Biosystems, QuantStudio Real-Time PCR Software (ThermoFisher Scientific, Waltham MA, USA).
RESULTS
Results are reported as mean (SD); LS-mean (SEM); median (minimum, maximum).
SCr
Mean SCr was 4.2 (2.66) mg/dL at week 0 for treatment cats, and 2.9 (0.89) mg/dL for control cats. Mean SCr was lower in the treatment group, when compared with controls, at all OP, from week 12 to week 104. Values are plotted in Figure 1 and Table 4. Treated cats exhibited significantly reduced SCr from baseline at all OP (P <0.001 at 7 OP, P <0.004 at 1 OP), except for week 12 (P=0.054). The overall difference at week 104, between treatment group and controls, was –0.5 (CI: –0.8, –0.2; P <0.001). There were some OPs where underlying normality assumptions may have been violated so a sensitivity analysis was performed on the ranked data. There was a significant difference for ranked data at all OPs including week 12. Thus, the data suggest that treatment significantly lowered SCr as compared with no treatment. The SCr LS-mean change-from-baseline over time is shown in Figure 2 and Table 5.
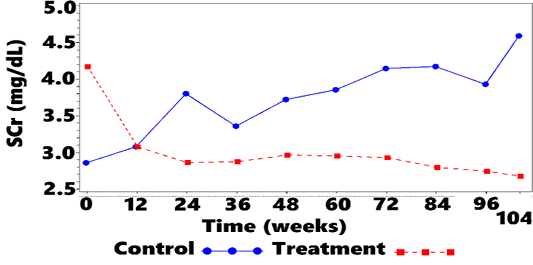
Figure 1: Mean SCra vs. Time
aSCr = blood-serum creatinine concentration.
| OP (weeks) |
SCr (mg/dL) mean (SDb) |
||
| Control | Treatment | n-Treatment/Control | |
| 0 | 2.9 (0.89) | 4.2 (2.66) | 67/57 |
| 12 | 3.1 (0.93) | 3.1 (1.31) | 67/57 |
| 24 | 3.8 (3.61) | 2.9 (0.97) | 59/57 |
| 36 | 3.4 (1.14) | 2.9 (0.91) | 51/53 |
| 48 | 3.7 (1.63) | 3.0 (0.92) | 45/51 |
| 60 | 3.9 (1.97) | 3.0 (0.95) | 39/39 |
| 72 | 4.1 (2.58) | 2.9 (0.98) | 32/34 |
| 84 | 4.2 (2.86) | 2.8 (0.97) | 31/31 |
| 96 | 3.9 (2.06) | 2.7 (0.87) | 23/24 |
| 104 | 4.6 (2.67) | 2.7 (0.97) |
18/19 |
a SCr = blood-serum creatinine concentration; bSD = standard deviation
OPs and IRIS Distribution
Mean IRIS Stage for treated cats was 2.8 (0.76) and 2.3 (0.68) at weeks 0 and 104, respectively (Figure 3). Stage 2, 3, and 4 cats were observed for 75 (32), 65 (34), and 39 (33) weeks, respectively (data not shown).
Table 5: SCra LS-Meanb Change-from-Baseline vs. Time
| OP (weeks) |
LS-Mean (SEMc) |
P | n-Treatment/ Control | Statistical Power (%) | |
| Control | Treatment | ||||
| 0 | 67/57 | ||||
| 12 | 0.0 (0.21) | –0.5 (0.20) | 0.054 | 67/57 | 40.2 |
| 24 | 0.7 (0.21) | –0.6 (0.21) | < 0.001 | 59/57 | >99 |
| 36 | 0.4 (0.22) | –0.5 (0.22) | 0.004 | 51/53 | 81.8 |
| 48 | 0.7 (0.22) | –0.4 (0.23) | < 0.001 | 45/51 | 92.8 |
| 60 | 0.9 (0.25) | –0.4 (0.25) | < 0.001 | 39/39 | 95.3 |
| 72 | 1.2 (0.27) | –0.4 (0.28) | < 0.001 | 32/34 | 98.2 |
| 84 | 1.2 (0.28) | –0.5 (0.28) | < 0.001 | 31/31 | 98.8 |
| 96 | 1.2 (0.32) | –0.5 (0.32) | < 0.001 | 23/24 | 95.7 |
| 104 | 1.7 (0.36) | –0.6 (0.38) | < 0.001 | 18/19 |
98.3 |
aSCr = blood-serum creatinine concentration; bLS-Mean = least squares mean; cSEM = standard error of mean.
Mean IRIS Stage for controls was 2.3 (0.57) and 2.9 (0.88) at weeks 0 and 104, respectively (Figure 3). Stage 2, 3, and 4 cats were observed for 80 (27), 66 (28), and 65 (57) weeks, respectively (data not shown).
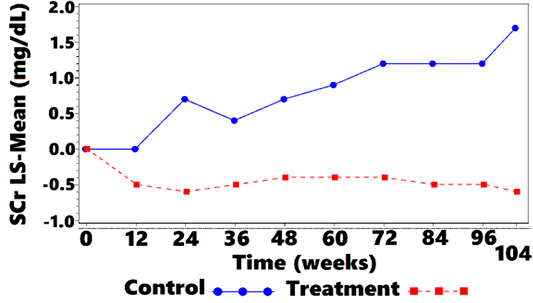
aSCr = blood-serum creatinine concentration; bLS-Mean = least squares mean.
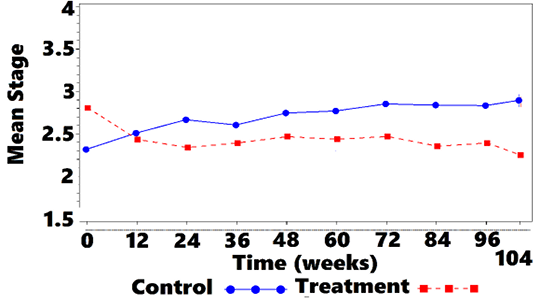
Figure 3: Mean IRISa Stage vs. Time
aIRIS = International Renal Interest Society.
IRIS Stage
A comparison of averages showed that treated cats started at a numerically higher mean SCr and IRIS stage compared with controls. At week 12, treatment group stage declined whereas control group values increased (Figure 3). As time progressed, a gradual shift in the treatment group to lower mean IRIS stage compared with controls was observed. A CMH statistic test for linear association between treatment and reduced disease stage was significant at baseline, with the treatment group having higher stage values than the control group. At weeks 24, 48, 60, 72, 84, 96, and 104 a significant linear association was observed between treatment and disease stage, with lower disease stage values observed in the treated cats compared with controls (Table 6).
Table 6: CMHa Test for Linear Association of Decreased Disease Stage with Treatment vs. Time
| OP (weeks) | P |
| 0 Baseline | <0.001 |
| 12 | 0.495 |
| 24 | 0.009 |
|
36 |
0.091 |
| 48 | 0.042 |
| 60 | 0.033 |
| 72 | 0.023 |
| 84 | 0.004 |
| 96 | 0.019 |
| 104 | 0.025 |
aCMH = Cochran-Mantel-Haenszel.
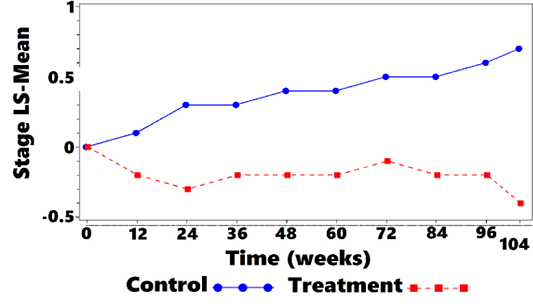
When IRIS Stage was expressed as LS-mean change-from-baseline, weeks 12, 24, 36, 48, 60, 72, 84, 96, and 104 showed significant reductions (P = 0.006 at week 12, P<0.001 weeks 24 to 104) as shown in Figure 4 and Table 7. The overall difference at week 104, between treatment and controls was –0.2 (CI: –0.3, –0.1; P <0.001). The treated group showed negative LS-mean change in IRIS
Table 7: IRISa LS-Meanb Stage Change-from-Baseline vs. Time
| OP (weeks) |
Least Squares Mean (SEMc) |
P | n-Treatment/Control | Statistical Power (%) | |
| Control | Treatment | ||||
| 0 | 67/57 | ||||
| 12 | 0.1 (0.08) | –0.2 (0.07) | 0.006 | 67/57 | 79.9 |
| 24 | 0.3 (0.08) | –0.3 (0.08) | < 0.001 | 59/57 | >99 |
| 36 | 0.3 (0.08) | –0.2 (0.08) | < 0.001 | 51/53 | >99 |
| 48 | 0.4 (0.08) | –0.2 (0.08) | < 0.001 | 45/51 | >99 |
| 60 | 0.4 (0.09) | –0.2 (0.09) | < 0.001 | 39/39 | >99 |
| 72 | 0.5 (0.09) | –0.1 (0.09) | < 0.001 | 32/34 | >99 |
| 84 | 0.5 (0.10) | –0.2 (0.10) | < 0.001 | 31/31 | >99 |
| 96 | 0.6 (0.11) | –0.2 (0.11) | < 0.001 | 23/24 | >99 |
| 104 | 0.7 (0.12) | –0.4(0.12) | < 0.001 | 18/19 |
>99 |
aIRIS = International Renal Interest Society; bLS-Mean = least squares mean; cSEM = standard error of mean.
stage score at each OP compared to baseline. In contrast, controls showed positive change at each OP. The data indicate that treatment significantly lowered disease stage over time.
Treatment and Control IRIS-Stage Distribution vs. Time
At baseline, the control group had a larger proportion of cats classified as IRIS Stage 2 (68.4 %) than did the treat
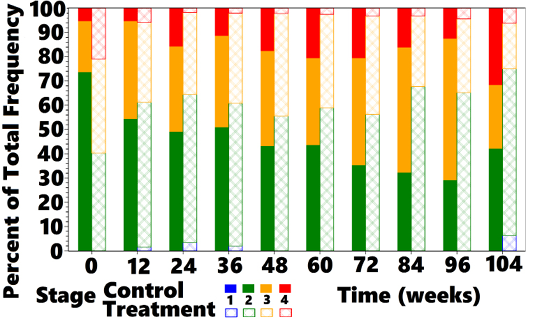
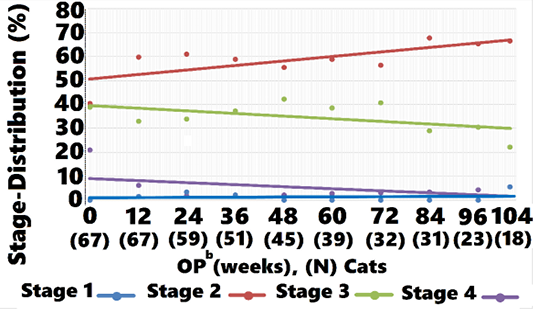
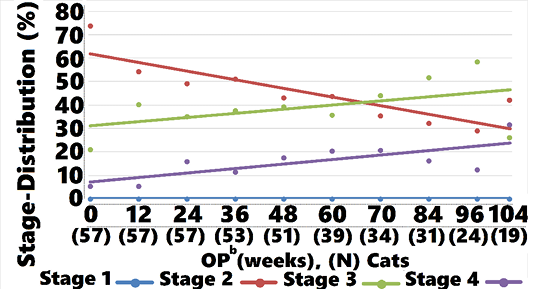
ment group (40.3%). At all subsequent OP the proportion of cats classified as IRIS Stage 2 was greater in treated cats compared with controls, as shown in Figure 5. Controls moved from predominantly Stage 2 to predominantly Stages 3 and 4 at week 104, whereas treated cats moved from a nearly equal distribution between Stages 2 and 3 to mostly Stage 2, with a small percentage of Stage 3 and 4 cats at week 104. Cats returned to IRIS Stage 1 only in the treatment group. Figures 5, 6, and 7 and Table 8 show the distribution of animals in each IRIS stage versus time.
aIRIS = International Renal Interest Society; bLS-Mean = least squares mean.
aIRIS = International Renal Interest Society.
aIRIS = International Renal Interest Society; bOP = observation period.
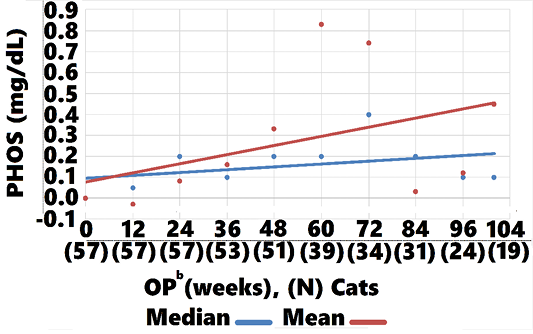
PHOS
Treated cats showed an overall LS-mean PHOS difference at 104 weeks, when compared with controls, of -0.3 (CI: -1.2, 0.6; P = 0.5; data not shown). However, treatment group mean and median PHOS declined from baseline
Table 8: Number and Percentage of Cats in IRISa Stages per OP
| Treatment | ||||||||||||
| OP (weeks) | 0 | 12 | 24 | 36 | 48 | 60 | 72 | 84 | 96 | 104 | ||
|
Stage 1 N Cats |
0 | 1 | 2 | 1 | 0 | 0 | 0 | 0 | 0 | 1 | ||
| Stage 1 % | 0.0 | 1.5 | 3.4 | 2.0 | 0.0 | 0.0 | 0.0 | 0.0 | 0.0 | 5.6 | ||
| Stage 2 N Cats | 27 | 40 | 36 | 30 | 25 | 23 | 18 | 21 | 15 | 12 | ||
| Stage 2 % | 40.3 | 59.7 | 61.0 | 58.8 | 55.6 | 59.0 | 56.3 | 67.7 | 65.2 | 66.7 | ||
| Stage 3 N Cats | 26 | 22 | 20 | 19 | 19 | 15 | 13 | 9 | 7 | 4 | ||
| Stage 3 % | 38.8 | 32.8 | 33.9 | 37.3 | 42.2 | 38.5 | 40.6 | 29.0 | 30.4 | 22.2 | ||
| Stage 4 N Cats | 14 | 4 | 1 | 1 | 1 | 1 | 1 | 1 | 1 | 1 | ||
| Stage 4 % | 20.9 | 6.0 | 1.7 | 2.0 | 2.2 | 2.6 | 3.1 | 3.2 | 4.3 | 5.6 | ||
| Control | ||||||||||||
| OP (weeks) | 0 | 12 | 24 | 36 | 48 | 60 | 72 | 84 | 96 | 104 | ||
| Stage 1 N Cats | 0 | 0 | 0 | 0 | 0 | 0 | 0 | 0 | 0 | 0 | ||
| Stage 1 % | 0 | 0 | 0 | 0 | 0 | 0 | 0 | 0 | 0 | 0 | ||
| Stage 2 N Cats | 42 | 31 | 28 | 27 | 22 | 17 | 12 | 10 | 7 | 8 | ||
|
Stage 2 % |
73.7 | 54.4 | 49.1 | 50.9 | 43.1 | 43.6 | 35.3 | 32.3 | 29.2 | 42.1 | ||
| Stage 3 N Cats | 12 | 23 | 20 | 20 | 20 | 14 | 15 | 16 | 14 | 5 | ||
| Stage 3 % | 21.1 | 40.4 | 35.1 | 37.7 | 39.2 | 35.9 | 44.1 | 51.6 | 58.3 | 26.3 | ||
| Stage 4 N Cats | 3 | 3 | 9 | 6 | 9 | 8 | 7 | 5 | 3 | 6 | ||
| Stage 4 % | 5.3 | 5.3 | 15.8 | 11.3 | 17.6 | 20.5 | 20.6 | 16.1 | 12.5 |
31.6 |
||
aIRIS = International Renal Interest Society.
aIRIS = International Renal Interest Society; bOP = observation period.
-1.3 (CI:-1.11, -1.34, P=0.002), and -0.2 (CI: -0.15, -0.25, P<0.002), respectively , whereas control group mean and median values increased 0.14 (CI: 0.45, 0.03, P=0.004), 0.3 (CI: 0.20, 0.10, P<0.002, respectively (Figures 8, 9). Mean and median values remained within reference range for both groups through all OPs.
Safety and Palatability
The cell viability assay revealed no cytotoxicity to hRPTEC when exposed to AB070597 for 72 h at 37°C, over the concentration range (100.00, 50.00, 25.00, 12.50, 6.25, 3.13, 1.56, 0.78, 0.39, and 0.2 ug/mL), as shown in Figure 10; therefore, no IC50 was calculated. Treated cats accepted AB070597 as a single oral dose and on food. Treatment diaries were not used in this study, but there were no reports of digestive distress or diarrhea. Some cats displayed symptoms consistent with CKD, but no observed adverse effects attributable to supplementation were reported by owners or veterinarians. There were no adverse changes in serum chemistries or complete blood counts traceable to supplementation in treated cats (data not shown).
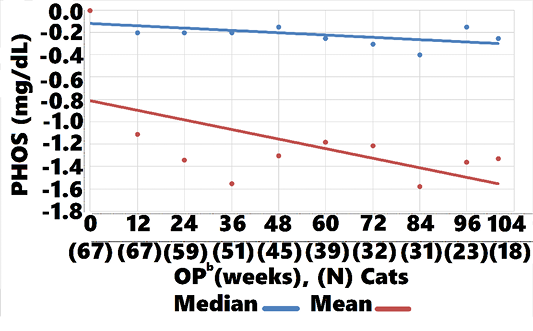
aPHOS = blood-serum phosphate concentration; bOP = observation period.
Body Weight
Baseline body weights were recorded in 57 treated cats. Body weights were recorded in 41 of those cats at their final study-related clinic visit. Baseline and time-equivalent
Table 9: Summary of Body Weights (kg)
| Control | Treatment | |
| Baseline | ||
| n | 53 | 57 |
|
Mean (SDa) |
4.5 (1.28) | 4.1 (1.17) |
|
Median (minb, maxc) |
4.1 (2.3, 8.4) | 3.9 (2.2, 7.2) |
| Last Clinic Visit | ||
| n | 46 | 41 |
| Mean (SD) | 3.7 (1.14) | 4.1 (1.30) |
| Median (min, max) | 3.5 (2.1, 7.2) | 4.0 (1.9, 7.7) |
| Weight Change-from Baseline to Last Clinic Visit | ||
| n | 45 | 41 |
| Mean (SD) | –0.9 (1.07) | 0.0 (0.75) |
| Median (min, max) | –0.8 (–3.2, 1.6) | 0.0 (–1.7, 1.3) |
| P-value | < 0.001 |
< 0.001 |
aSD = standard deviation; bmin = minimum; cmax = maximum
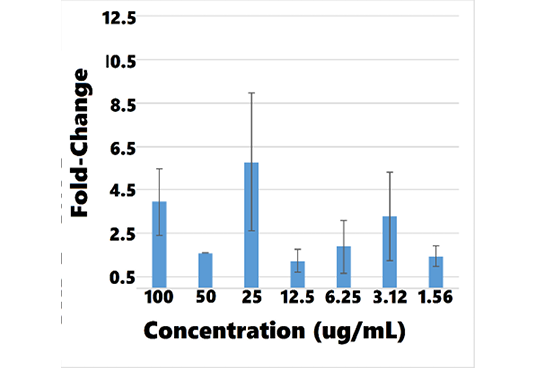
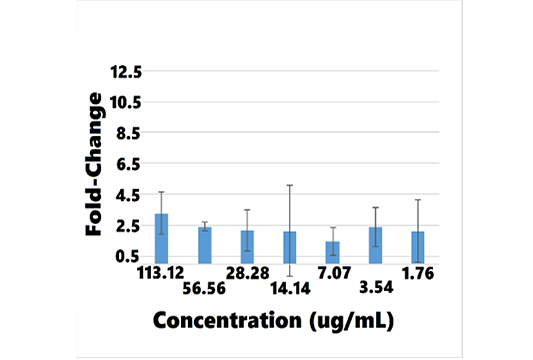
Table 10: Mean BMP-7 mRNA Fold-Change for Concentrations of AB070597 and L-Carnosine Measured by qRT-PCR in hRPTEC
| AB070597 | L-carnosine | ||||
| (ug/mL) |
MFCa |
SDb |
(ug/mL) | MFC | SD |
| 100 | 3.957982 | 1.532254 | 113.12 | 3.261911 | 1.356335 |
| 50 | 1.612641 | * | 56.56 | 2.409648 | 0.300896 |
| 25 | 5.771671 | 3.169783 | 28.28 | 2.153824 | 1.316414 |
| 12.5 | 1.238226 | 0.519722 | 14.14 | 2.128198 | 2.963974 |
| 6.25 | 1.892023 | 1.228735 | 7.07 | 1.443206 | 0.901008 |
| 3.125 | 3.286329 | 2.052426 | 3.535 | 2.364290 | 1.241926 |
| 1.56 | 1.451196 | 0.490564 | 1.764 | 2.128385 |
2.012427 |
aMFC = mean fold-change; bSD = standard deviation; * Zero division error.
aPHOS = blood-serum phosphate concentration, bOP = observation period.
body weights were available from medical records for 53 and 46 control group cats, respectively. Control group cats lost an average of 0.9 kg (P < 0.001), while cats in the treatment group showed a mean body weight change of
0.0 kg ( P < 0.001). Changes in body weight are shown in
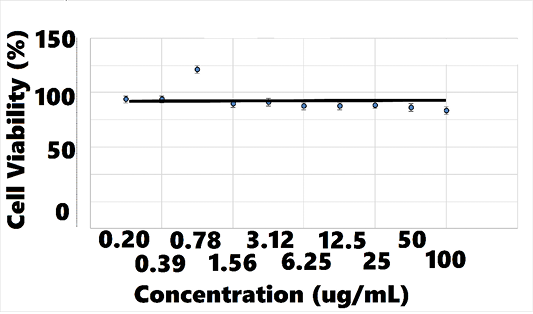
Figure 10: hRPTECa Viability vs. AB070597 Concentration
ahRPTEC = human renal primary proximal tubule epithelial cells.
aBMP-7 = bone morphogenetic protein-7; bmRNA = messenger
ribonucleic acid; chRPTEC = human renal primary proximal tubule epithelial cells; dqRT-PCR = quantitative real time-polymerase chain reaction.
BMP-7 mRNA Expression Assay
Overall, BMP-7 mRNA fold-change increased with rising concentrations of AB070597 and L-carnosine. BMP-7 mRNA was increased and significantly different from controls in all culture wells, except 1, at all concentrations (P < 0.05) (supplemental data). Changes were small, however, and no significant trend was established. Table 10 and Figures 11 and 12 show the mean fold-change at varying concentrations.
aBMP-7 = bone morphogenetic protein-7; bmRNA = messenger
ribonucleic acid; chRPTEC = human renal primary proximal tubule epithelial cells; dqRT-PCR = quantitative real time-polymerase chain reaction.
DISCUSSION
Current controversy exists over whether TDs provide adequate nutrition for CKD cats (Scherk and Laflamme, 2016). Commercial TDs, with decreased protein, phosphorus, and increased carbohydrate percentages, were not fed in this study because they would have lowered baseline oral amino acid and phosphorus intake and prevented some cats from reaching their daily metabolic energy requirement (Salaun et al., 2017; Hewson-Hughes et al., 2011). SCr was chosen as an indicator of renal function because it correlates strongly with disease severity (Elliott and Barber, 1998). PHOS was selected because increased levels associated with accelerated disease progression and poor prognosis (Boyd et al., 2008). The IRIS disease staging system was used because it is an accepted tool for categorizing disease stage and monitoring progression. Body-weight was an important variable used as an estimate of protein oxidation and nitrogen balance.
Mean SCr dropped dramatically in treated cats from baseline to week 12 and continued a generally negative slope to week 104. Control cats experienced the opposite trend, with mean SCr rising from baseline through week 104. Treatment group median body weight, over the same time remained stable, which was likely the result of their diet providing adequate nutrition by not restricting protein and fat. Had treatment cats lost weight, there might be reason to question SCr improvement, but that was not the case.
There are biological mechanisms that might explain these differences: SCr correlates positively with increased plasma levels of the endogenous L-arginine derivatives, asymmetrical and symmetrical dimethylarginine, in cats with CKD (Jepson et. al., 2008). Both competitively block cellular uptake of L-arginine, the exclusive biological substrate for nitric oxide synthesis, thereby inhibiting its production. The pathogenic role of blocked nitric oxide synthesis in human CKD patients was discussed by Zoccali et al. (2001) and Bode-Boger et al. (2006). In diverse models of renal disease, oral L-arginine supplementation consistently improves glomerular filtration rate (Klahr, 1999).
Treatment resulted in significant improvements in mean IRIS stage at week 24 onward. Treatment also created significant improvements (P<0.001, except for week 12 [P = 0.006]) in LS-mean IRIS stage change-from-baseline compared with controls, suggesting that treatment arrested, and to some extent, reversed disease.The reduction in IRIS stages conflicts with those observed in cats treated with conventional therapies, whose stages increase with time.
Mean and median PHOS remained within reference range for both treatment and control groups through 104 weeks. There were, however, significant differences in change-from-baseline, with PHOS falling below baseline from week 12 through week 104 in the treatment group and PHOS rising from week 24 through 104 in controls (Figures 8, 9). The steady decline in treatment group PHOS might seem unusual, since cats were fed non-protein, non-phosphorous restricted diets. One explanation is that amino acids increase glomerular filtration rate, which would increase phosphate excretion. Another is that cats preferentially use amino acids for gluconeogenesis to maintain glucose needs (Eisert, 2011). The amino acids in AB070597 are gluconeogenic and might have elevated insulin levels in response to increased blood-serum glucose. Increased insulin lowers PHOS by stimulating cellular uptake (Riley et al., 1979).This was observed in humans when circulating L-arginine levels were increased by infusion, resulting in a highly significant fall in PHOS that was significantly correlated to increased insulin (Massara et al., 1980). Finally, increased BMP-7 expression might have played a role in the treatment group’s persistent PHOS decline from baseline. BMP-7 gene expression declines in early stages of renal fibrosis and continues to decline with disease progression in the rat model (Xuhua et al., 2007). Gravesen et al. (2018) showed that exogenous BMP-7 treatment created a significant PHOS decrease in CKD rats that had been fed a high phosphorus diet (1.2%) for 14 weeks. Even though BMP-7 mRNA fold-change was not statistically significant in this study’s BMP-7 mRNA expression assay, there was a positive trend with rising AB070597 concentrations. It is possible that increased endogenous BMP-7 expression induced non-functional nephrons to differentiate and regain their normal phenotype, thereby adding to the total functional nephron number, resulting in increased fractional PHOS excretion.
Cats are unable to maintain nitrogen balance when protein intake is below their protein requirement (Green et al., 2008), resulting in negative nitrogen balance and weight loss.Treatment group cats maintained stable mean and median body weight and were not fed TDs, implying that they preserved nitrogen balance as a result of their non-restrictive diets. Diet data was not available from all control-referring clinics, but from clinics that kept diet records, 60.4% of cats were prescribed TDs, which was 66.7% of all controls, presenting a possible explanation for the group’s significant mean and median weight loss. Freeman et al. (2016), showed that weight loss in CKD cats accelerates after diagnosis, across all IRIS stages, which implies that a common underlying intervention at diagnosis might be responsible (e.g., TD prescription). Markovich et al. (2015) found that 51% of owners were compliant when TDs were recommended, so it is reasonable to expect that many control cats at clinics that did not have diet records were also fed TDs. Data is convincing, however, that TDs extend survival, but at a cost. Green et al. (2008) showed that when cats were fed low protein TDs, protein oxidation exceeded energy intake by approximately 39%, whereas oxidation and energy intake were adequately matched with medium and high protein diets. Ross (2016) conducted a study, where feeding tubes were placed in 34 CKD cats to control TD intake for long-term body-weight maintenance. Body weight stabilized or increased slightly, despite continued disease progression. Median survival was 178 days, and Kaplan-Meyer survival curves showed that approximately 74% died within one year. When this current study’s results are viewed as a whole, there is reason to hypothesize that weight control and longevity might be enhanced with a normal diet and amino acid/dipeptide supplementation.
CONCLUSIONS
Treated cats exhibited significant overall reductions in SCr LS-mean change-from-baseline and IRIS stage compared with untreated controls. Treatment group IRIS LS-mean stage change-from-baseline was negative at each OP, indicating disease stage reduction, whereas control group IRIS LS-mean stage change-from-baseline was positive at each OP, indicating disease stage advance. PHOS change-from-baseline persistently declined in treated cats and persistently increased in controls, suggesting that treated cats increased fractional excretion, increased glomerular filtration rate, or both. Treated cats maintained body weight, suggesting stable nitrogen balance. Oral supplementation of renoprotective amino acids and dipeptide in AB070597 prevented, and to some extent, reversed disease progression in treated animals that were fed non-protein and non-phosphorous restricted diets. Clinical use of this compound may benefit the greater population of companion cats diagnosed with CKD.
ACKNOWLEDGMENTS
The author gratefully acknowledges the staff at Whitsell Innovations, Inc. for their assistance with manuscript preparation and to PharPoint Research, Inc. for their expertise and insight with data analysis and figure design. He also acknowledges the professional scientific capabilities of Cyprotex US, LLC staff for their BMP-7 mRNA and cell viability analyses.
This study was made possible by generous support from the John T. Fulton Trust.
CONFLICT OF INTEREST
The author declares no financial conflict of interest.
REFERENCES


