Advances in Animal and Veterinary Sciences
Research Article

Assessment of Genetic Diversity in Iraqi Camel Breeds using Cytochrome b
Asaad Yheia Ayied1*, Adnan Issa Al-Badran2, Ayoob Radhi Al-Zaalan1
1Animal Production Department, College of Agriculture, University of Basrah, Basrah, Iraq; 2Biology Department, College of Science, University of Basrah, Basrah, Iraq.
Abstract | This study aimed to investigate the genetic diversity, population structure, and demographic history of Iraqi camel breeds. Eighty blood samples were randomly collected from unrelated animals from different parts of Iraq. Fifty samples of the Joudi breed were collected from Basrah, Al-Muthanna, Najaf, Babylon,and Wasit (10 samples each). As well as 15 samples of the Khwar breed from Anbar and 15 samples of the Hurra breed from DhiQar. The analysis of molecular variance (AMOVA) was employed in order to determine the genetic variability within and among populations of camel breeds. The neutrality tests and mismatch distribution analysis were also applied to assess the neutrality and demographic expansion of the populations, respectively. The results revealed a total of 16 polymorphic with high haplotype diversity (0.648) and low-nucleotide diversity (0.00109). The haplotypes of the cytochrome b (Cytb) gene were 15 haplotypes, 10 of which were in the Joudi breed, 6 in the Hurra breed and one haplotype in the Khwar breed. The haplotype H-2 was common to the three breeds. The variations within and among populations accounted for 94.36 and 5.64% of the total variation, respectively. The results of the neutrality test for Cytb showed that the Joudi and Hurra breeds had negative values for both Tajima’s D and Fu’s Fs. The highest values were -1.00737 and -1.98591 for the Hurra breed and the lowest values were for the Joudi breed (-2.14737 and -6.59079 respectively). In the Khwar breed, the values were zero for Tajima’s D and Fu’s Fs and the obtained result conforms to the model of population expansion (t > 0 and θ1> θ0) for Joudi and Hurra breeds.
Keywords | Dromedary camel, Iraq camel breed, Cytochrome b gene (Cytb), Haplotype, Phylogenetic tree
Editor | Kuldeep Dhama, Indian Veterinary Research Institute, Uttar Pradesh, India.
Received | May 12, 2018; Accepted | June 27, 2018; Published | July 25, 2018
*Correspondence | Asaad Yheia Ayied, Animal Production Department, College of Agriculture, University of Basrah, Basrah, Iraq; Email: asaad.yheia@gmail.com
Citation | Ayied AY, Al-Badran AI, Al-Zaalan AR (2018). Assessment of genetic diversity in iraqi camel breeds using cytochrome b. Adv. Anim. Vet. Sci. 6(7): 273-277.
DOI | http://dx.doi.org/10.17582/journal.aavs/2018/6.7.273.277
ISSN (Online) | 2307-8316; ISSN (Print) | 2309-3331
Copyright © 2018 Ayied et al. This is an open access article distributed under the Creative Commons Attribution License, which permits unrestricted use, distribution, and reproduction in any medium, provided the original work is properly cited.
Introduction
Camels are pseudo-rumen chorionic mammals, and are classified as mammals with double fingers and lined feet belonging to the family of Camelidae. Which include Dromedary, Bactrian camels, Lama, Alpaca, Vicuna and Guanaco (Franklin, 2011). The total number of camels in the world is about 25.89 million heads, 89% of which are Dromedary camels, and the remaining (11%) is a Bactrian camel (in the cold deserts of Asia). More than 80% of the world’s camels are found in Africa (FAO, 2013). Although large camels contribute to food security in arid and semi-arid regions as compared to other farm animals, studies on camel production systems, phenotypic and genetic are rare (Yohannes et al., 2007).
Mitochondrial DNA (mtDNA) is a powerful tool that can be used to determine evolutionary relationships, population composition and biology of many species due to its low molecular weight properties, simple structure, low recombination rate and rapid evolution rate (Curole and Kocher, 1999; Wan et al., 2004; Arif and Khan, 2009; Patwardhan et al., 2014; Hussain et al., 2015).The present study was undertaken to evaluate genetic diversity and the relationships between Iraqi camel breeds and other breeds of camels in the world.
Materials and methods
Blood Samples and Genomic DNA Extraction
Blood samples were collected from 80 camels that did not have close relatives from different parts of Iraq. Fifty samples of the Joudi breed were collected from Basrah, Al-Muthanna, Najaf, Babylon and Wasit (10 samples each). As well as 15 samples of the Khwar breed from Anbar and 15 samples of the Hurra breed from DhiQar. DNA was extracted using Kit from Geneaid Company (Taiwan) following the manufacturer’s protocols.
Polymerase Chain Reaction (PCR) Amplification of mtDNA Cytb gene
A fragment (867bp) of the mtDNA Cytb located between nucleotide positions 15,112 and 15,978 in the reference camel dromedariesmitochondrial genome NC009849.1was amplified using two primers: Forward primer: 5- AGTCAATGCCTGTTTTGAGTACT-3 and Reverse primer: 50- TTGATTTGACTGCGACGGGG-3. The PCR amplifications were conducted in a 50 µL volume containing 20 ng genomic DNA, 25 µl of Master Mix, 2 µl each primer, 15 µl free water. The amplification conditions were as follows: initial denaturation at 94 C for 2 min followed by 35 cycles of denaturation at 94 C for 30 sec, annealing at 60 C for 30 sec, and extension at 72 C for 30 sec, and then the final extension at 72 C for 5 min. The PCR products were electrophoresed on 2% agarose gel stained with ethidium bromide to test the amplification success. The amplified products were purified with a DNA purification kit (SSufine) according to the manufacturer’s instructions to remove residual primers and dNTPs. Sequencing was performed in Macrogen Incorporation (Seoul, South Korea).
Data Analysis
Cytochrome b sequences were aligned using the BioEdit software (Hall, 1999). Haplotype diversity and nucleotide diversity were analyzed using DnaSP v5.10 software (Librado and Rozas, 2009). Genetic distance, molecular variation (AMOVA) and neutrality test were analyzed using Arlequin 3.5.1.2 software (Excoffier and Lischer, 2010). The haplotypes network was drawn using Network 5.0.0.0 software (Bandelt et al., 1999).
Neighbor-joining (NJ) tree for tested camel breed sequences and the phylogenetic tree between our camels and other camel breeds in the world were constructed using Megaversion 7.0 software (Kumar and Tamura, 2016). The sequences of our camel cytochrome b were aligned with reference sequences for Camelus dromedaries: JX946217.1-JX946272.1, KU605062.1, KU605061.1, KU605072.1, - KU605080.1,KX554932.1, KX554934.1, and KX554933.1.Camelusbactrianus: EF212038.2, EU195442.1
Results and discussion
Sequence Variation and Genetic Diversity
The results showed that the length of the PCR products was 867 nucleotides were determined in Cytb gene sequences of all 80 samples. The average contents of C, T, A, and G were 27.22, 26.77, 27.06, and 18.89%, respectively, which shows that the GC content (46.11%) was less than the AT content (53.53%). Nucleotide substitutions were only determined among other types of mutations.Among the 15 different haplotypes identified from the 80 sequences, sixteen of them werepolymorphic (10 transitions and 6 transversions) (Table 1). The current results were higher than those obtained by Babar et al. (2015), who found four polymorphic in Pakistani camels. These results were also higher than that of Othman et al. (2017), who found only two genotypes in six strains of Egyptian camels. Abdussamad et al. (2015) also found less (14) polymorphic in Nigerian camel. However, the present results come slightly below the results of Ming et al. (2016a), who found 17 polymorphic in Bactrian camel breeds of Mongolia, Russia and China.
Genetic diversity of the Cytb gene showed that the values of haplotypediversity (HD) and nucleotide diversity values (π) were moderate, which were 0.419 and 0.00104, respectively. These parameters were 0.453 and 0.00109 for the Joudibreed and 0.648 and 0.00175 for the Hurrabreed while the values were zero for the Khwarbreed (Table 1). Our results were less than the results of Ming et al. (2016b) in his study 11 breeds of domestic camelin China, Mongolia, Russia and a group of two-hump wild camels of Mongolia which ranged from 0.456 and 0.0011 to 0.900 and 0.0032 respectively. As well as Abdussamad et al. (2015) found higher variability (0.751 and 0.002 respectively) in Nigerian camel, Babar et al. (2015) found 0.833 and 0.00187, respectively, in Pakistani camels. The results were higher than those of Othman et al. (2017), who found 0.241 and 0.00150, respectively in six Egyptian camel breeds. As for the Khwar breed, the value of haplotype diversity and nucleotide diversity was zero this was identical to those of Maghrabi, Fallahiand Baladi breeds in Egypt (Othman et al., 2017). This may be due to the absence of polymorphic in the Khwar breed.
Table 1: Sampling population, sample size, population genetic diversity measure, the standard deviation for each population
| Breed | N. | NH | H | HD | π | N. transitions | N. transversions |
| Joudi | 50 | 13 | 10 | 0.453 | 0.00109 | 10 | 3 |
| Khawr | 15 | 0 | 10 | 0.000 | 0.0000 | 0 | 0 |
| Hurra | 15 | 6 | 6 | 0.648 | 0.00175 | 3 | 3 |
| Total | 80 | 16 | 15 | 0.419 | 0.00104 | 10 |
6 |
N: Sample size; H: Haplotype; NH: Number of polymorphic; HD: Haplotype diversity π: Nucleotide diversity.
Haplotype Network and Phylogenetic Tree
The haplotypes of the Cytb gene were 15 haplotypes, 10 of which were in the Joudi breed, 6 in the Hurra breed and one haplotype in the Khwar breed (Table 1). The haplotype H-2 was common to the three breeds, and haplotypes from H-1 to H-10 were found except for H-2 in the Joudi breeds and haplotypes of H-11 to H-15 in the Hurra breed (Figure 1).The starburst haplotype network indicated a demographic expansion in the Iraqi camel breeds except for the Khwar breed (Bubac and Spellman, 2016).
When construction of haplotypes network included Iraqi camel breeds and other countries breeds using Cytb gene, three haplogroups were found (Figure 2). The Iraqi camels were in one haplogroup (yellow color) and others in two different haplogroups. These results suggest that Iraqi camel breeds evolve differently than other studied breeds in other countries. Similar results were demonstrated by Ming et al. (2016b), who found two haplogroups for domestic and wild Bactrian camel.
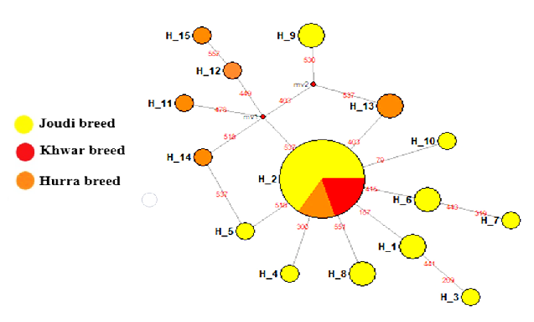
Figure 1: Median-joining networks constructed of the tested Iraq camel breed Joudi, Khawr, and Hurra.

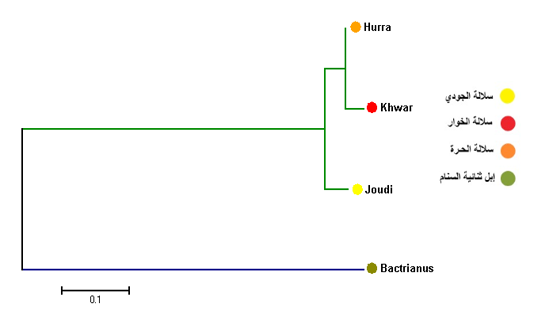
The results of the phylogenetic tree of Cytb among the Iraqi breeds showed that there were two main branches. The first branch included the Joudibreed, while the second branch included both the Hurra and the Khwarbreeds (Figure 3).
In comparison with some countries, the results showed that Cytb has two main branches: the first branch includes the Iraqi camels and the second branch branche divided into two branches. The first secondray branch included Saudi Arabia, Oman, Kenya and Ethiopia, and the second branch included Tunisia, Jordan, Australia, Niger, Sudan, Iran, Pakistan and the Emirates (Figure 4). This results are similar with a network of haplotypes that included three Haplogroups.

Table 2: Analysis of molecular variance of Iraq camel breeds
| SOV | DF | SS | Variance components | % variation |
|
Among populations |
2 | 0.929 | 0.01213 | 5.64 |
|
Within populations |
77 | 15.633 | 0.20303 | 94.36 |
| Total | 79 | 16.562 |
0.21516 |
SOV=Source of variation; DF. =degree of freedom; SS=Sum of squares
Table 3: Demographic expansion indices of Iraq camel breeds
| Breed | T | t | θ0 | θ1 | D | F | r | SD |
| Joudi | 3285 | 1.97 | 0.590 | 3658.260 | -2.14737 | -6.59079 | 0.1520 | 1.232 |
| Khawr | 0 | 0.00 | 0.00 | 0.000000 | 0.00000 | 0.00000 | 0.0000 | 0.000 |
| Hurra | 2612 | 2.41 | 0.00 | 2.44896 | -1.00737 | -1.98591 | 0.1635 | 0.780 |
| Mean |
T: time of expansion; t: tau; θ0 and θ1: mutation parameters; D:Tajima’s neutrality test; F: Fu’s neutrality test; r: Harpending’s raggedness index; SD: Mean Pairwise Difference.
Analysis of Molecular Variance (AMOVA)
The results of the analysis of the molecular variation (AMOVA) for Cytb gene between and within the Iraqi camel breeds showed that the genetic variance among breeds was 5.64% and the variation within populations was 94.36% (Table 2). The above results showed that the genetic variability within the breeds was much greater than the genetic variation among the breeds. This may be because the Iraqi camel breeds have the same mother origin (Moradiet al., 2017). Our findings have been agreed with studies of other animal species such as goats (Silva et al., 2017), cattle (Ozsensoy and Kurar, 2014) and sheep (Rodríguez-Rodríguez et al., 2015). All studies found that the genetic variation within breeds was much greater than the genetic variation between the breeds. Our results were not consistent with the results of Silbermayr et al. (2010), who found in their study both wild and domesticated camels that most genetic variation between and within the breeds was 95.64% and 4.36% respectively. Ming et al. (2016b) also found that between breed variance was 90.14% and within breed was 9.86% in their studies of wild and domesticated camels. Evolution of domesticated and wild camels was in the form of two distinct chains might be the reason behind these finding, and it is suggested that they do not have the same origins (Silbermayr et al., 2010)
Demographic Expansion
The results of the neutrality test for Cytb showed that the Joudi and Hurrabreeds had negative values for both Tajima’s D and Fu’s Fs. The highest values were -1.00737 and -1.98591 (P <0.05) in the Hurrabreed and lowest values in the Joudi breed -2.14737 and -6.59079 (P <0.05) respectively. In the Khwar breed, the values were zero for Tajima’s D and Fu’s Fs and the obtained result conforms to the model of population expansion (t > 0 and θ1> θ0) for Joudi and Hurra breeds (Table 2).
A neutrality test such as Tajima’s D and Fu’s Fs is used to measure the probability that the population has experienced demographic events such as genetic drift or expansion of the clan size. The results indicate that the Tajima’s D and Fu’s Fs, which indicate the expansion of the Iraqi breeds (Fu, 1997), often interpret the molecular signals of sudden expansion as population growth or spread within the region across a wider geographical range (Bruford et al., 2003). Excluding dendritic strain in the Ctyb gene gave a zero value and may be due to the absence of individual patterns. Our results were agreed with that of Abdussamad et al. (2015), who found negative values for Tajima’s D and Fu’s Fs in Nigerian camel.
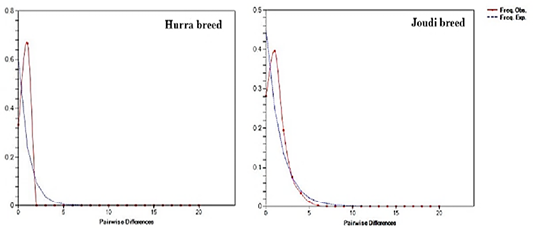
The results of the mismatch distribution in the studied camels of Cytb showed a unimodal distribution and Raggedness (R) values ranged from 0.0 to 0.178 indicating the expansion of Iraqi camel breeds (Table 3, Figure 5). The values was close to 0.0 indicating that the populations are in the case of population expansion (Hudson and Slatkin, 1991; Rogers and Harpending, 1992; Jobling et al., 2004). This is confirmed by a test of neutrality such as Tajima’s D and Fu’s Fs that the Iraqi camels have seen an expansion in the breeds’ size (Schneider and Excoffier, 1999).
Conlict of interest
There is no conflict of interest.
Authors Contribution
All authors contributed equally.
References


