Advances in Animal and Veterinary Sciences
Research Article
Adv. Anim. Vet. Sci. 6(6): 252-257
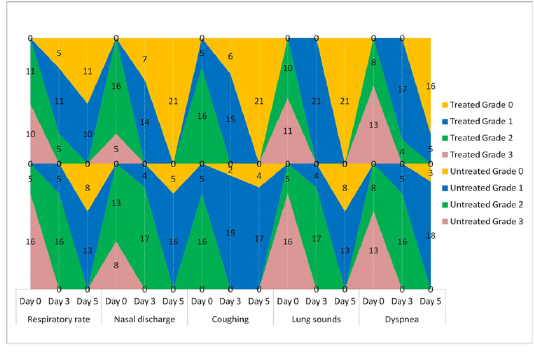
Figure 1
Frequency-distribution of animals according to grade of respiratory parameter. Values indicate the number of animals falling under a grade on the specified day of study.
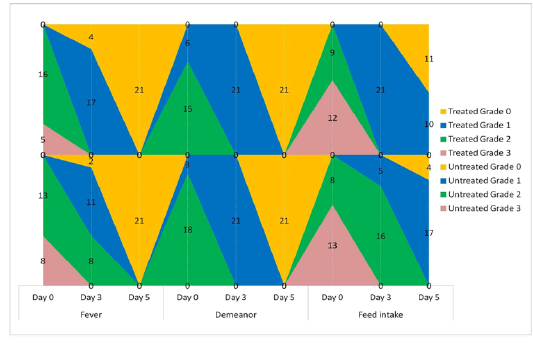
Figure 2
Frequency-distribution of animals according to grade of clinical parameter. Values indicate the number of animals falling under a grade on the specified day of study.
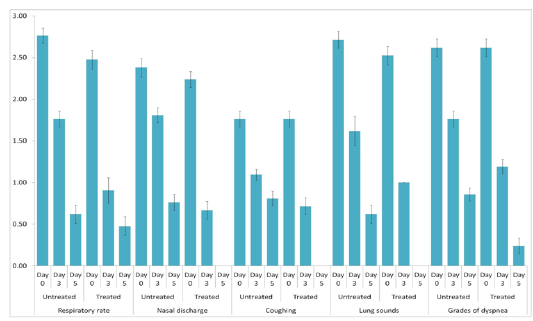
Figure 3
Respiratory index. Mean ± S.E. values of day-wise respiratory indices are shown for each group.
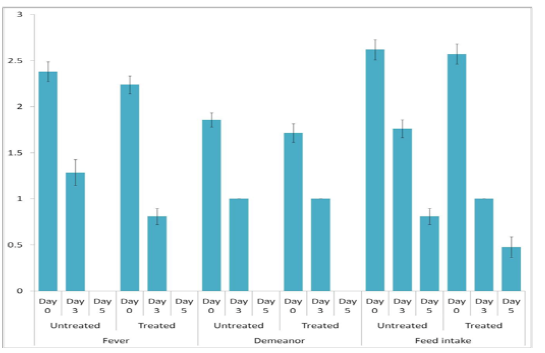
Figure 4
Clinical index. Mean ± S.E. values of day-wise clinical indices are shown for each group.


