Advances in Animal and Veterinary Sciences
Research Article

Estimates of Heritability for Somatic Cell Count, Test-Day Milk Yield and Some Udder-Teat Characteristics in Saudi Dairy Goats using Random Regression Animal Model
Ashraf Abd Elrhman Amin
King Faisal University, College of Agriculture & Food Sciences, 31982 Al-Hassa, P.O. Box 420, Saudi Arabia.
Abstract | The objective of the present study was to estimate heritability and permanent environmental effect for test-day Somatic Cell Count and Somatic Cell Score (SCC& SCS), Test Day Milk yield (TDM), some Udder-Teat Characteristics(UTC) in Aradi Saudi goat using random regression animal model. Estimates of SCC and TDM were examine every 15 days after parturition across the first four parities. Udder-teat characteristics involved in the present study were Udder Depth Side View (UDSV),Teat Placement Rear View (TPRV) and Teat Size (TS). The current data involved, 5642, 4712, 3847 and 3104 test-day records in the first 4 parities, respectively recorded between 2010 and 2015. Polynomial random regression of the third order seemed adequate to explain variation in somatic cell count, test-day milk yield and udder-teat traits. Estimates of heritability for all studied traits were compute using random regression animal model across different stage of lactation within each parity. Overall estimate of heritability for somatic cell score was 0.24+0.09 and ranging from 0.16 during early stage of lactation of the first parity to 0.31 at the third parity during end of lactation. Overall estimates of permanent environmental effect for somatic cell score was 0.46+0.12 and raging from 0.31+0.11 to 0.64+0.14 across the first four parities. Heritability of test-day milk yield were ranged from 0.12 during early stages of the 1st lactation to 0.42 during mid-lactation of the 4th parity. Overall estimates of heritability for test day milk yield were 0.21+ 0.09, 0.23+0.11, 0.27+0.11, and 0.33+0.09 during the first four parity, respectively. Overall estimates of heritability for udder-teat traits were 0.46, 0.52, and 0.61 for UDSV, TPSV, and TS, respectively. The current results indicate that, improvement milk production and reduce the level of somatic cell count are possible at some points of lactation stages.
Keywords | Heritability, Milk, Somatic cell count, Udder, Goats
Editor | Kuldeep Dhama, Indian Veterinary Research Institute, Uttar Pradesh, India.
Received | February 05, 2018; Accepted | March 15, 2018; Published | March 25, 2018
*Correspondence | Ashraf Abd Elrhman Amin, King Faisal University, College of Agriculture & Food Sciences, 31982 Al-Hassa, P.O. Box 420, Saudi Arabia; Email: aameen@kfu.edu.sa
Citation | Amin AAE (2018). Estimates of heritability for somatic cell count, test-day milk yield and some udder-teat characteristics in saudi dairy goats using random regression animal model. Adv. Anim. Vet. Sci. 6(3): 128-134.
DOI | http://dx.doi.org/10.17582/journal.aavs/2018/6.3.128.134
ISSN (Online) | 2307-8316; ISSN (Print) | 2309-3331
Copyright © 2018 Amin. This is an open access article distributed under the Creative Commons Attribution License, which permits unrestricted use, distribution, and reproduction in any medium, provided the original work is properly cited.
INTRODUCTION
On an international level, improving the health of livestock is of dramatically increasing interest to the dairy industry and consumers Stear et al. (2001).The SCC in milk is a reliable parameter to indirectly diagnose the health status of mammary glands (Blagitz, et al., 2012; Olechnowicz, and Jaśkowski, 2012) (and is, therefore, an effective tool to control mammary disorders such as mastitis. In several studies, somatic cell count reported as best indicator for early detecting of udder diseases (Shook and Schutz, 1994). The main component of SCC in goat milk are white blood cells and some of epithelia cells from tissues of milking gland. Somatic cell count is significantly increase when udder tissue is become infected with mastitis (Moroni et al., 2005; Koop et al., 2010). The achievement of improving the economic situation for the dairy farms depends on the optimum utilization of the available information genetic or phenotypic all the time on the animal (Singireddy et al., 1997). One important advantage of the test-day model for genetic evaluation is the most efficient use of serial observations, making better estimates of genetic values, and the possibility of using incomplete lactation records (Freeman, 1998). The ability
Table 1: Estimates of mean and standard error for test-day milk yield (TDM) across days in milk groups in Arudi Saudi goat.
| DIM |
1st TDM |
2nd TDM |
3rd TDM |
4th TDM |
|
| 5-20 |
310.9+11.2 |
459.0+10.1 |
611.2+4.1 |
598.7+4.8 |
|
| 21-35 |
355.4+7.1 |
511.0+0.0 |
749.0+0.0 |
699.0+3.5 |
|
| 36-50 |
453.4+11.8 |
750.4+9.7 |
1161.0+10.1 |
930.9+12.1 |
|
| 51-65 |
557.2+12.4 |
756.4+13.2 |
1301.2+12.0 |
1057.7+9.4 |
|
| 66-80 |
611.7+10.2 |
898.0+4.2 |
1498.7+9.9 |
1201.3+18.2 |
|
| 81-95 |
649.5+7.8 |
972.9+11.4 |
1511.5+11.1 |
1301.3+19.4 |
|
| 96-110 |
675.2+14.2 |
1061.7+17.2 |
1670.0+0.0 |
1349.2+14.1 |
|
| 111-125 |
697.9+7.9 |
1150.2+14.1 |
1661.6+7.3 |
1332.7+14.0 |
|
| 126-140 |
681.0+3.2 |
1052.8+7.4 |
1359.7+11.4 |
1207.4+11.0 |
|
| 141-155 |
597.6+15.2 |
900.0+2.3 |
1242.3+12.4 |
1053.8+13.2 |
|
| 156-170 |
489.1+7.1 |
761.9+11.4 |
1059.3+10.2 |
921.4+5.8 |
|
| 171-185 |
397.9+9.4 |
751.7+6.9 |
1059.6+17.2 |
905.7+5.7 |
|
| 186-200 |
372.0+11.2 |
700.7+9.9 |
1020.5+11.0 |
876.9+7.1 |
|
| 201-215 |
351.9+4.7 |
631.5+5.8 |
811.9+9.7 |
750.2+11.2 |
|
| 216-230 |
351.9+11.0 |
602.7+17.0 |
797.7+11.4 |
744.0+9.7 |
Table 2: Estimates of mean and standard error for test-day somatic cell count (SCC) across days in milk groups in Arudi Saudi goat.
| DIM |
1st SCC |
2nd SCC |
3rd SCC |
4th SCC |
| 5-20 |
269+7 |
410+6 |
489+4 |
733+11 |
| 21-35 |
249+11 |
379+7 |
501+4 |
711+7 |
| 36-50 |
261+9 |
380+8 |
504+4 |
761+8 |
| 51-65 |
275+4 |
385+8 |
521+7 |
830+13 |
| 66-80 |
333+7 |
451+11 |
701+11 |
995+11 |
| 81-95 |
498+4 |
501+3 |
718+9 |
1000+13 |
| 96-110 |
508+8 |
529+3 |
890+4 |
1150+7 |
| 111-125 |
511+11 |
532+7 |
998+6 |
1250+14 |
| 126-140 |
611+9 |
589+7 |
1237+11 |
1339+11 |
| 141-155 |
656+6 |
750+11 |
1251+11 |
1411+14 |
| 156-170 |
750+7 |
780+11 |
1301+13 |
1504+10 |
| 171-185 |
773+6 |
921+10 |
1417+9 |
1750+9 |
| 186-200 |
888+7 |
1212+12 |
1531+14 |
1993+9 |
| 201-215 |
997+4 |
1500+12 |
1740+11 |
2449+9 |
| 216-230 |
1101+11 |
1521+13 |
1763+10 |
2517+14 |
1st, 2nd , 3rd and 4th : the first four parities
of milk SCC to predictintra-mammary infection is lower in goat than in cattle and sheep (Boettcher et al., 2005). Accordingly, prediction rules would better based on repeated SCC measures over a lactation, as proposed by De Crémoux and Poutrel (2001). Fuerst-Waltl and Fuerst (2014) found that heritability estimates for milk production were moderate to high (0.32 to 0.53) while for SCS were below 0.10 in dairy sheep of East Friesian and Lacaune. Mavrogenis et al. (1988) reported that udder traits in Chios sheep had moderate to high heritability estimates (0.27 to 0.83) and positively correlated with test-day milk yield.
The aim of the present study was to estimate heritability and permanent environmental effect for test-day milk yield, somatic cell count and some udder-teat characteristics in Saudi dairy goats using random regression analysis.
MATERIALS AND METHODS
Structure of the used data in the present study was 5642, 4712, 3847 and 3104 test-day records in the first 4 parities, respectively. The regastrated records were collect and estimated during interval between 2010 and 2015. Data consisted of 6087 test day records (TDR) on daily milk yield (TDMml/day), somatic cell count (SCC) and some udder-teat characteristics (UTC). The current data set involved the first four parities of Aradi Saudi goat reared in Training station of Agricultural and veterinary research at King Faisal University KSA. All studied traits were record on each test day between 5 and 230 days in milk (DIM). Does had to have at least two lactations, while the aver
age was 3.7 lactations with 7.16 test-day records. Number of test day records per lactation in the current study were not less than three observations. Days in milk (DIM) were classify into 15 groups with two weeks interval. Overall mean and standard error using primary raw data for milk production and estimates of somatic cell count were present in Table (1).
Udder-teat characteristics involved in the present study were udder depth side view (UDSV), teat placement rear view (TPRV) and Teat size (TS). Scors used in the current UTC evaluation was according to American Dairy Goat Association (2012) as shown in Picture 1.
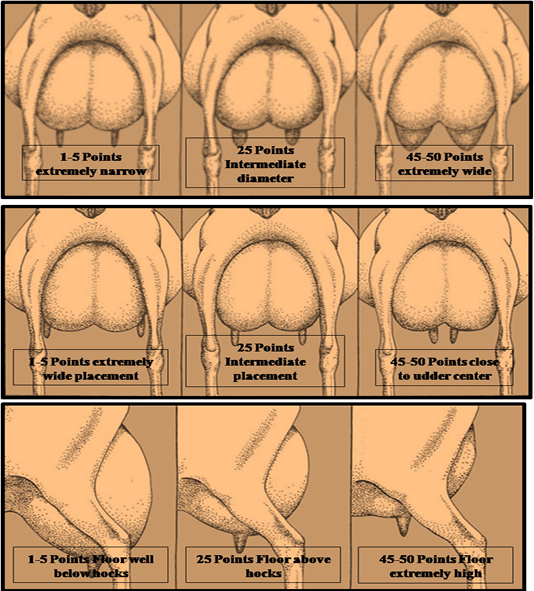
Picture 1: a) Teat size or diameter (TS), b) Teat placement rear view (TPRV) ,c) Udder depth side view (UDSV) Models for estimating scores of Teat Size, Teal Placement Rear view, Udder depth side view
Statistical Analysis
Random regression (RR) models suggested for genetic analysis of test day (TDM) milk yields by Schaeffer and Dekkers (1994) because of their ability to model a separate lactation curve for every animal. Single trait RR models were applied to the first four lactations milk of test-day yield data with different functions for fixed and random regressions (Jamrozik and Schaeffer, 1997; Jamrozik et al., 1998). In the simulation study of Strabel and Misztal (1999), RR models were significantly better than an analysis of 305d in terms of correlation between estimated and true breeding values.To analysis the date of SCC trait, we normalized the SCC distribution by a logarithmic transformation. The SCS computed as
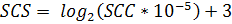
as reported in (Ali and Shook 1980; Rupp et al., 2011).Udder-teat characteristics involved in the present study were UDSV, TPRV and TS.
The random regression model used in the study was
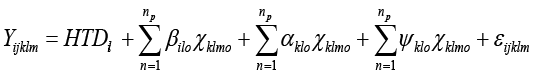
Where:-Yijklm is the mth test day observation of kth does in lth lactation, HTDil is the independent fixed effect of ith herd-test-date for lth lactation,  is the Oth random regression coefficient of additive genetic effect of kth does in lth lactation on DIM,
  is the oth random regression coefficient of permanent environmental effect of kth does in lth lactation on DIM, np is the number of parameters fitted in days in milk function, βjlo is the oth fixed regression coefficient of jth DIM of lth lactation, Xklmo is the oth dependent trait on DIM, and εijklm is the random residual.
The following (co) variance structure was assumed:
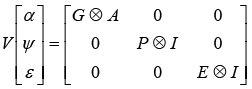
Where: G = genetic covariance matrix between random regression coefficients and traits, A= additive numerator relationship matrix, I= identity matrix, P = permanent environmental covariance matrix among random regression coefficients and traits, and E = residual variance for lactation and assumed to be constant throughout the lactation due to program limitations. Variance-covariance parameters for each of the current longitudinal traits were estimated using the software package, DFREML (Meyer, 1998 Version 3ß). Random regression model used with cubic as the order of polynomial fit that achieved the highest correlations between random regression coefficients. Cubic random regression mostly used in several previous research works. Permanent environmental effect was presented as a ration between permanent environmental variance to total phonotypic variance.
RESULTS AND DISCUSSION
Estimates of heritability ( ) and permanent environmental effect (
 ) for test-day somatic cell score across different stage of lactation presented in Figure (1). Overall heritability estimate for somatic cell was 0.24+0.09. There is a paucity of genetic studies for milk somatic cell count in dairy goats, the authors were not aware of any heritability estimates. Maroteau et al. (2014) found that heritability estimates for SCS were low and ranged from 0.09 to 0.15 in Sannen and Alipne. Based on repeatability test-day model, heritability for SCS in dairy sheep range from 0.04 to 0.17 (Bergonier et al., 2003). The estimates of heritability from this study are in close agreement with estimates of Rupp et al. (2011) in Alpine and Saanen breeds. They concluded that, the higher heritability in goats might be the consequence of a higher true genetic variability.
The highest  obtained during interval between 156 and 170 days in milk (DIM156-170 ) of the 3rd parity (0.31+0.07), while the lowest
  obtained at DIM66-88 of the 1st parity (0.16+0.4). Estimates of
  ranged from 0.16 to 0.28, 0.19 to 0.30 and 0.20 to 0.31 during early, mid and late of lactation, respectively. Estimates of
  varied greatly among early, mid, and late of lactation. Estimates of
  indicated slight continuous reduction towards DIM66-80 (the lowest range: 0.16 to 0.21) and a marked increase from mid lactation upward to the end of lactation (the highest range: 0.30 to 0.31). These results may indicate that selection for improving mastitis resistance could be more effective during end of lactation. Apodaca et al. (2009) found that, heritability for somatic cell score increased from 0.12 to 0.25 from the beginning to the end of the lactation. They suggested that genetic improvement for reducing SCC could be possible by including SCS in selection index. The current estimates of additive genetic variability of SCS are sufficient to implement SCS into a breeding program aimed to increase mastitis resistance.
Overall estimate of permanent environmental effect ( ) was 0.46+0.12 and ranged from 0.31 (during end of the 3rd parity) to 0.64 (during early of 1st parity). In general the highest estimates of permanent environmental effect obtained across the 1st parity. These results indicate to, somatic cell count in dairy goat may controlled by numerous environmental factors. In general, the highest contributions of permanent environmental effect on milk somatic cell score were around mid-lactation (DIM66-80and DIM81-95). This result may indicate that improvement of environmental conditions will assist genetic enhancement of udder health. Estimates of permanent environmental effect of the current study for SCS across different stage of lactation are in agreement with that reported by Apodaca et al. (2009) and higher than that reported by Rupp et al. (2011) on Saanen and Alpine goats.
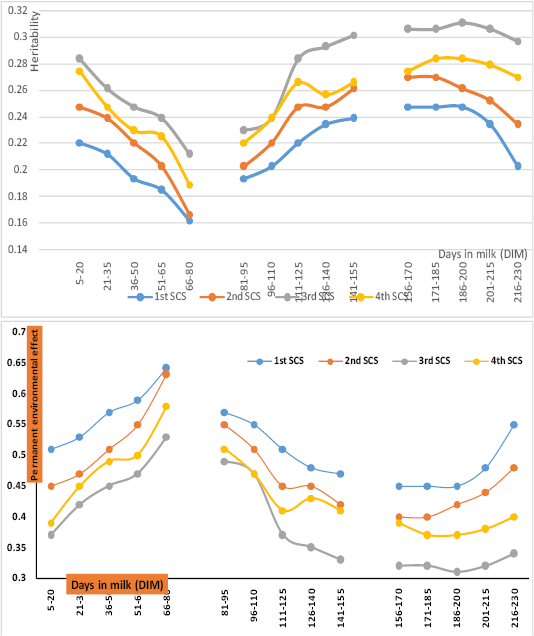
Figure 1: stimates of heritability and permanent environmental effect of test-day somatic cell score (SCS) across stages of early, mid and end of the first four lactation
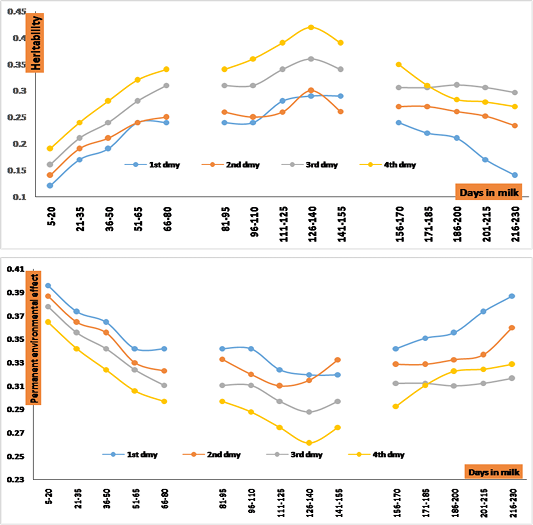
Figure 2: Estimates of heritability and permanent environmental effect of test-day milk yield (TDM) across stages of early, mid and end of the first four lactations.
Increase estimates of permanent environmental effect may be due sometimes for inappropriate management system of animals caring. In addition, available records for all animals are very limited.
Estimates of heritability ( ) and permanent environmental effect (
 ) for test-day milk yield were illustrated in Figure (2). Overall mean for estimates of
  and
and  were 0.27+0.09 and 0.33+0.08, respectively. Estimates of
  and
and  ranged from 0.12 to 0.34, 0.24 to 0.42 and 0.14 to 0.35 and 0.30 to 0.40, 0.26 to 0.34 and 0.29 to 0.39 across early, mid and late of lactation, respectively. Estimates of
  found in the present study are generally in close agreement with estimates reported by Rupp et al. (2011) of the 1st lactation on Alpine and Saanen breeds. Maroteau et al. (2014) found that heritability estimates for test-day milk were 0.24 and 0.22 in Alpine and Saanen goats using single trait repeatability mixed model. Morris et al. (2006) found that heritability for milk yield for Saanen goat in New Zealand was 0.34. On the other hand, estimates of heritability that reported by Mohan et al. (2014) were agreement with results of the current study during early lactation of the first three parities in Black Bengal goats. All estimates of
  increased with progressing DIM during early and mid-lactation, and then decline toward end of lactation. The lowest estimates of
  obtained during early and late of lactation across the first parity. On the other hand, the highest
  obtained during mid-lactation of the fourth parity. Therefor-early genetic selection for improving milk production in this herd may by not possible. On the other side, estimates of
  are very high during early and late of the first lactation. Therefor enhancing environmental conditions during the first lactation could be, assist early selection for daily milk yield (DMY).
Estimates of heritability and permanent environmental effect for some udder-teat traits presented in (Figure 3). Heritability estimates for teat placement rear view and udder depth side view increased with progressing order of lactation from 0.32 to 0.59 and 0.35 to 0.60 for TPRV and UDSV, respectively. The highest heritability for teat size was 0.67 obtained during the 2nd parity and was moderately low during the 4th lactation (0.42).
In general, all suggested udder-teat traits in the current study obtained high heritability. In addition, estimate of permanent environmental effect (Figure 3) for udder-teat trait are small except for teat placement during the first lactation only. There for selection for improving udder-teat traits can achieved during either early of later parities.
Estimates of heritability for teat length and teat placement in the current study are in agreement with that reported in several studies (Manfredi et al., 2001; Clément et al., 2006; Rupp et al., 2011) during the first lactation. On the other hand, Wiggans and Hubbard (2001) found that estimates of heritability for teat placement and teat size were 0.22 and 0.12 for some dairy goats in United states. Mavrogenis et al. (1988) found that heritability estimate for teat length in Chios sheep was (0.64) in the range of the estimates reported in the current study.
CONCLUSION
In the current study, estimates of heritability and permanent environmental effects for somatic cell count, test-day milk yield, and some udder conformation traits in Saudi dairy goats reported. Reducing the loss in production and understanding the mechanism of evaluating the purchased goats either phenotypically or genetically will be of assistance. Early examination for milk somatic cell could be an esteemed tool for predicting and reducing loss caused by mastitis in an early stages of productive live. Dairy goats with abnormal udder form especially for teat characteristics not desired for increasing milk production. The current results suggest that, reducing somatic cell count in goat milk and enhancing udder health could achieved by selection.
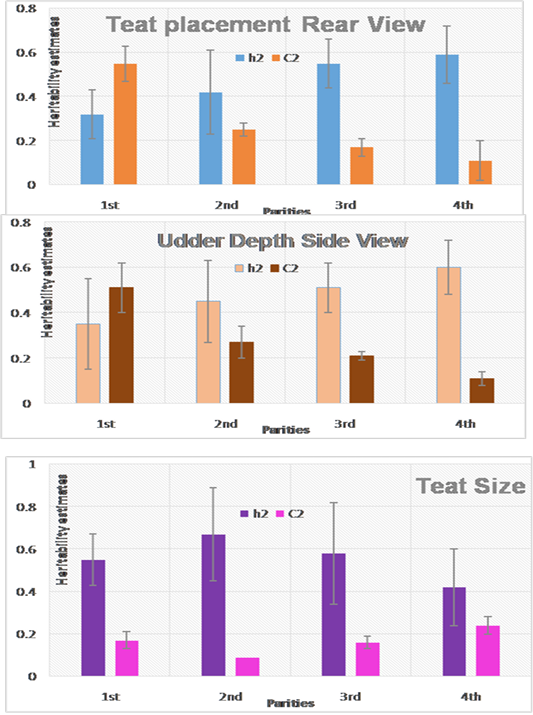
Figure 3: Estimates of heritability and permanent environmental effect for some udder conformation traits in Saudi dairy goats during the first four parities.
ACKNOWLEDGEMENT
My sincere thanks and appreciation to the Scientific Research Deanship - King Faisal University for provide all necessary Martials to consist this study. In addition, my sincere thanks and appreciation to all employees of the training agricultural and veterinary research station - King Faisal University to provide all the services that have contributed significantly to the completion of the search.
Conflict of Interest
No conflicts of interests are declared by author for the contents in this manuscript.
Authors Contribution
Ashraf Amin carried out data collection, genetic analysis of variance and prepare the manuscript. The main team of the KFU Training station of Agricultural and veterinary research provided technical support.
References


