Advances in Animal and Veterinary Sciences
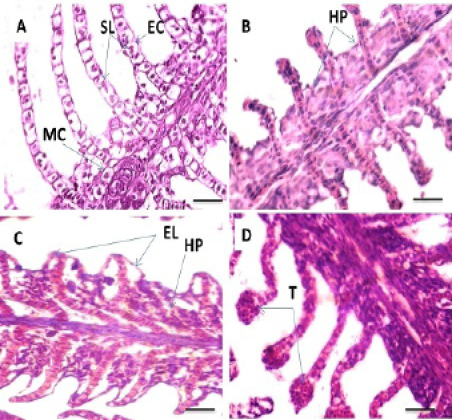
Photomicrograph showing histological structures through gillss of C.carpio exposed to different concentrations of Pb. (A): control gills showing secondary lamellae (SL), epithelial cells (EC) and mucous cells (MC). (B): T1 showing hyperplasia of the epithelial cells (HP). (C&D): T2 demonstrating hyperplasia of the epithelial cells (HP), epithelium lifting (EL) and telangiectasis (T). H&E stain; Thickness 6 μm. Scale bars 50μm.
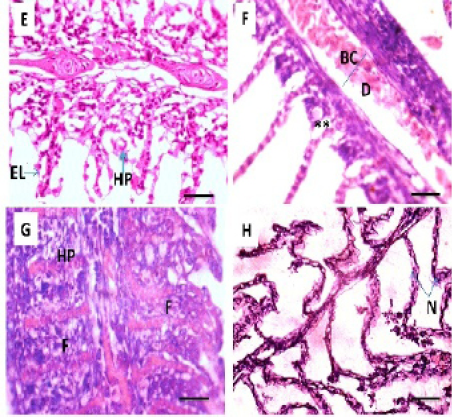
Photomicrograph showing histological structures through gillss of C.carpio exposed to different concentrations of Pb. (E): T3 showing epithelial lifting (EL), hyperplasia of the epithelium (HP). (F, G &H): T4 showing edema in the filamentary epithelium (**), dilation of the central venous (D) with blood congestion, hyperplasia of the epithelium (HP), fusion of the secondary lamellae (F) and necrosis (N) in primary and secondary lamellae. H&E stain; Thickness 6 μm. Scale bars 50μm.
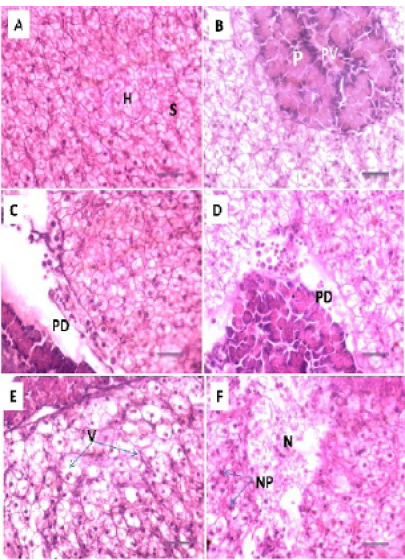
Photomicrograph showing histological structures through liver of C.carpio exposed to different concentrations of Pb. (A& B): control liver showing normal architecture of hepatic cells (H), sinusoids (S), portal vein (PV) with pancreatic tissue (P). (C&D): T1 & T3 showing patchy degeneration (PD). (E& F): T3 &T4 demonstrating cytoplasmic vocuolation (V), necrosis (N) with nuclear piknosis (NP). H&E stain; Thickness 6 μm. Scale bars 50μm.
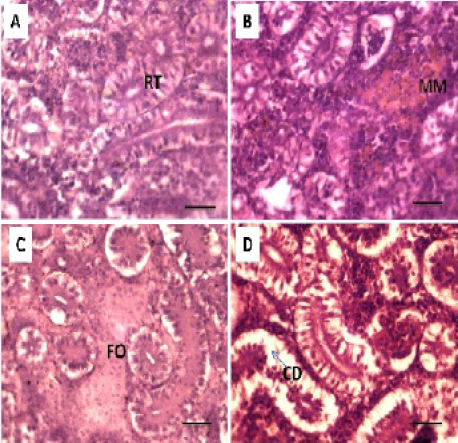
Photomicrograph showing histological structures through kidney of C.carpio exposed to different concentrations of Pb. (A): control kidney showing normal architecture of renal tubules (RT); (B & C): T1 showing hemosiderosis together with melanomacrophage aggregation (MM) with fibrous odematous (FO). (D): T2 showing cellular degeneration of renal epithelium (CD). H&E stain; Thickness 6 μm. Scale bars 50μm.
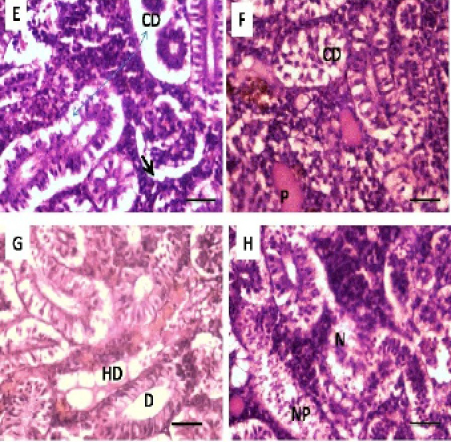
Photomicrograph showing histological structures through kidney of C.carpio exposed to different concentrations of Pb. (E & F): T3 demonstrating cellular degeneration in renal tubules (CD); dialtion of Bowmen’s space (black arrow) with deposition of protein substances in tubules (P); (G & H): T4 showing hydrobic degeneration on (HD) in the form of cytoplasmic vacuolation of the tubular epithelium, dialtion in some of renal tubules (D), necrosis (N) in the tubular epithelium with nuclear piknosis (NP) H&E stain; Thickness μm. Scale bars 50μm


