Advances in Animal and Veterinary Sciences
Research Article
Adv. Anim. Vet. Sci. 5(7): 283-288


Figure 1
A diagram showing the percentages of various clinical signs of seropositive cases in cattle
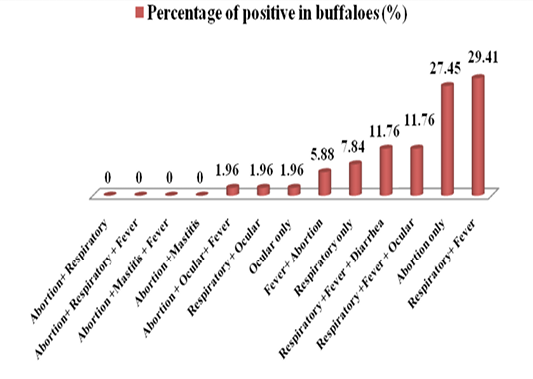
Figure 2
A diagram showing the percentages of various clinical signs of seropositive cases in buffaloes
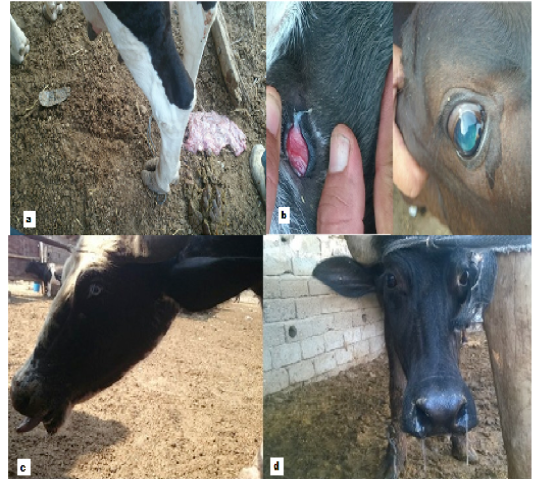
Figure 3
IBR-positive animals showed variant clinical signs (a- Aborted cow, b- Ocular signs, c and d- Respiratory signs)

Figure 4
Agarose gel electrophoresis image that shows the PCR product analysis of BHV 1 gB gene. Where M: DNA molecular weight ladder of 100bp, lane (2-11) positive field samples at 175 bp PCR product, lane 1 positive control and lane 12 negative control.


