Advances in Animal and Veterinary Sciences
Research Article

Socio-Economic Profile of Mithun Farmers of Nagaland
Naresh Prasad1, Jayanta Kumar Chamuah2, Kobu Khate2, Ponraj Perumal2*
1ICAR-Central Institute for Research on Cattle, Meerut, Uttar Pradesh -250 001, India; 2ICAR-National Research Centre on Mithun, Medziphema, Nagaland – 797 106, India.
Abstract | Socioeconomic status is a measurement of economic and social position of an individual in the society. It influences the accessibility to the resources, livelihood pattern, food and nutritional security. The investigation was conducted to review the situation of mithun rearing in Nagaland with the objectives to study the socioeconomic status of mithun farmers and its relationship to the number of mithun reared. Data for the present study was collected from a sample of 100 mithun farmers at four mithun rearing villages of two districts of Nagaland. A multistage random sampling technique was followed for the selection of mithun farmers. Significant percentage of the mithun farmers had medium level of socioeconomic status. Most of them belong to the age group up to 50 years; the agriculture along with animal rearing was their main occupation and education level of the mithun farmers was up to high school. Most of the mithun farmers were found to have low level of social participation, two third families of mithun farmers were nuclear type, had medium to small family and farm size. The houses of mithun farmers were made up of wood to wood and cement (mixed type) construction had medium to low materials possession and also had medium to low education status of family. The mithun farmers had medium annual income from mithun husbandry. It was also observed that the mithun farmers rearing more mithun had more annual income from mithun husbandry and had more total annual income. Relationship between socioeconomic status and number of mithun reared was significant and positively correlated. It was concluded that the mithun farmers were having more number of mithun have high socioeconomic status and vice-versa in mithun rearing area of Nagaland.
Keywords | Socio economic status, Occupation, Mithun farmers, Social participation, Annual income
Editor | Kuldeep Dhama, Indian Veterinary Research Institute, Uttar Pradesh, India.
Received | January 13, 2017; Accepted | March 26, 2017; Published | April 03, 2017
*Correspondence | Ponraj Perumal, ICAR- NRC on Mithun (ICAR), Jharnapani, Nagaland, India; Email: perumalponraj@gmail.com
Citation | Prasad N, Chamuah JK, Khate K, Perumal P (2017). Socio-economic profile of mithun farmers of Nagaland. Adv. Anim. Vet. Sci. 5(4): 148-154.
DOI | http://dx.doi.org/10.14737/journal.aavs/2017/5.4.148.154
ISSN (Online) | 2307-8316; ISSN (Print) | 2309-3331
Copyright © 2017 Prasad et al. This is an open access article distributed under the Creative Commons Attribution License, which permits unrestricted use, distribution, and reproduction in any medium, provided the original work is properly cited.
INTRODUCTION
Socio economic status (SES) is a combined measurement of economic and social position of an individual compared to others in society. It influences the accessibility to the resources, livelihood pattern, food and nutritional security (Naresh Prasad and Perumal, 2016). Mithun is considered to be the pride of North Eastern Hill States of Arunachal Pradesh, Nagaland, Manipur and Mizoram. This animal plays an important role in the socio-cultural, economic and religious life of the tribal people inhabiting the region. Mithun is an indication of social status in which the richness of a person in the society is counted in terms of number of mithun he possesses. Farmers mainly rear mithun for meat purpose. Besides, this animal is also used as marriage gift and sacrificial animal for different social and cultural ceremonies (Rajkhowa et al., 2008; Perumal et al., 2016). Though, at present farmers do not consume its milk, but this animal produces highly nutritious milk. Mithun produces around 1 to 1.5kg milk per day (Nath and Verma, 2000). However, due to gradual denudation of open grazing area in the forest and increasing trend of mithun population, the farmers are facing lots of difficulties in rearing this animal with economic viability. There is an urgent need for scientific intervention for proper management as well as conservation of this animal (Perumal et al., 2015). Scientists of ICAR-NRC on Mithun have worked to meet the demands of the society in terms of mithun meat, milk and leather products. The investigation was conducted to view the situation of mithun rearing in Nagaland with the objective to study the socio-economic status of mithun farmers of Nagaland and its relationship to the number of mithun raised. Economic issues addressed by mithun rearing are financial support, social support and crisis management.
MATERIALS AND METHODS
Districts, blocks, villages and ultimate sample respondents were selected based on the multistage stratified random sampling technique. Two mithun rearing districts, Kohima and Phek were selected for this study. Thereafter, two blocks were selected randomly from each of the selected district. Blocks such as Sechu-Zubza and Tseminyu in Kohima district and Chizami and Sakraba in Phek district were selected. In next stage, one village was selected from each of the selected block namely Khonoma from Sechu-Zubza block, Tseminyu from Tseminyu block, Mesulumi from Chizami block and Porba from Sakraba block was selected randomly. Further, twenty five respondents were selected randomly from each of the selected village and the total respondents were 100.
A suitable interview schedule was developed for mithun farmers. All the selected variables were included in the schedule. The suitable indices were also developed for the measurement of variables. The scale developed by researchers was included in the schedule. The interview schedules, so developed, were pre-tested on similar respondents in non-sample area to work out their reliability and validity. The suitable modification was made in the schedules accordingly. With the help of interview schedule so developed, the data was collected from mithun farmers personally by the researcher at the convenient place and time. Some informal discussion pertaining to the study was also carried out.
After collection of information, the classification and tabulation of data was done keeping in view the objectives of the study. The suitable statistical analysis of data such as mean, standard deviation, frequency, percentages and correlation analysis were applied to draw meaningful inferences. Finally data analyses and documentation were done.
Age Of The Respondent
Age of a respondent was measured in terms of year from birth to time of taking interview. A unit score was assigned for each year of one’s age. On the basis of age (years), the farmers of the study area were classified into three groups namely: young, middle and old.
Socioeconomic Status
It refers to the position of the respondents in the society as determined by various social and economic variables viz. caste, occupation, education level, social participation, family type, family size, land holding size, farm power, house type and material possession. All these variables were measured with the help of socio economic status scale (rural) developed by Trivedi and Pareek (1963) with suitable modifications as per requirements. The total score obtained from the respondents was added up and the farmers were categorized as low, medium and high.
Occupation
Occupation is a means or ways by which a man earns some money for his livelihood. The respondent under investigation has various occupations other than animal rearing activities. These are (1) agriculture, (2) animal rearing, (3) business and (4) service.
Education Level
Education is defined as a process of changing human behaviour in a desired direction. It was measured in terms of one’s year of schooling. One score was given for passing each level in an educational institution. According to the level of education, the farmers were classified into four categories namely illiterate, primary, secondary and above secondary.
Social Participation
This was conceptualized as the degree to which the livestock farmers took active role in various social organizations and social activities. The livestock farmers were asked to mention whether they have membership / participate / official position of any of social/cultural/ cooperatives/ village institution. The respondents were categorized as low, medium and high categories on the basis of participation scores, mean and standard deviation.
Family Size
The family size was measured by the total number of members in the family of a respondent. The family members included the respondent him/herself, wife and husband, children and other dependent members who live and eat together. A unit score was assigned for each member of the family. On the basis of the number of family members, the respondent farmers were classified into three categories namely: small, medium and large.
Farm Size
The farm size was measured by the area of raised land in which the household of the respondent had its entire dwelling including homestead, area under cultivation and others. It was expressed in acre. The total area of land thus obtained has been considered as farm size of the respondent. Depending on the farm size, the mithun farmers were classified into three categories namely small, medium and large on the basis of mean and standard deviation.
House Type
The house type refers to the house made of different type of materials. The house is categorized into four type namely hut, wood, mixed and pucca. It was assigned as scores 1, 2, 3 and 4.
Material Possession
It refers to the materials possess by mithun farmers for household use and agricultural farming purposes. It was bullock cart, bicycle, radio, chairs, leveller, seed drill, thresher, prayer, cultivator, motorbike, television, car and tractor. Depending on the material possession, the mithun farmers were classified into three categories namely low, medium and high.
Family Education Status
Family education status refers to educational status of the family which is expressed in terms of percentage. It was measured by the scale developed by Trivedi (1963).
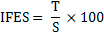
Where:
IFES: Index of Family Education Status; T: Total educational score by adding the educational achievement of each member of the family; S: Effective family size i.e. members of family above six years of age
The mithun farmer was classified as low, medium and high family education status.
Annual Income From Mithun Husbandry
It was measured in terms of cash money earned from the mithun from sale of meat, meat product, by-product and sale of mithun per year. Scoring was done on the basis of figures of cash money i.e. in rupees 1000/-. The respondents were categorized as low, medium and high.
Total Annual Income
Total annual income of a respondent was measured by taking the sum of income earned in a year by the respondent himself and other members of the family in a year from different sources like crop, mithun, others livestock, fisheries and some other non-agricultural sources (business, service etc.). It was expressed in thousand (‘000’) rupees. Depending on the level of income of the farmers, they were classified into three categories namely low, medium and high income.
Number Of Mithun Reared
It refers to the number of mithuns reared by mithun farmers for livelihood. It was measured as number of mithun reared. Depending on the number of mithun reared, the mithun farmers were classified into three categories namely low, medium and high.
RESULTS AND DISCUSSION
Analysis and interpretation of socioeconomic profile of the mithun farmers of Nagaland
Age Wise Classification Of Mithun Farmers
Data presented in Table 1 revealed that majority (67%) of mithun farmers were middle (36-50 years) and young (up to 35 years) followed by old (33%) (above 50 years) age group. In general, the farmers of young and middle aged group were enthusiastic and have more work efficiency.
Moreover, the middle aged people have more family responsibility and sensibility. They work with commitment and involvement. These might be the probable reasons for more number of the respondents to be found in the middle aged group followed by young and old age. This report finding was in line with the findings of Shanthamani (2007).
|
Variables |
Category |
Score range |
Freq. |
Percentage |
|
Age (years) |
Young |
Upto 35 |
31 |
31.00 |
|
Middle |
36-50 |
36 |
36.00 |
|
|
Old |
Above 50 |
33 |
33.00 |
Table 2: Socioeconomic status (N=100)
|
Variables |
Category |
Score range |
Frequency |
%age |
|
Socio-economic status (SES) |
Low |
Upto12 |
15 |
15.00 |
|
Medium |
13-24 |
69 |
69.00 |
|
|
High |
Above 24 |
16 |
16.00 |
|
|
Mean |
18.38 |
|||
|
Std. Dev. |
5.98 |
|||
Socioeconomic Status Of The Mithun Farmers
Survey revealed that the 69 per cent of the mithun farmers having medium socioeconomic status followed by high (16%) and low (15%). The findings were in consonance with the findings of Roy et al. (2013). There were different elements in socioeconomic status such as education, income, social participation, etc (Table 2).
The responses of the farmers were recorded in terms of scores. On the basis of total score, mean score and SD the mithun farmers was classified as low, medium and high.
Caste Of The Mithun Farmers
Category-wise analysis of caste indicated that all (100%) mithun farmers had schedule tribes (Christian) (Table 3).
Occupation Of The Mithun Farmers
Majority (70%) of mithun farmers had agriculture as main occupation followed by animal rearing (22%), service (7%) and only one per cent had business as main occupation. It may be said that farming with wage earning and farming as a sole profession were two main categories to which majority of farmers belonged to their occupation (Table 4).
|
Variables |
Category |
Score range |
Frequency |
%age |
|
Caste |
ST (Christian) |
1 |
100 |
100.00 |
|
Others (SC, OBC, General) |
2 |
0 |
0 |
|
Variables |
Category |
Score range |
Freq. |
Percentage |
|
Occupation |
Agriculture |
1 |
70 |
70.00 |
|
Animal Rearing |
2 |
22 |
22.00 |
|
|
Business |
3 |
1 |
1.00 |
|
|
Services |
4 |
7 |
7.00 |
Education Level Of The Mithun Farmers
It is clear from the below table that the 17 per cent were illiterate. Data also indicated that most (50%) of mithun farmers were found to have secondary level education followed by primary level (30%) and only 3 per cent have above secondary level education. Some studies had shown the similar education level among farmers. There are many reasons for beneficiaries belong to low level education; it could be lack of finance, lack of access to education and further, the utilization of family members as labour after primary school education for farming purpose. However, some of them have completed the above secondary level education and choose farming for their livelihood. The above findings got support from the study conducted by Parvathamma (2006) which revealed that more number of farmers were educated up to high school level (Table 5).
Table 5: Education level (N=100)
|
Variables |
Category |
Score range |
Freq. |
%age |
|
Education level |
Illiterate |
0 |
17 |
17.00 |
|
Primary school |
1 |
30 |
30.00 |
|
|
Secondary school |
2 |
50 |
50.00 |
|
|
Above secondary |
3 |
3 |
03.00 |
Social Participation Of The Respondent
Majority (90%) of the mithun farmers were found to have low level of social participation followed by medium (9%) and only one per cent of mithun farmers were high level (wide public leader) of social participation. Mishra (1979) and Sah (2005) in their study found that majority of the respondents were having medium level of social participation. It may due to fact that they may not be aware about the social participation with organizations or its benefits (Table 6).
Table 6: Social participation (N=100)
|
Variables |
Category |
Score range |
Freq. |
%age |
|
Social participation |
Low |
Below 1 |
90 |
90.00 |
|
Medium |
1-2 |
9 |
9.00 |
|
|
High |
Above 2 |
1 |
1.00 |
|
|
Mean |
0.84 |
|||
|
Std. Dev. |
0.70 |
|||
|
Variables |
Category |
Score range |
Frequency |
Percentage |
|
Family type |
Nuclear |
1 |
66 |
66.00 |
|
Joint |
2 |
34 |
34.00 |
Family Type Of The Mithun Farmers
About two third of mithun farmers had nuclear type of family followed by joint type (34%) of family. Similar trend was observed by Sathyanarayan et al. (2010) (Table 7).
Family Size Of The Mithun Farmers
Majority (55%) of mithun farmers had medium size (5-8 members) of family followed by small (38%) size (up to 4 members) and only 7 per cent had large size (above 8 members) of family. Tripathi and Kunwar (2015) reported that majority of farm women were found to have medium (45.60%) family size (5-8 members) (Table 8).
|
Variables |
Category |
Score range |
Frequency |
%age |
|
Family size |
Small (Upto 4) |
1 |
38 |
38.00 |
|
Medium (5-8) |
2 |
55 |
55.00 |
|
|
Large (Above 8) |
3 |
7 |
7.00 |
|
|
Mean |
1.69 |
|||
|
Std. Dev. |
0.60 |
|||
Farm Size Of The Mithun Farmers
About two third of mithun farmers had medium size (4-8 acre) of farm followed by low (22%) size (up to 4 acre) of farm and only 10 per cent had large (above 8 acre) size of farm (Table 9).
House Type Of The Mithun Farmers
Most of the house of mithun farmers had wood (54%) type to mixed (37%) type and only 5 per cent had pucca type followed by 4 per cent had hut type of house (Table 10).
|
Variables |
Category |
Score range |
Freq. |
%age |
|
Farm size |
Small (1-4 acre) |
Below 2 |
22 |
22.00 |
|
Medium (4-8 acre) |
2 - 4 |
66 |
66.00 |
|
|
Large (Above 8 acre) |
Above 4 |
12 |
12.00 |
|
|
Mean |
2.71 |
|||
|
Std. Dev. |
1.30 |
|||
|
Variables |
Category |
Score range |
Frequency |
Percentage |
|
House type |
Hut |
1 |
4 |
4.00 |
|
Wood |
2 |
54 |
54.00 |
|
|
Mixed |
3 |
37 |
37.00 |
|
|
Pucca |
4 |
5 |
5.00 |
Materials Possession By The Mithun Farmers
Survey data indicated that majority (82%) of mithun farmers had medium level of materials possession followed by high (11%) and low (7%). The similar findings were also reported in other studies. The raise in family income increases the possession of assets since man has no end to his needs and wants. If one need is fulfilled at the same time another need arises. The results of the study of Arun Babu (2005) and Vishvanath Hiremath (2007) were in conformity with the findings of the present study (Table 11).
Family Education Status Of The Mithun Farmers
More than two third of mithun farmers had medium education status of family followed by low (18%) and only 15 per cent had high family education status (Table 12).
Table 11: Materials possession (N=100)
|
Variables |
Category |
Score range |
Frequency |
Percentage |
|
Material possession |
Low |
Below 2 |
7 |
7.00 |
|
Medium |
2 - 9 |
82 |
82.00 |
|
|
High |
Above 9 |
11 |
11.00 |
|
|
Mean |
5.32 |
|||
|
Std. Dev. |
3.85 |
|||
Table 12: Family education status (N=100)
|
Variables |
Category |
Score range |
Frequency |
Percentage |
|
Family education status |
Low |
Upto 1.04 |
18 |
18.00 |
|
Medium |
1.05 - 2.34 |
67 |
67.00 |
|
|
High |
Above 2.34 |
15 |
15.00 |
|
|
Mean |
1.69 |
|||
|
Std. Dev. |
0.65 |
|||
Income From Mithun Husbandry
More than half of the mithun farmers had medium income (Rs.27000-50000) from mithun husbandry followed by high (above Rs.50000) to low (upto Rs.26000) income from mithun husbandry (Table 13).
Total Annual Income Of The Mithun Farmers
Seventy five per cent of mithun farmers were found to have low (upto 1.5 lakh) to medium (1.5-3 lakh) level of total annual income followed by high (above 3 lakhs) level (25%) of total annual income. Other studies also presented the similar kind trend of income in their study (Table 14).
Table 13: Income from mithun husbandry (N=100)
|
Variables |
Category |
Score range |
Frequency |
%tage |
|
Annual income from mithun husbandry (000) |
Low |
Upto 26 |
19 |
19.00 |
|
Medium |
27- 50 |
51 |
51.00 |
|
|
High |
Above 50 |
30 |
30.00 |
Table 14: Total annual income (N=100)
|
Variables |
Category |
Score range |
Freq. |
Percentage |
|
Total annual income (000) |
Low |
Upto 100 |
38 |
38.00 |
|
Medium |
101-200 |
37 |
37.00 |
|
|
High |
Above 200 |
25 |
25.00 |
Number Of Mithun Reared By The Mithun Farmers
Majority (75%) of mithun farmers had medium number (3-8) of mithun reared followed by large (above 8) and small number (up to 2) of mithun reared. The similar findings were also reported in other studies. It was also observed that the mithun farmers raising more mithun had more income from mithun husbandry and had more total annual income (Table 15).
Table 15: Number of mithun reared (N=100)
Variables |
Category |
Score range |
Frequency |
%age |
Number of mithun reared |
Small |
Upto 2 |
13 |
13.00 |
Medium |
3-8 |
75 |
75.00 |
|
Large |
Above 8 |
12 |
12.00 |
|
Mean |
5.45 |
|||
Std. Dev. |
3.06 |
|||
Relationship Of Independent Variables With Number Of Mithun Reared By Mithun Farmers
To determine the relationship of independent variables with the dependent variables, the data were subjected to correlation analysis. The correlation analysis highlighted that the annual income from mithun husbandry and total annual income were found to be positive and highly significant correlation with number of mithun reared whereas age was negative and non-significantly correlated. This indicated that the mithun farmers having more mithun had more annual income from mithun husbandry and also had more total annual income (Table 16).
Table 16: Relationship between independent variables with number of mithun reared by mithun farmers
|
Sl. No. |
Variables |
Correlations with number of mithun |
|
1 |
Age |
-0.131 |
|
2 |
Socio-economic status |
0.244* |
|
3 |
Occupation |
0.154 |
|
4 |
Education level of the respondents |
0.094 |
|
5 |
Social participation |
0.036 |
|
6 |
Family type |
0.164 |
|
7 |
Family size |
0.127 |
|
8 |
Farm size |
0.066 |
|
9 |
House |
0.008 |
|
10 |
Material possession |
0.245* |
|
11 |
Family education status |
0.245* |
|
12 |
Annual Income from Animal Husbandry |
0.458** |
|
13 |
Total annual income |
0.315** |
*: Correlation is significant at the 0.05 level; **: Correlation is significant at the 0.01 level
Table 17: Relationship between independent variables with annual income and total annual income of mithun farmers
Sl. No. |
Variables |
Annual income from mithun husbandry (r) |
Total annual income (r) |
1 |
Age |
-0.167 |
-0.012 |
2 |
Socio-economic status |
0.190 |
0.215* |
3 |
Occupation |
0.325** |
0.130 |
4 |
Education of respondent |
0.172 |
0.136 |
5 |
Social participation |
0.089 |
0.031 |
6 |
Family type |
0.275** |
0.176 |
7 |
Family size |
0.216* |
0.147 |
8 |
Farm size |
0.281** |
0.182 |
9 |
House |
0.167 |
0.274** |
10 |
Material possession |
0.083 |
-0.017 |
11 |
Family education status |
0.373** |
0.348** |
12 |
Herd size |
0.534** |
0.395** |
13 |
Annual income from mithun husbandry |
1 |
0.503** |
14 |
Total annual income |
0.503** |
1 |
15 |
Number of Mithun |
0.315** |
0.458** |
*: Correlation is significant at the 0.05 level; **: Correlation is significant at the 0.01 level
However, the socioeconomic status, material possession and family education status of mithun farmers were found to have positive and significant correlation with number of mithun reared whereas occupation, education level of the respondents, social participation, family type, family size, farm size, house type had positive and non-significant correlation with number of mithun raised. Relationship between socioeconomic status and number of mithun reared was significant and positively correlated. It revealed that the mithun farmers having more mithun have high socio-economic status and vice-versa.
Relationship Between Independent Variables With Annual Income From Mithun Husbandry And Total Annual Income Of Mithun Farmers
A perusal of data in the Table 17 indicated that occupation, family type, farm size, family education status, herd size, total annual income and number of mithun raised had positive and highly significant correlation with annual income from mithun husbandry, family type had positive and significant correlation whereas socioeconomic status, education of respondent, social participation, house type and material possession had positive and non-significant correlation and age had negative and non-significant correlation with annual income from mithun husbandry of mithun farmers.
The data presented in Table 17 also revealed that house type, family education status, herd size, annual income from mithun husbandry and number of mithun raised had positive and highly significant correlation with total annual income from all sources, socioeconomic status had positive and significant correlation whereas occupation, education level of the respondents, social participation, family type, family size and farm size had positive and non-significant correlation and age, material possession had negative and non-significant correlation with total annual income from all sources of mithun farmers.
CONCLUSION
Mithun rearing is a source of income generation. Social status is correlated with mithun rearing. The people who rear mithun are village people having medium to high socio economic status. Present day relevance of mithun as an economic component of the system. Mithun farmers who were rearing more mithun have more socio-economic status and also have more income from animal husbandry. Survey revealed that the mithun farmers were mostly of the age group of below 50 years with medium to low socio-economic status; agriculture along with animal rearing as their main occupation, education status up to high school and average income from Animal Husbandry. It was also observed that the mithun farmers raising more mithun had more income from Animal Husbandry, had more total income (more than Rs. 200000) and had high socio-economic status. Correlation analysis between annual income from Animal Husbandry and number of mithun was raised were highly significant and positively correlated and total annual income of mithun farmers were also highly significant and positively correlated with number of mithun raised. This indicates that mithun farmers having more mithun have more income from Animal Husbandry and also have more total annual income. Relationship between socio-economic status and number of mithun raised was significant and positively correlated. It revealed that the mithun farmers having more mithun have high socio-economic status and vice-versa.
CONFLICT OF INTEREST
None of the authors have any conflict of interest to declare.
AUTHOR’S CONTRIBUTION
Naresh Prasad: Plan of work, execution, analysis of data and manuscript preparation. Ponraj Perumal: plan of work, technical assistance, analysis of data and manuscript preparation. Kobu Khate: technical assistance and analysis of data. Jayanta Kumar Chamuah: manuscript preparation, analysis of data and correction.
REFERENCES


