Advances in Animal and Veterinary Sciences
Research Article

Effect of Citric and Acetic Acid Water Acidification on Broiler’s Performance with respect to Thyroid Hormones Levels
Heba Mohammed Ahmed Abdelrazek1*, Said Mahmoud Moustafa Abuzead1, Saadia Abdel-Fatah Ali1, Hala Mohammed Ali El-Genaidy 2, Samah Ahmed Abdel-Hafez3
1Department of Physiology, Faculty of Veterinary Medicine, Suez Canal University, Ismailia, Egypt; 2Department of Pathology, Animal Health Research Institute (AHRI), Ismailia, Egypt; 3Department of Physiology and Biochemistry, Animal Health Research Institute (AHRI), Ismailia, Egypt.
Abstract | The current study investigated the effects of water acidification (pH 4.5) on broilers’ performance judged by thyroid hormones modulation. A total 132 Cobb broiler chicks were equally divided into 4 groups; control group (C-gr), citric acid group (CA-gr), acetic acid group (AA-gr) and combination group (CO-gr). Control received tape water and other treatment groups received acidified drinking water (pH 4.5) by CA, AA, and a mixture of 1:1 AA and CA, respectively. Live body weight (LBW), feed consumption, feed conversion ratio (FCR), pH values of small intestine, edible organs weight, serum thyroid hormones, and lipid profile were determined. Liver, small intestine histopathology, and villi morphometry were performed. The LBW was significantly (P<0.5) improved in CA-gr while reduced in AA-gr than control. Feed consumption was significantly (P<0.5) reduced in all treated groups than C-gr. The FCR was significantly (P<0.05) improved in CA-gr and Co-gr than C-g and AA-gr. The AA significantly (P<0.05) reduced liver weight while CA increased heart weight than control. Gizzard weight was significantly (P<0.05) increased in all treatments groups than control. The CA-gr and Co-gr significantly (P<0.05) elevated serum T3 level than C-gr and AA-gr. While Serum T4 level was significantly (P<0.05) elevated in all experimental groups than C-gr. Lipid profile showed significant (P<0.05) improvement in all treated groups than C-gr. Intestinal morphometry was significantly (P<0.05) increased in CA-gr and CO-gr. Water acidification by CA (pH 4.5) improved poultry performance via modulating gut, liver health and thyroid hormones with respect to lipid profile while AA gave adverse effects.
Keywords | Broilers, Lipid profile, T3, T4, Organic acids
Editor | Kuldeep Dhama, Indian Veterinary Research Institute, Uttar Pradesh, India.
Received | May 11, 2016; Accepted | May 11, 2016; Published | May 31, 2016
*Correspondence | Heba MA Abdelrazek, Department of Physiology, Faculty of Veterinary Medicine, Suez Canal University, Ismailia, Egypt; Email: hebaadelrazekvet@gmail.com
Citation | Abdelrazek HMA, Abuzead SMM, Ali SA, El-Genaidy HMA, Abdel-Hafez SA (2016). Effect of citric and acetic acid water acidification on broiler’s performance with respect to thyroid hormones levels. Adv. Anim. Vet. Sci. 4(5): 271-278.
DOI | http://dx.doi.org/10.14737/journal.aavs/2016/4.5.271.278
ISSN (Online) | 2307-8316; ISSN (Print) | 2309-3331
Copyright © 2016 Abdelrazek et al. This is an open access article distributed under the Creative Commons Attribution License, which permits unrestricted use, distribution, and reproduction in any medium, provided the original work is properly cited.
Introduction
In applied physiology, growth and nutrition are closely related and complementary subjects. Applying different strategies about this relation could improve animal production (Rahmani and Speer, 2005). For the achievement of optimum broilers performance, the producers have to search for alternative promoters, especially with the ban of using the antibiotic growth promoters (Fascina et al., 2012). The usage of antibiotics in rations of livestock had led to resistance of pathogenic bacteria even in human (Langhout, 2000). Thus, the researchers developed physiological additives such as acidifiers, prebiotics, and probiotics to raise immunity and improve performance. These additives help in the development of normal physiological functions in animals or meet their deficiencies (Huyghebaert, 2005; Khan and Iqbal, 2016).
Organic acids are weak acids, which modulate the intestinal pH. When these compounds are used correctly along with good nutritional, management and biosecurity measures. They could be a powerful tool in maintaining the health of the gastrointestinal tract (GIT) in poultry thus improving the performance (Huyghebaert et al., 2011). Moreover, feeding organic acids is thought to have several positive effects such as improving protein digestion (Emami et al., 2013), feed conversion ratio (FCR), growth performance, immunity (Chowdhury et al., 2009; Khan and Iqbal, 2016) and enhancing mineral absorption (Nourmohammadi et al., 2012; Wickramasinghe et al., 2014). Citric acid (CA) and acetic acid (AA) have been used in diets due to their positive effect on birds’ health and growth (Islam et al., 2008).
The production of broilers in the poultry industry lasts only 35-42 days, one would expect that thyroid hormones should play a vital role during this period (Darras et al., 2000). Thyroid hormones (THs) including, triodothyronine (T3) and tetraiodothyronine (T4), have multiple effects on vertebrate metabolism and development through binding to a nuclear and mitochondrial thyroid hormone receptors. They have a wide range of metabolic effects through monitoring the basal metabolic rate. Beneficial effects of dietary additives, especially organic acids, on poultry energy and protein utilization have been reported (Pirgozliev et al., 2008), but few data were available concerning their effect through modulation of thyroid hormone levels.
Therefore, current study aimed to investigate the effect of water acidification using CA, AA, and their combination on broilers’ growth performance through determination of their effect on live body weight (LBW), feed intake (FI), feed conversion ratio (FCR) and edible organs weight. In addition to estimation of poultry energy status judged by thyroid hormones (T3 and T4) level and serum lipid profile parameters. As well as histopathological and morphometric changes in different segments of intestine.
Material and methods
Birds and Management
A total number of 132 one-day-old Cobb 500 broiler chicks of both sexes, weighing 48- 53 g were purchased from Ismailia-Misr Poultry Company, Egypt. Chicks were left in a good ventilated clean place with temperature range (32- 35oC). Electric bulbs were used as a source of light and electrical heaters were used to adjust the temperature. The light was provided to chicks around the whole day length (24 hours). Chicks were vaccinated against Newcastle disease (ND) as well as Infectious Bursal Disease (Gumboro) during the experimental period as routine. All birds were treated in accordance with the birds use protocol approved by Faculty of Veterinary Medicine, Suez Canal University.
Experimental Diet
Experimental birds offered 2 rations (starter, from 1-17 days of age and finisher, from 18– 35 days of age). Both diets were formulated to meet the nutrient requirements of broiler chicks according to NRC (1994).
Experimental Design
One-day-old experimental chicks were randomly divided into 4 groups, 33 chicks in each. The control group (C-gr) received basal diet and tap water. Citric acid group (CA-gr) received basal diet and acidified drinking water (pH 4.5) (Açıkgözet et al., 2011) with CA monohydrate (Sigma, Australia). Acetic acid group (AA-gr) received basal diet and acidified drinking water of pH= 4.5 (Açıkgözet et al., 2011) with AA (El Gomhoria Co., Egypt). A combination group (Co-gr) received basal diet and acidified drinking water (pH 4.5) (Açıkgözet et al., 2011) with a mixture of 1:1 AA and CA. The treatments continued for 35 days. Both feed and water were allowed to experimental birds ad libitum.
Body weight and body weight gain of each bird were determined weekly according to Brady (1968). The feed consumption (g/ week) was calculated per group by obtaining sum difference between the weight of offered feed and the remained portion for 7 days. Feed conversion ratio (FCR) was calculated weekly.

Blood Sampling
Wing vein blood samples were drawn from overnight fasted 15 days old chicks (Scheele et al., 2003) and at the end of the experiment for sera production, which were stored at –20oC until hormonal and lipid profile assay.
pH Values for different Segments of Intestine
Contents (10 g) from duodenum, jejunum and ileum were collected in 90 ml sterilized physiological saline under aseptic condition (1:10 dilution). The pH values were measured immediately by using a digital pH meter (Al-Natour and Alshawabkeh, 2005).
Edible Organs Weight
At the end of the experimental period and after slaughtering of chicks, edible visceral organs (heart, liver, and gizzard) were taken, cleaned and weighed.
Thyroid Hormones
Serum levels of T3 and T4 were determined by commercial enzyme-linked immunoassay kits (Taytec Incorporation, Canada) according to manufacturer’s protocol.
Lipid Profile
The levels of high-density lipoprotein cholesterol (HDL-c),
Table 1: Effect of organic acids (CA, AA and their combination) on LBW (g), feed consumption (g) and FCR of Cobb broiler chicks
|
C-gr |
CA-gr |
AA- gr |
Co-gr |
||
|
Live body weight (g) |
1st w |
98.40±0.87a |
98.98±1.03a |
100.31±1.22a |
95.91±1.33a |
|
2nd w |
281.97±5.32a |
268.7±5.22a |
281.53±4.53a |
267.41±5.80a |
|
|
3rd w |
623.43±11.91a |
627.97±9.53a |
606.33±15.42a |
588.12±14.18a |
|
|
4th w |
1050.67±17.95a |
1106.10±14.85a |
972.00±24.71b |
1038.17±22.89ab |
|
|
5th w |
1593.12±27.79a |
1738.12±31.91b |
1361.21±37.00c |
1473.33±32.54ac |
|
|
Feed Consumption (g/week) |
1st w |
128.7±0.88d |
133.70±0.88c |
138.70±0.88b |
143.70±0.88a |
|
2nd w |
221.30±28.01a |
216.30±28.02a |
233.00±41.02a |
306.30±28.02a |
|
|
3rd w |
636.01±6.10b |
635.00±7.61b |
686.30±4.14a |
601.70±7.98a |
|
|
4th w |
924.02±5.81c |
967.00±2.89a |
989.00±2.90a |
1000.11±2.92a |
|
|
5th w |
1133±57.7b |
1093.21±40.51b |
1135.31±41.16b |
1495.00±66.10a |
|
|
Feed conversion ratio (FCR) |
1st w |
2.70±0.06a |
1.90±0.06b |
1.77±0.05b |
1.91±0.04b |
|
2nd w |
1.80±0.06a |
1.62±0.01a |
2.65±0.03b |
1.80±0.03a |
|
|
3rd w |
1.90±0.08ab |
1.60±0.06a |
2.00±0.17b |
1.81±0.01a |
|
|
4th w |
1.96±0.09a |
1.59±0.02b |
2.30±0.91c |
1.70±0.02ab |
|
|
5th w |
1.98±0.05a |
1.61±0.04b |
2.30±0.04a |
1.70±0.04ab |
|
Values are means ± standard error (SE); Values within the same row with different superscripts (a,b &c) indicate significant difference at (P<0.05)
triglycerides (TGs) and total cholesterol (TC) were calorimetrically measured using commercial kits (Diamond, Egypt). Serum low density lipoprotein cholesterol (LDL-c) was determined via enzymatic calorimetric kits (QCA Co., Spain) according to Galler et al. (2007).
Histopathological Examination
Part of each segment of small intestine and liver were taken immediately after slaughter and fixed in 10% formalin saline for 24 hours. Routine histological laboratory methods were performed and 5-μm thickness sections were stained with hematoxylin and eosin (Gridley, 1960). Morphometric analysis for intestinal villus height (VH, μm) and crypt depth (CD, μm) were carried out by Image J software (Rasband, 1997). The VH was measured from the villus top to the lamina propria whereas CD was determined as the depth of the invagination between two adjacent villi (Iji et al., 2001).
Statistical Analysis
All the obtained data were subjected to One-way analysis of variance(ANOVA) followed by Duncan’s multiple range test using SPSS software (SPSS for Windows, version 16, USA) according to (Coakes and Steed, 2009).
Results
Table 1 demonstrated that LBW was non-significantly altered in 1st, 2nd and 3rd weeks of treatments. While in the 4th week LBW, AA-gr showed significant (P<0.05) reduction when compared with C-gr and CA-gr. However, after 5 weeks of treatments, LBW of CA-gr was significantly (P<0.05) higher than the control and other treatments groups. Meanwhile, AA-gr showed significant (P<0.05) reduction as compared with both the C-gr and the CA-gr.
During the first week of treatments, feed consumption was significantly (P<0.05) reduced in all treated groups when compared with the control. In the 2nd week, there was no significant difference observed in chicken feed consumption among groups. After the 3rd and 4th week of treatments, both AA-gr and CO-gr induced a significant (P<0.05) reduction in feed consumption than control and CA-gr. At the last week of treatments a significant (P<0.05) reduction in feed consumption was observed in all treated groups as compared to control (Table 1).
Feed conversion ratio demonstrated a significant (P<0.05) reduction in all experimental groups as compared with control after the 1st week of treatments. However, at 2nd week, there was a significant (P<0.05) increase in AA-gr FCR than the control and, other treatments groups. At the end of the 3rd week of treatments, there was a significant (P<0.05) reduction in CA-gr and CO-gr as compared with AA-gr. After the 4th week there was significant (P<0.01) increase in the AA-gr FCR than the other groups. Meanwhile, there was significant (P<0.05) reduction in the CA-gr FCR than control. At the last week of treatments FCR showed a significant (P<0.05) reduction in CA-gr FCR than control and AA-gr (Table 1).
Liver weight was significantly (P<0.05) reduced in AA-gr than CA and CO-gr. While gizzard weight showed a
Table 2: Effect of organic acids (CA, AA and their combination) on edible organs weight (g), intestinal pH, villi length (µm) and crypts depth (µm) of Cobb broiler chicks
|
C-gr |
CA-gr |
AA- gr |
Co-gr |
||
|
Edible organs weight |
Liver |
44.40±2.41ab |
49.60±2.31a |
35.81±1.50b |
44.71±1.40a |
|
Gizzard |
23.50±1.21b |
31.00±1.70a |
31.21±2.20a |
31.56±2.40a |
|
|
Heart |
7.70±0.50a |
10.30±0.60b |
8.10±0.60ab |
7.34±0.40a |
|
|
Intestinal pH |
Duodenum |
5.76±0.06 a |
5.70±0.07 a |
5.60±0.03 a |
5.65±0.04 a |
|
Jejunum |
6.54±0.04 a |
6.42±0.07 a |
6.40±0.06 a |
6.44±0.03 a |
|
|
Ileum |
7.74±0.05 a |
7.53±0.04 a |
7.45±0.02 a |
7.41±0.05 a |
|
|
Morphometric analysis |
Villus length |
171.61±5.28a |
225.70±7.65b |
181.10±4.49a |
245.60±5.74b |
|
Crypts depth |
40.00±2.33a |
60.51±2.86b |
37.50±2.52 a |
50.91±1.98c |
|
Values are means ± SE; Values within the same row with different superscripts (a,b &c) indicate significant difference at (P<0.05)
Table 3: Effect of organic acids (CA, AA and their combination) on serum T3 (ng/ml), T4 (ng/ml), HDL-c (mg/dl), LDL-c (mg/dl), TC (mg/dl) and TG (mg/dl) of Cobb broiler chicks
|
C-gr |
CA-gr |
AA- gr |
Co-gr |
||
|
T3 |
2 w |
4.00±0.11a |
4.92±0.11b |
3.94±0.14a |
4.42±0.14ab |
|
5w |
4.24±0.08b |
5.16±0.16a |
4.65±0.15ab |
4.99±0.12a |
|
|
T4 |
2 w |
0.49±0.00ab |
0.50±0.01b |
0.47±0.01a |
0.50±0.00ab |
|
5w |
0.48±0.00b |
0.50±0.01a |
0.49±0.00a |
0.50±0.00a |
|
|
TC |
2 w |
184.02±4.50a |
164.01±8.50ab |
148.30±5.50b |
167.00±2.60ab |
|
5w |
140.02±2.04a |
100.01±8.17 b |
85.00±6.12 b |
90.00±4.08 b |
|
|
TG |
2 w |
120.00±5.60a |
113.33±4.12ab |
98.31±2.30b |
113.00±1.00ab |
|
5w |
120.80±2.04a |
73.11±1.22b |
63.11±1.23b |
63.20±1.23b |
|
|
HDL-c |
2 w |
120.30±6.91a |
108.31±4.80a |
100.01±7.51a |
103.00±1.21a |
|
5w |
40.00±1.29 a |
65.00±2.06 b |
63.00±1.23 b |
55.00 ±2.39 b |
|
|
LDL-c |
2 w |
39.71±4.31a |
33.00±3.21a |
28.70±2.40a |
41.31± 1.70a |
|
5w |
76.00±1.03a |
20.01±0.71b |
9.00±1.05c |
22.00±0.89b |
|
Values are means ± SE; Values within the same row with different superscripts (a,b &c) indicate significant difference at (P<0.05)
significant (P<0.05) increment in all treated groups as compared with the C-gr. Heart weight revealed significant (P<0.05) increase in the CA-gr than the C-gr and the CO-gr (Table 2).
The effect of water acidification on pH values of different segments of GIT showed no significant differences.
On the 2nd week, CA induced significant (P<0.05) increase in serum T3 concentration than the C-gr and the AA-gr. While T4 was significantly (P<0.05) elevated in CA-gr than AA-gr. However, in the 5th week the CA-gr and the Co-gr showed significant (P<0.05) elevation in serum T3 concentration than the C-gr. While serum T4 concentration significantly (P<0.05) elevated in all experimental groups than the C-gr (Table 3).
Table 3 demonstrated that TC and TGs were significantly (P<0.05) decreased in the AA-gr than the C-gr. However, HDL-c and LDL-c showed no significant changes in all experimental groups at the 2nd week. At the end of experimental period, TC and TGs showed a significant (P<0.05) reduction in the CA-gr, theAA-gr and the CO-gr than control. However, HDL-c was increased significantly (P<0.05) in all treated groups than control at the 5th week only. LDL-c showed significant (P<0.05) reduction in all treatments groups when compared to the control at the 5th week only.
Histomorphometric examination revealed an increase in both villus length and width, in addition, to increasing in crypt depth of small intestine of CA-gr and CO-gr compared to control and acetic acid groups (Figure 1). The morphometric analysis of intestinal villi length and crypts depth revealed a highly significant (P<0.05) increase in villus length in both CA-gr and CO-gr than the C-gr and the AA-gr. Moreover, crypt depth showed a highly significant (P<0.05) increase in CA-gr than other groups while CO-gr showed significant (P<0.05) increase in crypt depth than control and AA groups (Table 2). Goblet cell number per unit area of small intestine increased in birds treated with CA acidified water in comparison with control birds. The AA-gr showed tearing and sloughing of the intestinal mucosa (Figure 1C).
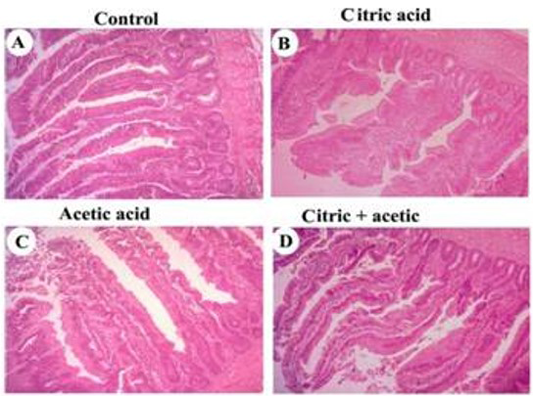
control (A), citric acid (B), acetic acid (C) and citric+acetic acid (D) groups. Citric acid and citric+acetic groups showed an improvement in villus height and width. Goblet cells number per unit area of small intestine was increased in citric acid and citric+acetic acid groups. Acetic acid group showed degeneration and sloughing of intestinal mucosa. Hematoxylin and eosin stain (H&E stain). X100
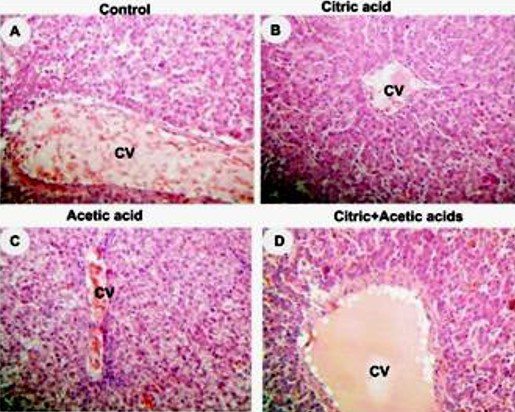
control (A), citric acid (B), acetic acid (C) and citric+acetic acid (D) groups. Citric acid and combination groups showed normal hepatocytes architecture. Acetic acid group showed congestion in central vein (CV), hypremia and hydrobic degeneration in hepatocytes around CV. Hematoxylin and eosin stain (H&E stain). X250
Liver histopathology showed hyperemia and hydropic degeneration in acetic acid group (Figure 2C) while citric acid and combination groups showed normal architecture of liver parenchyma (Figure 2D).
Discussion
Organic acids have been added to feed or drinking water of poultry flocks to improve production or to reduce the spread of diseases. Despite increasing number of studies, there is still a long way to a firm knowledge on the biological potency of water acidification by organic acids in improving poultry performance. Improved body weight and FCR could be achieved by physiological interventions of thyroid hormones especially T3 that influence all major metabolic pathways. In this study, the potential effect of CA, AA and their combination as water acidifiers on broilers body weight, feed consumption, FCR, edible organs weight, intestinal pH, serum T3 and T4 and lipid profile (TC, TGs, HDL-c and LDL-c) were evaluated as well as the histopathological examination of liver and intestine.
Concerning broilers LBW, AA-gr showed significant (P<0.05) reduction in LBW than the C-gr and the CA-gr on 4th W of the experiment. However, in the last week (5thW) of treatments LBW of CA-gr was significantly higher (P<0.05) than the C-gr and the AA-gr. While the AA-gr showed significant (P<0.05) reduction in LBW than the C-gr and the CA-gr. The improvement in LBW are in accordance with results of Abdel-Fattah et al. (2008), Chowdhury et al. (2009), Saki et al. (2011), (2014), Wickramasinghe et al. (2014) and Mohamed et al. (2016). While the reduction by AA in LBW coincided with Attia et al. (2013). The improved body weight in birds supplemented with CA may be due to improved utilization of minerals (Boling et al., 2000; Chowdhury et al., 2009), protein and amino acids digestibility (Kirchgessner and Roth, 1988) that is manifested by healthier gut epithelium. Moreover, the significant (P<0.05) increase in villus height and crypt depth in CA-gr allowed more surface area for nutrient absorption (Kaya et al., 2015). The more powerful effect of CA could be attributed to citrate, which is the conjugate base of citric acid that involved in the physiological oxidation of acetate from fats, proteins, and carbohydrates. The acetate from these macronutrients is converted into the intracellular energy of ATP, as well as the common by-products water and carbon dioxide. This chemical reactions series is central to nearly all metabolic reactions and is the source of about two-thirds of the energy derived from in higher organisms (Evans and Ratledget, 1985) which are manifested by the improved liver microscopic picture (Figure 2). Another explanation for the improved LBW may be due to closely associated enhancement in the thyroid gland activity that is manifested here by the elevated level of T3 and T4 which supported by the findings of El-Hakim et al. (2009).
The decrement in LBW in AA-gr might be due to the strong taste of acetic acid water that might reduce feed and water consumption that was demonstrated in the 1st, 3rd, 4th and 5th week of the experiment. The reduction in feed intake consequently reduced growth performance of broilers (El-Hakim et al., 2009). Moreover, AA caused various degrees of degeneration and sloughing of hepatic and intestinal cells that impede absorption and subsequent growth rate of broilers which coincide with Attia et al. (2013). Consequently, FCR was significantly improved in CA-gr and CO-gr while worsen in AA-gr may be due to the incrimination of CA metabolites, as metabolic intermediate, in several metabolic pathways in appositive manner that decreased the amount of feed to weight gain ratio. Also, this effect was reflected on the effect of CA in improvement of edible organs weight especially gizzard and heart. These results were in agreement with those of Nourmohammadi et al., (2010), (2011).
Results of the current study, at the 2nd week of the experimental period, the CA-gr revealed significant (P<0.05) elevation in serum T3 concentration than the C-gr and the AA-gr. While T4 was significantly (P<0.05) elevated in CA-gr than AA-gr. However, at the 5th week, the CA-gr and the Co-gr significantly (P<0.05) elevated serum T3 concentration than control and AA-gr while serum T4 concentration significantly (P<0.05) elevated in all experimental groups than control. These results were similar to those obtained by Abdel-Fattah et al. (2008), Nourmohammadi et al. (2011) and Kamal and Ragaa (2014). Current results suggested superior metabolic and growth performance due to the addition of acidifiers into broiler chicks’ diet that was reflected on the improved body weight and feed conversion, especially in CA-gr. These effects could be achieved by physiological interventions of thyroid hormones especially T3 that influence all major metabolic pathways. Where, T3 binds to the thyroid hormone receptors in poultry with higher affinity compared with T4, which is considered to be a pro-hormone (Darras et al., 2000; Decuypere et al., 2005). Their most obvious and well-known action to increase the basal energy expenditure by acting on protein, carbohydrates and lipid metabolism with special regard to lipid metabolism, thyroid hormones can affect biosynthesis, mobilization, and biodegradation of lipids, although degradation is influenced more than synthesis. They favour lipolysis in the adipose tissue resulting in a decrease in plasma cholesterol content as noticed here and they may have an indirect effect on lipogenesis (Pucci et al., 2000). Hyperthyroidism and peripheral conversion of T3 to T4 could signify better and lower lipid profile parameters TC, TGs and LDL-c especially at the end of the experimental period with improved growth performance parameters (Sturkie, 1986). Moreover, thyroid hormones could stimulate protein synthesis (Todini, 2007) and enhance the rate of glucose oxidation and intestinal absorption. They increase liver gluconeogenesis through gene activation (Eshratkhah et al., 2010; Yen et al., 2003).
Taking together all the above mentioned data; it is clear that CA had more powerful effect in promoting broilers growth that is mediated by various effects; among which it act as acidifier on gut mucosa and activity and chemical mediator in metabolic pathways inside the body. Moreover, it could modulate thyroid hormones (especially T3) that interplays with different metabolic and pathways inside the body. On the other, hand AA gave retrograde results due to its adverse effects on gut health and liver integrity while combination group sat on the border line of improvement to these parameters.
Conclusion
The addition of CA to broilers water (pH 4.5); improved and promoted broilers’ growth performance via modulating gut mucosal health, liver health and thyroid hormones (T3 and T4) with respect to lipid profile. That reflects the more powerful effect of CA in balancing body internal homeostasis. On the contrary, AA failed to establish this balance causing deteriorated performance and gut mucosal health. The combination between CA and AA (1:1) sat on the borderline.
Conflict of interest
All the authors declare that there is no conflict of interest between them.
Authors’ contribution
Dr. Heba MA Abdelrazek had shared in experiment design, performing the experiment, serum analysis, writing and editing the manuscript, Prof. Said MM Abuzead had shared in experiment design, revision of the manuscript, Prof. Saadia A Ali had shared in writing, revision and editing of the manuscript, Prof. Hala M Ali EL-Genaidy had made the histopathology and Mrs. Samah A Abd El-Hafez had shared in performing the experiment and made the statistical analysis.
References


