Advances in Animal and Veterinary Sciences
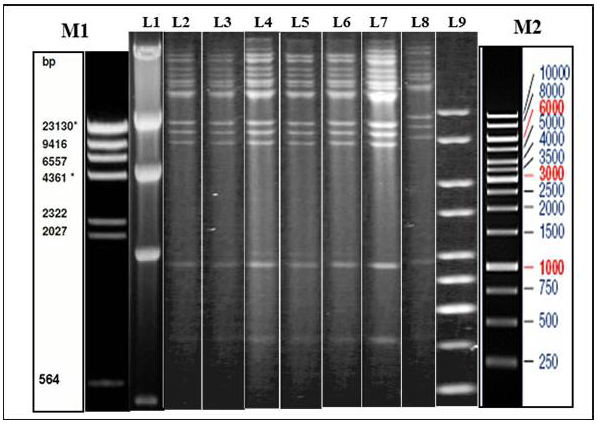
Illustration of Restriction endonuclease (RE) analysis profile of Indian isolates of the present study
a) Agarose gel showing the electrophoretic profile of representative viral genome digested with Hind III. Lane 2-8 represents Indian isolates - GUK 01/83, GUK 56/07, KAA 01, MAA 4/01, UPR 29/07, UPR 38/07, APH 01/10 respectively. M1 & L1 – Lambda Hind III Digest; M2 & L9 – Fermentas 1 Kb Gene ruler
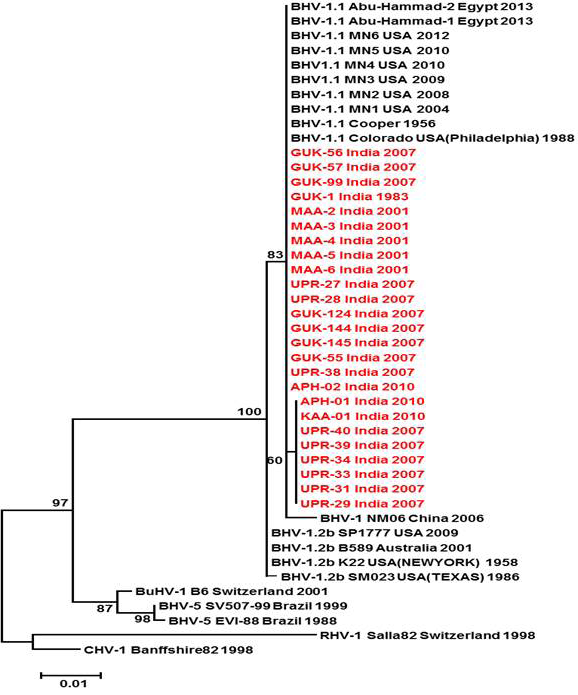
Neighbour- joining tree generated by 454 bp of glycoprotein C (UL 44) region showing the genetic relationship of the Indian isolates with published bovine herpesvirus and related herpesviruses. The percentage of bootstrap values given to the left of main branch
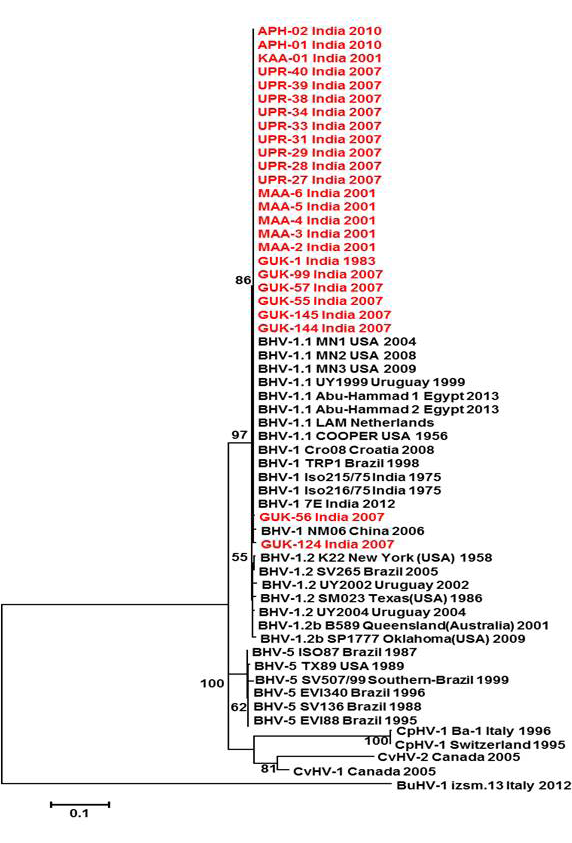
Neighbour- joining tree generated by 624 bp of glycoprotein B (UL 27) region showing the genetic relationship of the Indian isolates with published bovine herpesvirus and related herpesviruses. The percentage of bootstrap values given to the left of main branch
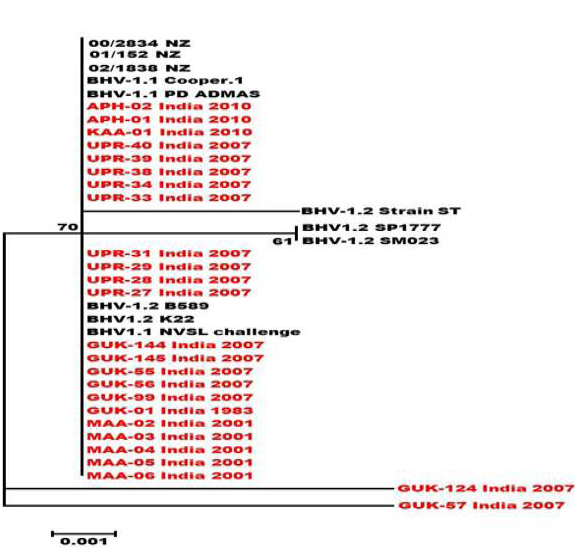
Neighbour- joining tree generated by 304 bp of US 1.67 region showing the genetic relationship of the Indian isolates with related herpesviruses. The percentage of bootstrap values given to the left of main branch.
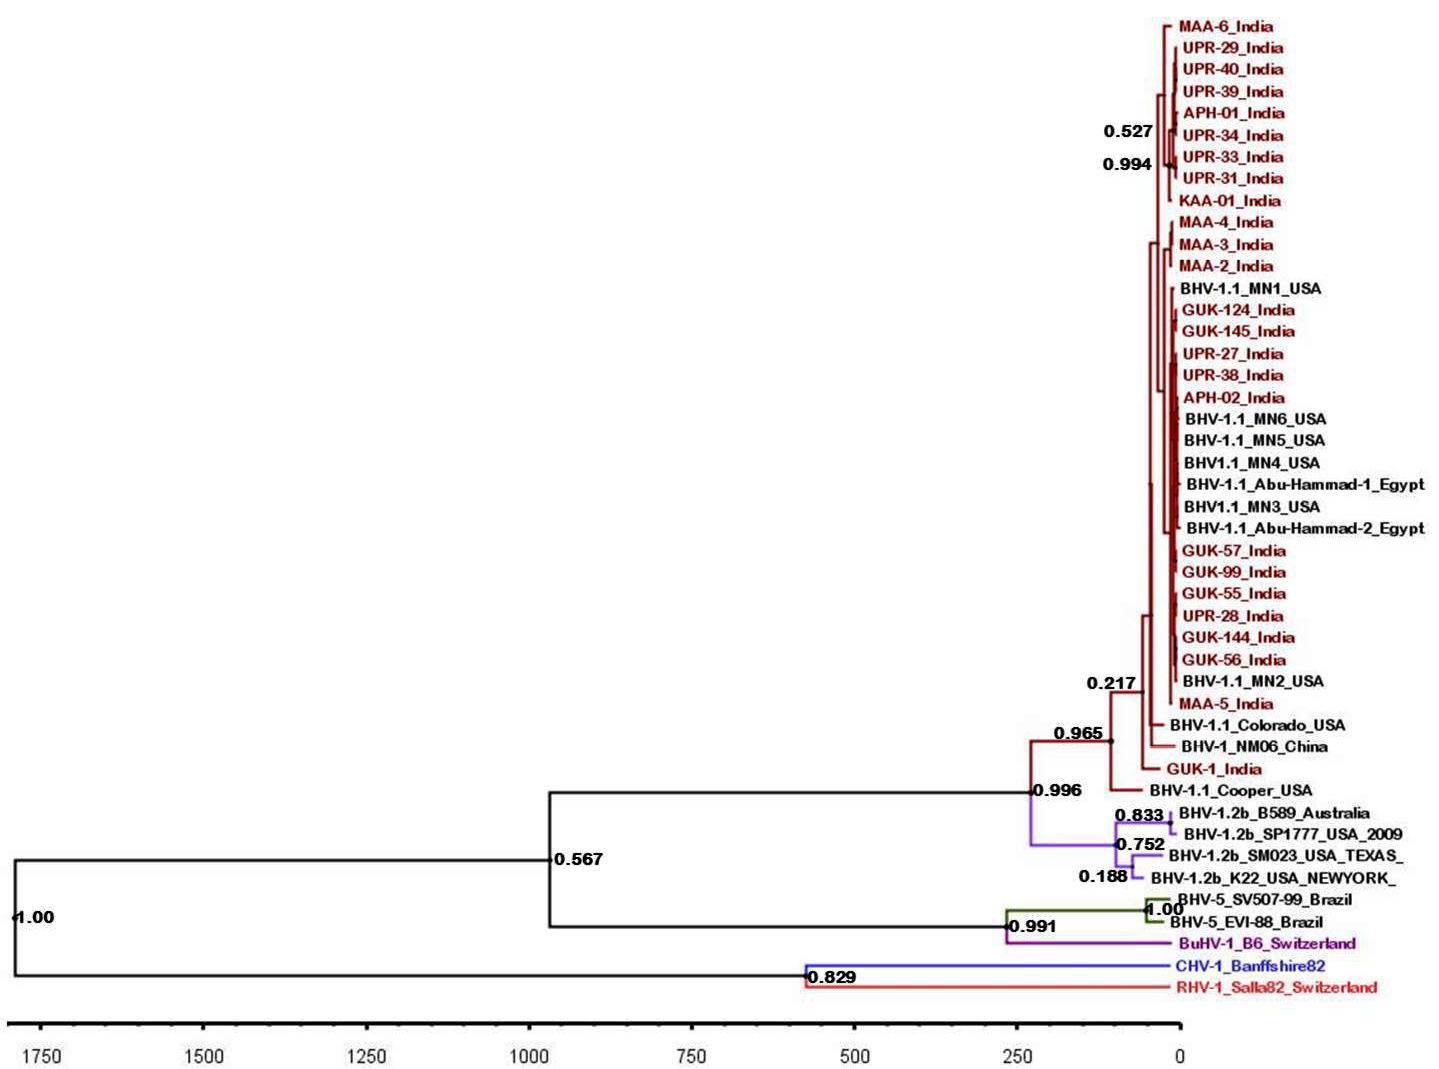
BEAST tree generated based on the BHV partial gB gene. The time scale is shown at the bottom


