Advances in Animal and Veterinary Sciences
Growth curve of Mycobacterium avium subspecies paratuberculosis (‘S 5’) strain upto 8 weeks by taking OD at 600nm. Each point correlates to the mean of three determinations ± standard deviation
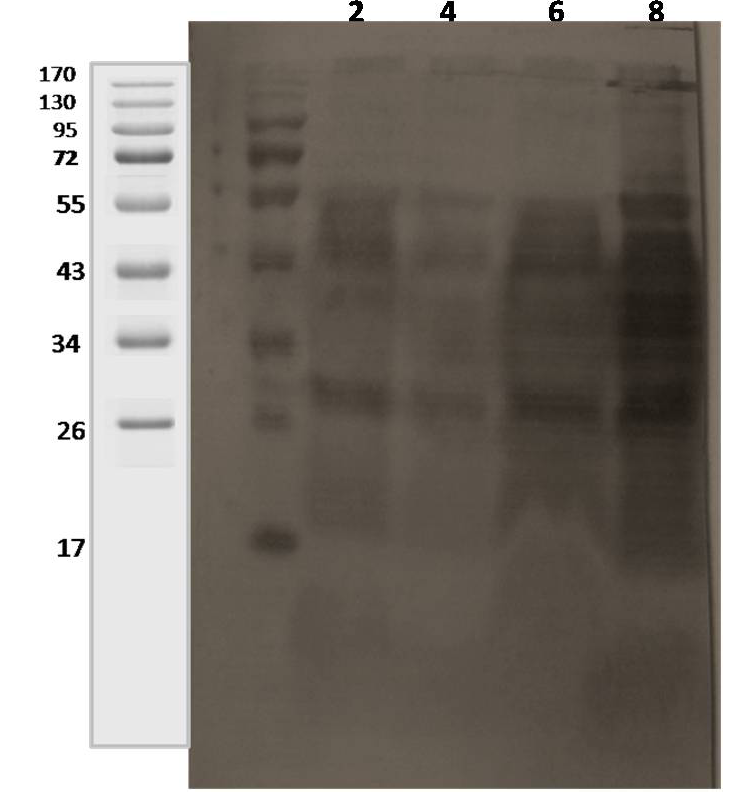
SDS-PAGE of CF proteins harvested at different incubation periods of MAP
Lane 1: 2 weeks; lane 2: 4 weeks; lane 3: 6 weeks; lane 4: 8 weeks.
Immunoblots with CF proteins of MAP in naturally infected sheep serum
Lane 1: 0 Day; lane 2: 2 weeks; lane 3: 4 weeks; lane 4: 6 weeks; lane 5: 8 weeks.
Immunoblots with CF proteins of MAP in naturally infected goat 1 serum
Lane 1: 2 weeks; lane 2: 4 weeks; lane 3: 6 weeks; lane 4: 8 weeks.
Immunoblots with CF proteins of MAP in naturally infected goat 2 serum
Lane 1: 2 weeks; lane 2: 4 weeks; lane 3: 6 weeks; lane 4: 8 weeks.


