Advances in Animal and Veterinary Sciences
Research Article
Validation of a High Performance Liquid Chromatography (HPLC) Method to Detect and Quantify Some Antibiotics Residues in Honey
Bassem Chebira*, Latifa Boultif, Amir Agabou, Abdesselam Mekroud
PADESCA research Laboratory, Institute of Veterinary Sciences, University of Constantine 1, Algeria.
Abstract | Honey is a natural product with numerous beneficial effects in human nutrition and medicine. However it may be contaminated with substances hazardous to the consumers such as antibiotics which are frequently used to treat bee colonies or to promote their growth. In this study we firstly optimized and validated the detection parameters of chloramphenicol and streptomycin in honey by High Performance Liquid Chromatography (HPLC), and then we conducted experiments to adopt a method of extraction of theses antibiotics residues from honey. The validation of our analytical method required the setting of multiples statistique tests. The coefficient of variation (CV) calculated for streptomycin and chloramphenicol is 1.89% and 3.85% respectively, indicating a good repetitiveness of our analytical methods. To evaluate reproducibility, we use Student Test at 5 % risk degree, the calculated “t” is less than the “t” table in the three sets of comparison (2.09). A good correlation between concentration and the response of the detector is attested by a correlation coefficient “r” equal to 0.99 for chloramphenicol and 0.93 for streptomycin. The detection limit determined for streptomycin was 0.06 ppb and 0.024 ppm for chloramphenicol while limits of quantification are 0.2 ppb for Streptomycin and 0.08 ppm for Chloramphenicol. These results will be used later to identify and quantify these antibiotics residues in a large range of samples.
Keywords | Chloramphenicol, Streptomycin, Residues, Honey, HPLC
Editor | Kuldeep Dhama, Indian Veterinary Research Institute, Uttar Pradesh, India.
Received | February 22, 2015; Revised | April 06, 2015; Accepted | April 08, 2015; Published | April 28, 2015
*Correspondence | Bassem Chebira, Institute of Veterinary Sciences, University of Constantine 1, Algeria; Email: Chebirab228@gmail.com
Citation | Chebira B, Boultif L, Agabou A, Mekroud A (2015). Validation of a high performance liquid chromatography (HPLC) method to detect and quantify some antibiotics residues in honey. Adv. Anim. Vet. Sci. 3(5): 295-301.
DOI | http://dx.doi.org/10.14737/journal.aavs/2015/3.5.295.301
ISSN (Online) | 2307-8316; ISSN (Print) | 2309-3331
Copyright © 2015 Chebira et al. This is an open access article distributed under the Creative Commons Attribution License, which permits unrestricted use, distribution, and reproduction in any medium, provided the original work is properly cited.
INTRODUCTION
All over the world and for thousands of years, humans in all societies had used bee products especially honey. This natural product contains about 200 phytochemicals and bioactive constituents such as antioxidants and enzymes involved in the defence mechanisms (Babcan et al., 2002; Gheldof et al., 2002; Pontoh et al., 2002; Bogdanov et al., 2008; Beretta et al., 2010; Wang and Li, 2011). This composition leads to a large utilization of honey in folk and modern medicines as a remedy for treatment of wounds, allergies and gastrointestinal disorders (Eteraf-Oskouei and Najafi, 2013) because of its broad spectrum activity against some pathogenic and food-spoiling bacteria (Al-Waili and Haq, 2004; Emsen, 2007) and its anti-neoplastic activity (Sewllam et al., 2003).
However, use of honey in human nutrition and medicine could be hazardous, as this natural product may contain a variety of microorganisms such as Clostridium botulinum (Koluman et al., 2013), Bacillus cereus (López and Alippi, 2007), E. coli, S. aureus and Aspergillus sp (Dumen et al., 2013) and other contaminants, including heavy metals, radioactive materials, pesticides and antibiotics (mainly tetracyclines, streptomycin, sulfonamides, erythromycin, Lincomycin, Nitrofurans, Nitroimidazoles, Fluoroquinolones, Fumagillin, tylosin and chloramphenicol) which are widely applied to bee colonies, at relatively high doses as therapeutic agents, or at low sub-therapeutic doses as growth promoters (Reybroeck et al., 2012). The presence of some antibiotics residues or their metabolites may result in toxic reactions in consumers while some others are able to generate hypersensitivity reactions (Paige et al., 1997). Long term hazards (in relation with the relatively long half-life of antibiotic residues) include carcinogenicity, reproductive effects and teratogenicity at very low doses, which moreover increase the emergence of resistance in commensal and pathogenic bacteria leading to difficult-to-treat human infections (Al-Waili et al., 2012).
This is why honey has been subjected to many regulatory standards referred to as MRLs (Maximum Residue Limits). In the European Union and many other countries, no MRLs have been established for antibiotics in honey, resulting in a ‘zero tolerance’ for their residues implying that use of antibiotics is not allowed in apiculture and their residues should be absent in honey (Michaud, 2005; Council regulation 2377/90/EC, 1990).
Various analytical methods are used to identify and quantify these antibiotics residues in honey. Microbiological tests constitute easy techniques for their screening in routine control. Nevertheless, these tests have low detection capabilities and a high false-positive rate (Gaudin et al., 2013). This leads to the development of other rapid qualitative or semi-quantitative tests such as Enzyme-Linking Immuno Sorbent Assays (ELISA) which give controversial results and require confirmation by more accurate, sensitive and reliable confirmatory methods such as gas or liquid chromatography combined or not to Mass Spectrometry (Lopez et al., 2008; Hammel et al., 2008). Recently a regenerable antigen microarray in combination with an automated flow injection system has been developed to identify and quantify antibiotic derivatives in honey (Wutz et al., 2011).
During 2011, the Algerian beekeeping industry counts 20 000 beekeepers and 1.5 millions of hives producing about 33000 quintals of honey. This local production is associated to an importation of about 150000 tons of honey from China, India and Saudi Arabia (Oudjet, 2012).
In this paper, we aimed to optimize and validate an extraction method and various analysis parameters (stationary phase, mobile phase, absorption spectrum, flow rate and injected volume) to detect and quantify residues of Chloramphenicol and Streptomycin in honey commercialized in Constantine (North-east Algeria).
MATERIALS AND METHODS
Instrumentation and Reagents
The system is represented by an HPLC Shimadzu corporate device composed of: a column (type VP-ODS 250 L*40, filled with grafted silica gel: column C18 in reversed phase), two pumps (models LC-10 ATvp, pump 1 reference S/N: C20974009859J2, pump 2 references S/N: C21014009440CD), two UV detectors (models SPD-10Avp/10AVvp equipped with Deuterium lamp, absorption spectrum 190 to 350 nm, reference S/N: C21004001496LP), a gas cleaner: (Models DGU-20A5 reference S/N: L20244301983CR), a control system or integrator (models SCL-10 AVP, reference S/N: C21014009440CD), an injection loop, two reservoirs of mobile phase and a plastic piping allowing the progression of the liquid phase in the different compartments of the device. The other equipment consist of a centrifuge, a filtrating device, a cold chamber, analytical scale and HPLC special injection syringes (capacity 20 and 50 µL, reference C 670-12554-03).
All the chemicals used in this study were of ultra-residue analytical grade or of HPLC grade. Methanol (Ref. 5363C) and water (Ref. 34877) were obtained from Sigma-Aldrich and Acetonitrile (Ref. 6235A) from Biochem-Chemopharma.
Liquid chromatography solvents were filtered with 0.45 µm Teflon and Nylon membranes before their use. Purified honey samples were successively filtered through 0.45 µm X 47 mm Nylon filters (Supelco, Ref. Cat. 58061 & 58062U).
Standard of Sreptomycin (10ml. Ref. 85886) and Chlomphenicol (VETERANAL. 250mg. Ref. 46110) were purchased from Sigma-Aldrich.
Sreptomycin standard stock solution was prepared by diluting 20 µg of the standard solution (1mg/ml) in 20 ml of methanol to get a concentration of 1ng/L.
For chloramphenicol, 2 mg of the standard powder were melted in 10 ml of acetonitrile to obtain a stock solution with a concentration of 0.2 µg/L.
To make the calibration curves, working solutions (different concentrations) were made by serially diluting the stock solutions in appropriate solvents every time just before use. Both standard and working solutions were stored at 4°C in amber flask until use.
One hundred one (101), honey samples (125 g each) were collected at local markets in Constantine (North-East of Algeria) from September 2012 to August 2013. They were conveyed quickly in an isothermal tray to the laboratory and stored in darkness at 4°C until processing.
Each honey sample was divided into 3 fractions of 10 g each. The first fraction served as a control; the second was doped with 0.2 mg of chloramphenicol while the latter was doped with 20 µg of streptomycin.
Optimization and Validation of Chromatographic Analysis
In order to identify and quantify streptomycin and chloramphenicol residues in honey by HPLC, we started at first with an optimization of the analysis conditions [stationary phase, mobile phase, absorption spectrum (wavelengths), flow rate and injection volumes].
The accuracy of the method is verified by statistical calculations of repeatability and reproducibility (according to the CEAEQ, 2007). For repeatability, calculation of the coefficient of variation is a very good indicator of the analytical method precision, while for reproducibility we carried out in addition to the coefficient of variation, the comparison of averages using Student’s “t” test at P<5%
To test the repetitiveness of our method, we performed a series of 10 essays on the same day, with the same work solution, the same operator, the same place, the same equipment and under the same analysis conditions (According to ISO 3534-1 and ISO 5725-1 standards).
To achieve the test of reproducibility, two different operators carried out three series of twenty essays each, with three different work solutions (one for each series) on different days (according to ISO 3534-1 and ISO 5725-1 standards).
For verifying the linearity of our analytical method, we have prepared a range of calibrations for each antibiotic. They consist of five standards of chloramphenicol containing respectively 12%, 25%, 50%, 75% and 100% of the concentration determined during the optimization step. For streptomycin, the calibration range has four standards corresponding to 25%, 50%, 75% and 100% of the optimization (according to ISO 3534-1 and ISO 5725-1 standards).
To determinate the minimum of detection limit (MDL) we used a concentration equivalent to 3 times the standard deviation at low level of each antibiotic standard in its proper solvent (MDL = 3 × S. S: standard deviation) (according to ISO 3534-1 and ISO 5725-1 standards).
The method quantification limit (MQL) was evaluated by use a concentration equal to 10 times the standard deviation obtained during MDL determination (MQL = 10 × S. S: standard deviation) (according to ISO 3534-1 and ISO 5725-1 standards).
Extraction Method
In order to eliminate the undesirable components and to extract the antibiotics from honey matrix, the preparation of the sample is a crucial step. The adopted extraction method of streptomycin and chloramphenicol from honey is based on the procedure described by Cai et al. (2005) and it consists of the following steps: 10 g of honey were mixed with 20 ml of acetonitrile and 10 ml of LC grade water and vortexed for 1 min. The mixture is then centrifuged at 6000 rpm for 10 min and the supernatant is collected and passed through Whatman filters. This filtrate supplemented with 10 ml of acetonitrile undergoes a vortex-homogenization for 2 minutes then a centrifugation at 3000 rpm for 5 mn. Finally, the supernatant is harvested and filtered firstly with a Whatman filter, then with a Nylon membrane filter (Supelco: 0.45 µm X 47 mm). This procedure was applied on all doped portions of honey samples.
To assess the efficacy of this procedure in the extraction of Streptomycin and Chloramphenicol residues from the honey matrix, 20 series of trials were conducted on honey samples doped with each antibiotic standard as recommended by Diaz and Cabanillas (1990), Helio et al., (2007) and Vinas et al. (2007).
Statistics Study
We realized an average comparison according to Student ‘‘t’’ Test. We calculated the average, the standard deviation and the variance from the obtained surfaces to calculate “t” (calculated) and to compare it with the “t” (table of Student) at the respective risks of d 5%.
The “t” (calculated) is measured between every two series (a and b, a and c, b and c) according to the following formula:
t = |Xa - Xb|/√ σ²/Na + σ²/Nb
Xa being the average of the first series (series a) - Xb being the average of the second series (series b) - σ² being the variance between the two series a andb - Na being the number of the repetitions of the series a - Nb being the number of the repetitions of the series b.
If “t” is inferior to “t” table, the difference between the two series is not significant which means that our method is repeatable or reproducible.
If the calculated “t” is superior to “t” table then the difference between the two series is significant and our method is not reliable.
All tests of the statistic study were made using the software Stagraphics version 15.2.0.6 (2010).
RESULTS AND DISCUSSION
Withheld Chromatographic Analysis Conditions
Our experimental investigations allowed keeping the following HPLC analysis parameters:
Examination of the Method’s Reliability
This was conducted to verify the efficacy of the withheld parameters.
Repeatability
The coefficients of variation (CV) calculated for streptomycin and chloramphenicol are 1.89% and 3.85% respectively (Table 1), indicating a good repetitiveness of our analytical methods.
Table 1: Statistical results of repeatability for streptomycin (Str) and chloramphenicol (Cap)
|
Number of trials |
Average |
Standard deviation |
Coefficient of variation (CV) |
|
|
Str |
10 |
663289.7 |
12563.78 |
1.89% |
|
Cap |
10 |
3782646.4 |
145733.37 |
3.85% |
These findings are in agreement with other works in which coefficients of variation were less than 10% (Vinas et al., 2007). Benetti et al. (2004) found a coefficient of variation equal to 7.5% for three series of tests carried out on the same day and Ortelli et al. (2004) while working on honey samples spiked with a standard chloramphenicol at a concentration of 5 µg/kg reported a CV of 5.3% for a series of 4 trials.
Reproducibility
The recorded coefficients of variation are between 3.10 and 3.46% for the chloramphenicol and between 6.41 and 10.53% for streptomycin (Table 2).
These values are consistent with the recommendations of the manual of the Codex Alimentarius Commission, which sets at 35% the maximum value of the calculated coefficient of variation for the inter-assay so that the analysis method could be considered to be reliable. These results are significantly lower than the coefficient of variation granted by decision 2002/657/EC of the European Union for the validation of the analytical methods on animal foodstuffs, which is set at 12%.
As mentioned in Table 3, the calculated “t” is less than the “t” table in the three sets of comparison, confirming the method’s reproducible in our analysis conditions.
Linearity
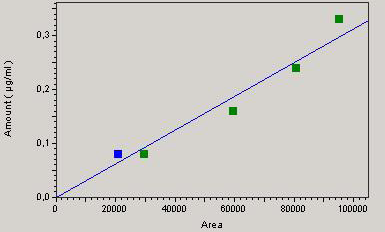
A good correlation between concentration and the response of the detector is attested by a correlation coefficient “r” equal to 0.99 for chloramphenicol and 0.93 for streptomycin (Figures 1 and 2) which is a good indicator of linearity according to European Council regulation 2377/90/EC. The respective regression equations for the standard chloramphenicol and streptomycin are:
Y = 3.77405e-8 X + b / b = 0
and
Y = 3.12846e-6 X + b / b = 0.
Limits of Detection and Quantification of the Method
The detection limit determined by the points covered by the peak area is 37691.34 points (0.06 ppb) for streptomycin and 437199.33 points (0.024 ppm) for chloramphenicol while limits of quantification are about 125 637.8 points (0.2 ppb) for Streptomycin and 1457333.7 points (0.08 ppm) for Chloramphenicol (Table 4).
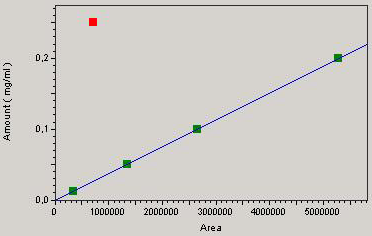
Table 2: Statistical results of reproducibility for streptomycin (Str) and chloramphenicol (Cap)
|
Series 1 |
Series 2 |
Series 3 |
||||
|
Str |
Cap |
Str |
Cap |
Str |
Cap |
|
|
Number of trials |
20 |
20 |
20 |
20 |
20 |
20 |
|
Average |
101505.7 |
3.94196E6 |
96885.8 |
3.90143E6 |
93465.6 |
3.86921E6 |
|
Standard deviation |
6903.51 |
122303.0 |
10211.4 |
135123.0 |
5999.18 |
124151 |
|
Coefficient of variation (CV) |
6.80 |
3.10 |
10.53 |
3.46 |
6.41 |
3.20 |
|
Minimum |
91787.0 |
3.69529E6 |
78388.0 |
3.46 |
84920.0 |
3.63 |
|
Maximum |
117000.1 |
4.1486E6 |
113552.6 |
4.14 |
107786.9 |
4.11 |
Table 3: Comparisons of averages and “t’’ tests for chloramphenicol (Cap) and streptomycin (Str)
|
Averages Comparison |
Calculated “t’’ test (ct) |
Table “t’’ test (tt) |
Risk degree |
ct vs tt |
|
|
Cap |
a/b |
0,994757 |
2.09 |
5% |
tt>tc |
|
b/c |
0,78513 |
2.09 |
5% |
tt>tc |
|
|
a/c |
0,78513 |
2.09 |
5% |
tt>tc |
|
|
Str |
a/b |
1,67602 |
2.09 |
5% |
tt>tc |
|
b/c |
1,29151 |
2.09 |
5% |
tt>tc |
|
|
a/c |
1,93115 |
2.09 |
5% |
tt>tc |
Table 4: Minimum detection and quantification limits
|
Streptomycin |
Chloramphenicol |
|||
|
Value in point area |
Value in ng/kg |
Value in point area |
Value in µg/kg |
|
|
No. of tests |
10 |
10 |
10 |
10 |
|
Average (m) |
663289.7 |
1 |
3782646.4 |
0.2 |
|
Standard deviation (S) |
12563.78 |
0.02 |
145733.37 |
0.008 |
|
Minimum detection limit MDL=S x 3 |
37691.34 |
0.06 |
437199.33 |
0.024 |
|
Minimum quantification limit MQL=S x 10 |
125 637.8 |
0.2 |
1457333.7 |
0.08 |
Extraction Method
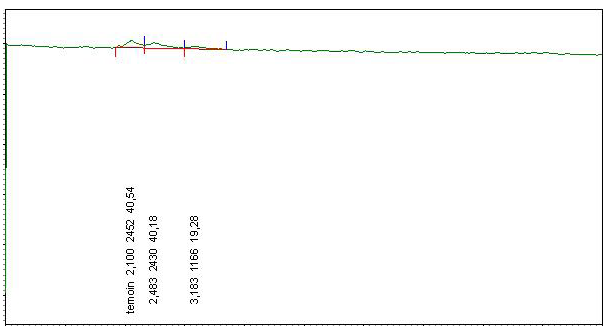
After doping honey samples with the streptomycin and chloramphenicol standards, the adopted extraction procedure allows obtaining a transparent and homogenous liquid which is injected directly in the HPLC device. We obtained corresponding peaks after 2.55 min for chloramphenicol (Figure 3) and 2.627 for streptomycin (Figure 4) while for the negative control sample, no peak can be identified (Figure 5).
Appearance times of the obtained peaks correspond ex-
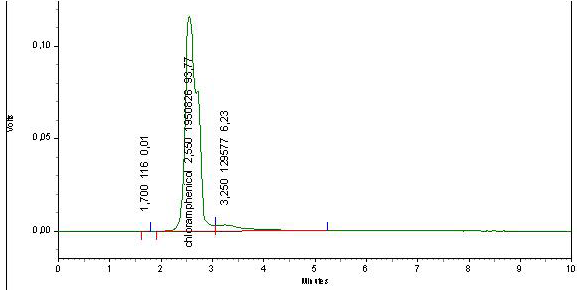

actly to the retention times obtained from the tests on the internal standard. This indicates that chloramphenicol and streptomycin extracted from doped samples and analysed with the same optimized parameters had been recognized by our HPLC system and confirms the accurateness of the adopted extraction procedure.
Different methods of extraction have been described in several previous studies (Diaz and Cabanillas, 1990; Cai et al., 2005; Helio et al., 2007; Vinas et al., 2007).
CONCLUSION
The preliminary results are very satisfactory. Our HPLC system is able to detect the residues of streptomycin and shloramphenicol in spiked honey samples after an efficient extraction procedure.
Tests carried out for the validation of our method of chromatographic analysis revealed very reliable and accurate results confirmed by good repetitiveness, good precision and linearity as well as a valuable coefficient of variation.
These encouraging results will serve as a basis for further experimental investigations on contamination with antibiotics in a large range of locally produced or imported honey samples.
Acknowledgment
This work is dedicated to the memory of our laboratory director Pr. Elhadef-Elokki Saadoune. A beloved father, friend, colleague, teacher and researcher who left us forever and far too soon.
Conflict of Interest
The authors declare that they have no conflict of interest.
REFERENCES


