Advances in Animal and Veterinary Sciences
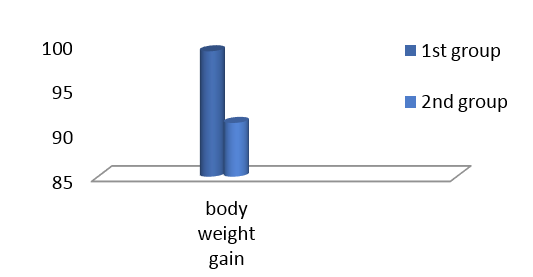
Effects of L. acidophilus on body weight gain (gm) during the 32 days post weaning
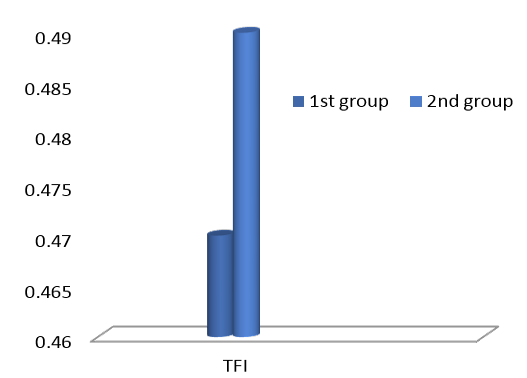
Effects of feeding L. aciaophilus on Thyroid Function Index (TFI) during the 32 day spot weaning
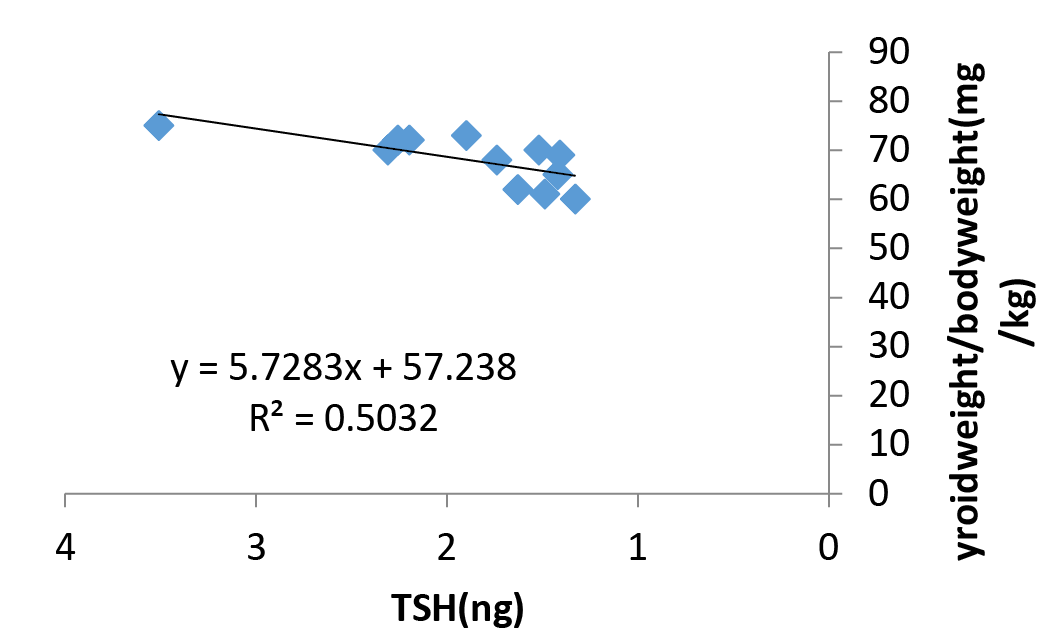
Relationship between serum TSH and thyroid weight in rats fed L. acidophilus for 32 days. The R2 value show significant regression of variable of y on variation of x values
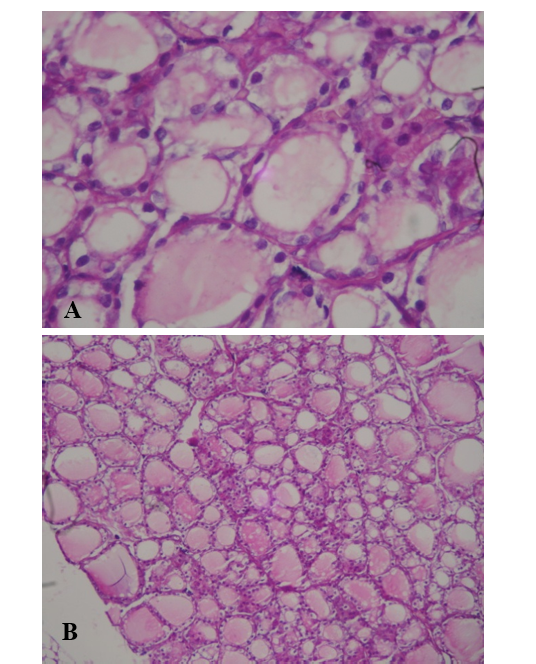
Light microscopic photograph of thyroid gland in control group (A-10x, B-40x). It shows a normal size and number of follicles lined by squamous to cuboidal shape follicular cells and filled with light to moderate colloid material (H&E)
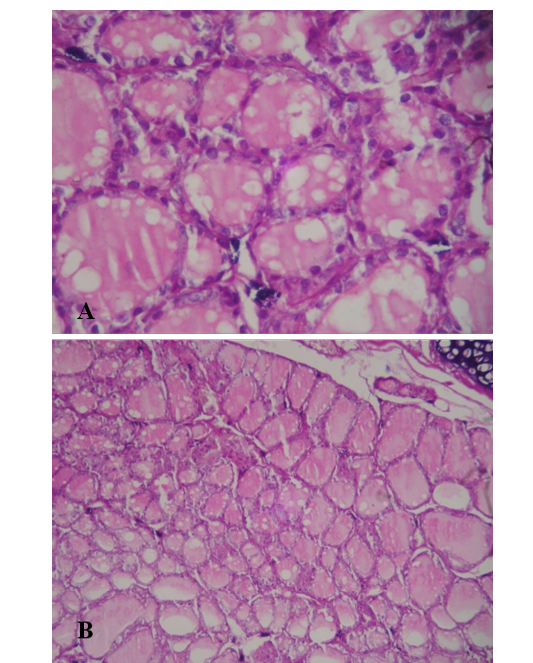
Light microscopic photograph of thyroid gland in L. acidophilus group (A-10x, B-40x). Show widely distended and filled with well stained colloidal material lined by hyper plastic, basophilic hyper chromatic epithelia, (H&E)


