Advances in Animal and Veterinary Sciences
Research Article
Genetic Divergence among Seabuckthorn (Hippophae sps. (L)) using Molecular Marker Based Analysis with Respect to Seed Protein and Anti-Oxidant Properties
Netrapal Sharma1, 3*, Sanjay Gupta2, Rekha Pathak3, Sanjay Mohan Gupta4, Tserin Stobdan5, Anil Kumar1
1Department of Molecular Biology & Genetic Engineering, G. B. Pant University of Agriculture & Technology, Pantnagar-263 145; 2Division of Surgery, Indian Veterinary Research Institute, Izatnagar, Bareilly-243122, U.P.; 3Department of Biotechnology, SBS PG Institute of Biomedical Sciences, Balawala, Dehradun; 4Defence Institute of Bio-Energy Research, DRDO, Haldwani, 263139; 5Defence Institute of High Altitude Research, DRDO, Leh-Ladakh, India.
Abstract | The genetic diversity among thirty six genotypes of Hippophae Salicifolia D. Don of Uttarakhand region and Hippophae rhamnoides subsp. Turkestanica of Laddakh region was studied; using simple sequence repeats DNA (SSRs)-PCR analysis. The protein profiling and antioxidant profiling (quantitative and qualitative) of seeds was also done to select the superior genotypes having high economic importance. A total of seven simple sequences repeat primers used for detecting genetic variability in Sea buck thorn seeds out of which Seven SSR primers were highly reproducible and found suitable for use in PCR (Polymerase Chain Reaction) analysis. SSRs profile obtained by primer UTR-15 was containing total of 8 bands (0.15- 0.6 kb), among these eight bands, one was found to be polymorphic (12.5%). The similarity coefficients based on SSR markers ranged from 0.011 to 0.999 with an average value of 0.226. The polymorphism information content (PIC) value ranged from 0.1686 (UTR-015) to 0.2975 (UTR-12) with a mean of 0.351. A dendrogram constructed based on the Unweighted Pair Group Method with Arithmetic Mean (UPGMA) clustering method revealed two major clusters of Uttarakhand (with subclusters) and Laddakh region (no subclusters). The analysis of total seed storage protein (quantitative) and protein profiling (qualitative) among the genotypes was performed to indentify novel proteins of important functional attributes. Sodium dodecayl sulphate polyacrylamide gel electrophoresis (SDS-PAGE) based generated profiles of seed proteins showed major differences in banding patterns among these genotypes with respect to altitude besides differences in seed protein contents. The phenol contents of the H. salicifolia (Particularly Genotype ST 10) was found significantly higher (P<0.05) than H. rhamnoides (Genotype DIHAR-6). The flavonoid content of the DIHAR-14 was higher as compared to ST-1. Total scavenging antioxidant was quite high and equally good in all the genotypes. This study helps in the selection of superior genotypes having higher nutraceutical value by using developed molecular and protein based markers in Uttarakhand and Laddakh regions.
Keywords | Sea buckthorn, Simple sequence repeats, Genetic diversity, Anti-oxidant activity
Editor | Kuldeep Dhama, Indian Veterinary Research Institute, Uttar Pradesh, India.
Received | February 12, 2015; Revised | March 14, 2015; Accepted | March 15, 2015; Published | March 19, 2015
*Correspondence | Netrapal Sharma, Indian Veterinary research Institute, Izatnagar, U.P., India; Email: np_biotech53@rediffmail.com
Citation | Sharma N, Gupta S, Pathak R, Gupta SM, Stobdan T, Kumar A (2015). Genetic divergence among seabuckthorn (Hippophae sps. (L)) using molecular marker based analysis with respect to seed protein and anti-oxidant properties. Adv. Anim. Vet. Sci. 3(4): 211-224.
DOI | http://dx.doi.org/10.14737/journal.aavs/2015/3.4.211.224
ISSN (Online) | 2307-8316; ISSN (Print) | 2309-3331
Copyright © 2015 Sharma et al. This is an open access article distributed under the Creative Commons Attribution License, which permits unrestricted use, distribution, and reproduction in any medium, provided the original work is properly cited.
INTRODUCTION
Sea buckthorn (SBT, Elaeagnaceae family) is a medicinal dioecious shrub or small sized tree of region (2000-4500 m above sea level) of China and Russia with wide but fragmented distribution in Eurasia between 27 and 69°N latitude and 7°W and 122°E longitude (Rousi, 1971) and having 6 species and 12 sub-species of SBT (Lu, 1992). Among these H. rhamnoides and H. salicifolia species of SBT are more common with contrasting phenotypic characters. H. rhamnoides is the typical most wildly distributed species of SBT, cultivated at high altitude regions (2600-4500 m above sea level) regions of N. W. Himalayan regions from Europe to Leh-Laddakh, Nubra, Zanskar, Suru Changthang and Lahaul-spiti valleys. The presence of typical thorns on branches is special character in H. rhamnoides that clearly distinguished them from other species of SBT. On other hand, H. salicifolia is less explored but higher value (Gupta et al., 2011a) species of SBT, cultivated at low altitude (2000-3600 m above sea level) region of Eurasia, mainly in central and east Asia and in north-west Himalayan region from Pakistan to Himanchal Pradesh, Uttarakhand, Nepal and eastern India (Lu, 1992; Uprety et al., 2010). The main advantage of H. salicifolia is that it is nearly thorn less, contain all essential polyunsaturated fatty acids particularly omega-3 and omega-6 (Xiao, 1980), high quality berries with late maturation character and vitamin C content is the highest among all species of SBT (Gupta et al., 2011b; Sharma et al., 2013).
In the naturally growing different genotypes of H. rhamnoides and H. salicifolia in Leh-Ladakh and Uttarakhand regions, wide variations were observed for different economical traits viz., plant form, number of fruits per branch, fruit weight, fruit shape, juice content, leaf area, seed size, presence of thorns etc. (Yadav et al., 2006). Furthermore, these variations were also recommended for different biochemical traits viz. TSS, acidity, ascorbic acid and sugar content in fruits (Yadav et al., 2006). But, due to lack of clear morphological identification of superior genotypes of SBT, necessitate the development of molecular and protein based markers for selecting promising genotype of higher economic importance. Also, the application of molecular marker in understanding intra-specific genetic diversity and molecular tagging in SBT provides a better scope for selection in breeding programme (Persson, 2001). The therapeutic role of sea buckthorn has been described in cancer therapy, cardiovascular diseases, gastrointestinal ulcers, skin disorder and liver protective action (Zeb, 2004).
DNA polymorphism based approaches have been frequently exploited to probe the genetic variation of species or populations. In SBT, different genetic marker systems have been used to assess phylogenetic relationship and diversity (Asad et al., 2009; Sharma et al., 2013). SSRs marker system have several advantages over other DNA markers due to its low cost, speed, ease and use of small amount of DNA/ plant material. In SBT, SSRs markers have been used for diverse studies in the field of taxonomy, distribution and geographic origin, sex determination and population genetics. SSRs are becoming standard DNA markers for plant genome analysis and are being used as markers in marker assisted breeding (Semagn et al., 2006). Unfortunately, despite its immense importance as an ecological restorer and medicinal plant, the number of single locus co-dominant markers available is very limited for this plant (Wang et al., 2008; Jain et al., 2010). However, the most of the pharmacological effects of SBT and its health benefits may be partly attributed to their high content of phenolic compounds, as phenols possess a wide spectrum of properties such as antioxidant, antimicrobial, antimutagenic and anticarcinogenic potential (Negi et al., 2005; Ercisli et al., 2007; Pang et al., 2008).
In present study, attempt has been made to identify molecular and protein based markers for accessing genetic diversity among 36 SBT (20 of H. rhamnoides and 16 of H. salicifolia D. Don) genotypes of Leh-Ladakh and Uttarakhand region for selection of superior genotype of SBT for further crop breeding improvement programme and identification of phytochemical or ingredients from Hippophae plants seeds.
Material and Methods
Germplasm Collection and DNA isolation
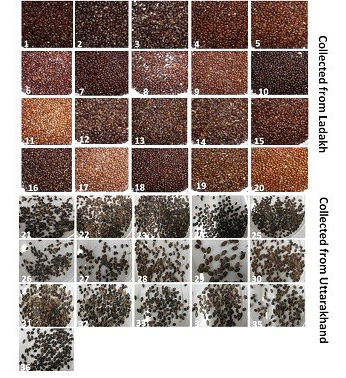
Seeds of thirty six genotypes of Hippophae rhamnoides subsp turkestanica and Hippophae salicifolia D. Don were obtained from Leah Ladakh (latitude 34º08.2’N, longitude 77º34.3’E, altitude 3340 m) and Hill campus of G.B. Pant Agriculture and Technology, Ranichauri, Uttarakhand (2500 m asl) (Table 1). The morphological differences in the seed of these genotypes are shown in Figure 1. The total genomic DNA of different genotypes of H. rhamnoides and H. salicifolia seeds was isolated by CTAB method (Xin et al., 2012), with slight modifications as described by Sharma et al. (2013).
Table 1: Details of sampling sites
|
S. No |
Sample Name |
Place /Location |
Altitude (m amsl) |
Habitat |
State |
|
1. |
DIHAR-1 |
Indus valley, Nubra valley, Suru valley, Changthang valley, Zanskar valley, Lah valley, |
latitude 34º08.2’N, longitude 77º34.3’E, altitude 3340m |
Road side hill slope, Indus river |
Leh Ladakh |
|
2. |
DIHAR-2 |
||||
|
3. |
DIHAR-3 |
||||
|
4. |
DIHAR-4 |
||||
|
5. |
DIHAR-5 |
||||
|
6. |
DIHAR-6 |
||||
|
7. |
DIHAR-7 |
||||
|
8. |
DIHAR-8 |
||||
|
9. |
DIHAR-9 |
||||
|
10. |
DIHAR-10 |
||||
|
11. |
DIHAR-11 |
||||
|
12. |
DIHAR-12 |
||||
|
13. |
DIHAR-13 |
||||
|
14. |
DIHAR-14 |
||||
|
15. |
DIHAR-15 |
||||
|
16. |
DIHAR-16 |
||||
|
17 |
DIHAR-17 |
||||
|
18 |
DIHAR-18 |
||||
|
19 |
DIHAR-19 |
||||
|
20 |
DIHAR-20 |
The present study is an outcome of the survey of naturally growing sea buckthorn populations in Gangotri-Harsil area (2000-3000 m amsl) of district Uttarkashi, a dry temperate region of Garhwal Himalayas 16 (Hippophae salicifolia D. Don) (Sharma et al., 2013) and 1 to 20 (H. rhamnoides subsp turkestanica) Leah Ladakh (latitude 34º08.2’N, longitude 77º34.3’E, altitude 3340m)
SSR Markers Assay
Simple sequenced repeats (SSRs) primers were used for the polymorphism survey (Table 2). PCR amplification was performed as per the standard protocol using 50-100 ng of template DNA, 30 ng of primer (Life Tech) , 0.1 mM dNTPS , 1.5 U Taq DNA polymerase (Bangalore Genei, India), 1X PCR buffer (10 mM Tris pH-8.0, 50 mM KCl and 1.8 mM MgCl2) in a volume of 25 µl. Amplification was performed with thermal cycler (Eppendorf, Germany). The standardized amplification was: Initial denaturation 95° C for 5 min. followed by 40 cycles of denaturation 94° C for 1 min; Primer annealing for 1 min; primer extension at 72° C for 2 min; and final primer extension at 72° C for 7 min. Amplified PCR product were resolved on 1.0% agarose gel and the ethidium bromide stained gels were documented using Alpha Imager 1200TM (Alpha Innotech Corp., USA). Duplicated independent DNA preparations for each sample were done and only major bands consistently amplified were scored.
Statistical Analysis
DNA fingerprints were scored for the presence (1) or absence (0) of bands of various molecular weight sizes in the form of binary matrix. Data were analysed to obtain Jaccard’s coefficients (Yap and Nilsen, 1996) among the genotypes by using NTSYS-pc (version 2.11W; Exeter Biological Software) (Tatham et al., 1996). The SIMQUAL program was used to calculate the Jaccard’s coefficient, a common estimator of genetic identity and was calculated as follows: Jaccard’s coefficient = NAB/ (NAB+ NA+ NB), Where NAB is the number of bands common for A & B, NA is the total number of band in A and NB is the total number of band in B. Similarity matrices were utilized to construct the UPGMA (Unweighted Pair- Group Method with Arithmetic average) dendrograms. Polymorphic information content (PIC) or average heterozygosity was calculated as per the formula: PIC = 2fi (1 - fi), where ‘fi’ is the frequency of the amplified allele and ‘1 – fi’ is the frequency of null allele. Principal coordinate analysis was performed in order to highlight the resolving power of the ordination. To determine robustness of the dendrogram, the data were bootstrapped with 2000 replications along with Jaccard’s coefficient by the computer programme WINBOOT (Yap and Nilsen, 1996).
Table 2: List of 7 SSR primers out of 36
|
S. No. |
Name of Pri-mer |
Primer sequence |
Length (bp) |
PIC Value |
T°m |
Region specific polymorphic bands (bp) |
|
|
Uttarakhand |
Lad-hakh |
||||||
|
1. |
UTR-7 |
F-AGAGAGAGAGAGAGCAACGGAA R-AGACGAAGAAGAAACAAGACGG |
22 22 |
0.1686 |
59.901 59.922 |
550 and 300 |
nil |
|
2. |
UTR-12 |
F-AGACGAGACGAAGTGGTAGTGG R-CTCTTTTGCCTCCCTCCCT |
22 19 |
0.2975 |
60.732 60.71 |
200 |
600 and 700 |
|
3. |
UTR-15 |
F-TGTCACCACCACACCAACTC R-GTTCTACCTACCTGCGGCTTC |
20 21 |
0.1850 |
60.479 60.276 |
300 |
nil |
|
4. |
UTR-16 |
F-TCCGTGTATTTAACCACCTTCC R-CTTCTCCTTGTCCATCACCTTG |
22 22 |
0.2605 |
60.109 61.036 |
150 |
nil |
|
5. |
UTR-27 |
F-CACATTTCTTCCTTCCCTTTTG R-TCGAACCTTTTCTCTCTCTCTCTC |
22 24 |
0.2415 |
59.974 59.787 |
nil |
400 and 500 |
|
6. |
UTR-28 |
F-CAGGAGGGAGTTCTATGCAAAC R-CGGAGAAACGGAGAGGAAG |
22 19 |
0.1833 |
60.13 59.928 |
nil |
400 |
|
7. |
UTR-31 |
F-ACCCCTGAATGTAGAATGGAGT R-GTACGTGGCTTTCTTGTGTGTC |
22 22 |
0.2479 |
58.853 59.708 |
150 and 250 |
nil |
These gave unique polymorphic bands on the basis of different location in India
1-20 (Hippophae rhamnoides subsp turkestanica) seed sample collected from different plants raised at different institute of high Altitude research, Leh Ladakh. The remains 16 (21-36, Hippophae salicifolia D. Don) seed sample collected from different location of Uttarakhand (Sharma et al., 2013).
Gene Sequencing and Insilico Analysis
QIAquick Gel Extraction Kit (Qiagen) was used for extraction and purification of polymorphic amplicons from agarose gel. SSRs-PCR amplified polymorphic bands were cloned in pGEM T-Easy (Promega) Vector and subsequently sequenced (Delhi University, India). The available sequences annotate with the help of online tool NCBI, nucleotide sequence translate in to protein sequence with the help of protein translate tool and protein blast for maximum protein similarities with other similar protein.
Protein Profiling
Protein profiles were performed for all 36 genotypes of H. rhamnoides and H. salicifolia D. Don. Total proteins were extracted by grinding seed (50 mg) with 2% (w/v) SDS, 5% (v/v) 2- mercaptoethanol, 10% (v/v) glycerol, 0·0625 M Tris-HCl, pH 6·8 (1 ml) followed by boiling for 5 min and centrifuged at 10000 rpm for 15 min. Total protein in the form of supernatant was collected and protein quantification was done as method described by Bradford (1976). Quantified protein resuspended in 50 μl of 2X sample buffer [0.5 % SDS, 1.25 % β-mercaptoethanol, 0.03 % bromophenol blue, 2.5 % glycerol in 15 mM Tris-Cl at pH ( 6.8)] and incubated in a dry bath at 98°C for 15 min. Protein sample (25 μg) was taken for SDS-polyacrylamide gel electrophoresis (SDS-PAGE) on 5% stacking and 15% of resolving gels and separated based on Laemeli discontinuous buffer system. After electrophoresis on a vertical slab unit under a constant voltage of 150 V for 7 h, the gels were stained with Coomassie brilliant blue R-250 (HiMedia, India). A medium protein marker calibration kit (Bangalore GeNei) was used as standard.
Estimation of Phenolics, Flavonoids and Free Readical Scavenging Activity
The total phenolic content (TPC) was determined by the method of (Singleton and Rossi, 1965). Briefly, 0.5 ml of the sample extract was transferred into a test tube and mixed 0.2 ml of 50% (v/v) Folin–Ciocalteu reagent. After 3 min, 0.5 ml of saturated Na2CO3 was added to the reaction mixture and make the volume up to 10 ml by adding distilled water. The absorbance was read at 765 nm. The standard curve was established using various concentrations of Gallic acid and results were expressed as mg of Gallic acid per gram of sample in dried weight (DW).
Radical scavenging ability of 2,2’-diphenyl-1-picrylhydrazyl (DPPH), effect of the chelating activity on Fe2+ ions and reducing power activity in comparison with the synthetic and natural antioxidants. This method is based on the principle of the Fe2+-chelating ability of the antioxidant by measuring the ferrous iron-ferrozine complex formed at 562nm (Hsu et al., 2003). To different concentrations extracts (2 mg/ml, 4mg/ml, 6mg/ml, 8mg/ml and 10 mg/ml) were added 0.1 ml of 2 mM FeCl2.4H2O, 0.2 ml of 5 mM ferrozine and methanol to make up the volume to 5 mL. The solutions were mixed and allowed to react for 10 min. The absorbance at 562 nm was measured; a lower absorbance indicated a higher ferrous iron chelating capacity. The chelating activity on Fe+2 of the mushroom was compared with that of EDTA and Citric acid. Chelating activity was calculated by following equation:
Chelating activity (%) = [1- (At/Ao)] × 100
Where At is the absorbance of the sample and Ao is the absorbance of the control at 562 nm.
The total flavonoid was measured with an aluminum chloride assay. An aliquot (1ml) of extrects or a standard solution of (+)-catechin (20, 40, 60, 80, and 100 mg/l) was added to a 10 ml volumetric flask, containing 4ml of distilled deionized water. To the flask was added 0.3 ml 5% NaNO2. After 5 min, 0.3 ml 10% AlCl3 was added. At the sixth min, 2 ml 1M NaOH was added and the solution was mixed well and the absorbance was measured against a prepared reagent blank at 510 nm with an UV-VIS Spectrophotometer Lambda 5. The data of the total flavonoid contents of the dry herbs were expressed as milligrams of (+)-catechin equivalents (CE) per 100 grammes dry mass (mg CE/100g dw). All biochemical estimations were performed in triplicates.
Results and Discussion
Data Collection and Analysis
SSR Analysis
In this study, SSR-PCR fingerprints were generated for 36 genotypes of SBT. Thirty Six SSR designed 20-22 mer oligonucleotide primers were initially used for screening DNA samples to obtain reproducible SSR fingerprints. Out of the 7 primers tested, only eleven primers provided consistent well resolved and reproducible band patterns and were therefore selected for further analysis. The total number of fragments observed among the sea buckthorn genotypes based on SSR analysis with 12 polymorphic primers. The number of scorable fragments produced per primer ranged from 2 to 13 and size of the products ranged from 150 bp to 1150 bp. A representative SSR profile obtained by primer UTR-15 is shown in Figure 2 of a total of 8 bands (0.15-0.6 kb), 1 was polymorphic (12.5%). The similarity coefficients based on SSR markers ranged from 0.011 to 0.999 with an average value of 0.226. The PIC values, a reflection of allele diversity and frequency among the varieties, were not uniformly higher for all the SSR loci tested. The PIC value ranged from 0.1686 (UTR-015) to 0.2975 (UTR-12) with a mean of 0.351. Cluster analysis of SSR primers generated SSR profiles separated the genotypes at an average similarity values of 73% respectively (data not shown). A dendrogram based on the similarity matrix generated with the SSR primers is presented in Figure 2. The dendrogram at an average similarity value of 96% grouped all genotypes in two major clusters showing high diversity in profiles. Besides, the SSR profiles also enabled a few of the genotypes to be discriminated based on their protein content. Abundant genetic diversity and distinct genetic variation both among and within species was also reported by Singh et al. (2006). Sufficient genetic differentiation within populations and a low level of variation among populations was reported by Srihari et al, 2013. They obtained 76.60% and 76.56% polymorphic loci at inter- and intra-specific levels of the genus Hippophae L. respectively. Singh et al. (2006) revealed genetic variability by RAPD in 17 morphotypes found in Nubra valley of Ladakh and found genetic similarity among natural populations within a similarity coefficient ranging from 0.0 to 0.25 (Figure 2).
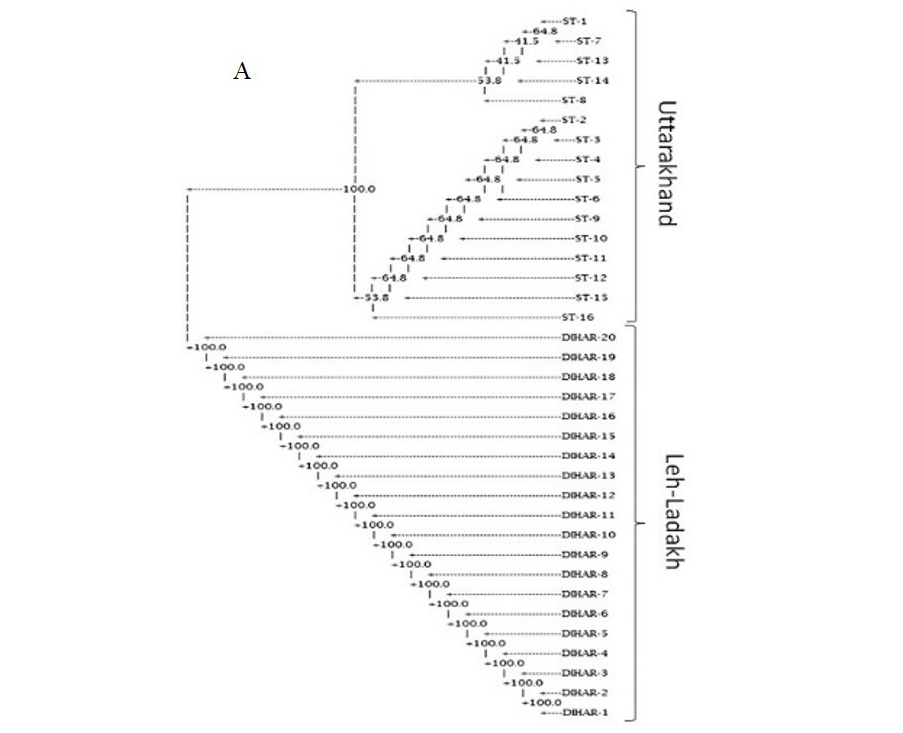
UTR-SSR-15 primer PCR products run in 1.5% agarose and (A). Bootstrap clustering generated by Winboot software (B). Combined UPGMA Clustering generated by NTSYS Software.
|
Name of Primer |
Sample collection site |
Translated Protein Sequence |
Description |
|
15UTR |
Uttarakhand |
RIHFVTTTPTRTIPALASLISPHLTQQHRPLHSTSKNGSITIRFDGV SKHVVRMMSPSGFCATKIAKGLGAKPQVGRT |
MYB Domain |
|
16UTR |
Uttarakhand |
ETQGGRGFIVSFMGSPAGTCHSIYSSASHTIVSVASYPFSGLA PAKPIPMLLPLGACEIPEKDTKLPPQVKPINKTFYFWDRSHSK RVQSESINFMWTGSFQSRAFNGHGSPWDASKLSDPDTELKSQ RARPRVATGRGHGSKIKGGPRFLWVGGHRWRRSADRPKRGEV GTIAMNVSWSFPSTYGLPRSGTINRSYAPVPRHLIFIFPLQIPASA |
PREDICTED: probable leucine-rich repeat receptor-like protein kinase At5g49770-like [Solanum tuberosum] |
|
28UTR |
Ladakh |
QLKEGRTPLFPFEGPLAPTSHSIYSSASHPIVSVPSSPPSGAPAKQ CLVRSPLAAFVRAELGHLSLEPQVKPLSKSIYFRLSISLQPSPIRIN QFHLVLANHLNLVPLMAMEAHGLHLNSQILTERNLKVKGPSQAL ATGRGGHGSKTNGGPRFLSFRAHRWRRSVNRPKRGEVGTIGLNVS WSSPSTSGLESSRNHKQILLHLSHRHLPLRFSX |
EnT-Kaurenoic acid oxidase 1(Aegilops tauschii), PPR containing protein, Ribosomal Biogenesis protein |
UTR-SSR PCR Product Sequences of polymorphic bands after cloning, sequencing, translate protein reading frames and similarity analysis by insilico analysis above.
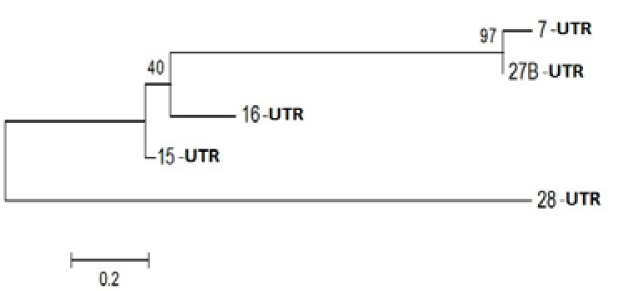
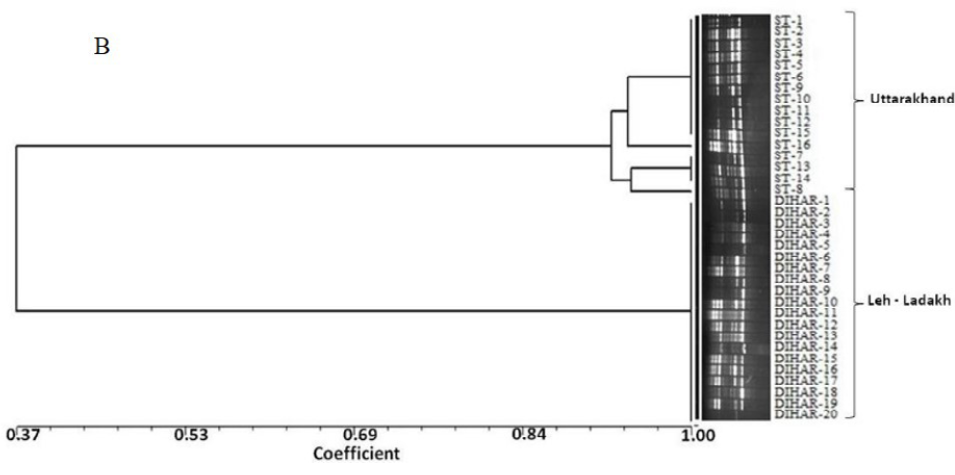
Figure 3: Phylogenetic Analysis of Nucleotide sequence which were polymorphic in seabuckthorn genotypes. Tree made by using Mega5.05, using Bootstrap value of 1000. Of given five sequences
Gene Sequencing and in Silico Analysis
On the basis of polymorphism, 12 bands were subjected to elution, cloning and after sequencing all sequence screen for bacterial sequence by VacScreen online software, find pure sequence than translate it to protein sequence with the help of online protein translate tool , all protein sequences were not find significant similarities but out of 12 only 3 sequences blast with specific functional protein which described in and unique proteins play an important role in anti-oxidant regulations like MYB Domain, Probable leucine-rich repeat receptor-like protein kinase, PPR containing protein or Ribosomal Biogenesis protein. Life depends on the existence of powerful and specific catalysts: the enzymes. Almost every biochemical reaction is catalyzed by an enzyme. The summery of all specific genes was summarized in Table 3.

Figure 4: Phylogentic Analysis of Protein sequence of similar proteins in Zea mays (ZM), Oryza sativa (OS), Hippophae rhamnoides (HR), Hippophae gyantsensis (HG) and Primer used in Seabuckthorn (ST). Using same software as above
Importance of Investigated Genes
MYB Domain: The Myb proteins bind to DNA and regulate gene expression (Ganter et al., 1999). Multiple copies of the Myb domain are frequently present as tandem repeats within a single protein. Furthermore, the conservation of the Myb domain in fungi and slime moulds suggest that this domain is at least as old as the eukaryotic homeodomain, zinc finger, and bZIP DNA-binding domains. Interestingly, some proteins with distantly related Myb domains do not appear to bind directly to DNA, but rather act as components of multi-protein machines that modify histones, the protein spools on which the DNA in eukaryotic cells is wound and compacted (Beall et al., 2002). MYB family has been found to be involved in diverse physiological and biochemical processes including the regulation of secondary metabolism (Borevitz et al., 2000; Baudry et al., 2004). Plants respond to environmental changes with a number of physiological and developmental changes to tolerate stresses (Abe et al., 2003).
Probable leucine-rich repeat (LRR) receptor-like protein kinase: The extracellular LRR and intracellular kinase domains are presumed to be under different selective constraints governed mainly by their roles (Braun and Walker, 1996). It is not known whether the kinase class will impact predictions of the binding partners of the LRR domains. However, factors that bind the cytoplasmic face of Cf9 activate a transduction pathway without enzyme activity, suggesting that structural changes are occurring (Nekrasov et al., 2006). Further, kinase domains with a strong tendency to dimerize were expected to alter the structure of the LRR domains as force is transduced through the membrane. In an extreme case, dimerization among the LRR domains and among the kinase-associated domains might be competitive (Barker et al. 2006). Yanjun Zan et al. ( 2013) was discover that the transcriptome profiling provides the first insight into the functional divergence among PtLRR-RLK gene subfamilies and suggests that they might take important roles in growth and adaptation of tree species (Figure 3).
PPR containing protein or Ribosomal Biogenesis protein: Expansion of the complement of PPR (pentatricopeptide repeat) genes within plant genomes may have occurred through gene duplication. In Arabidopsis, ancient large-scale genome duplication events have resulted in multiplication of loci and regions of synteny, where gene number and location are conserved as paralogous copies (Figure 4). Gene duplication can also arise from tandem and segmental gene duplication, creating clusters of identical genes that diverge over time (Cannon et al., 2004; Leister, 2004).
PPR genes and NBS-LRR type R genes share several features in common. Both types of genes encode proteins with a variable number of repetitive motifs, leucine-rich repeats (LRRs) in the case of NBS-LRR type R genes. In both cases, a single dominant gene determines the phenotype, and, in addition, it is the sequence variability within the repeats that lends specificity of action (Brown et al., 2003; Michelmore and Meyers, 1998; Ellis et al., 2000; Richly et al., 2002).
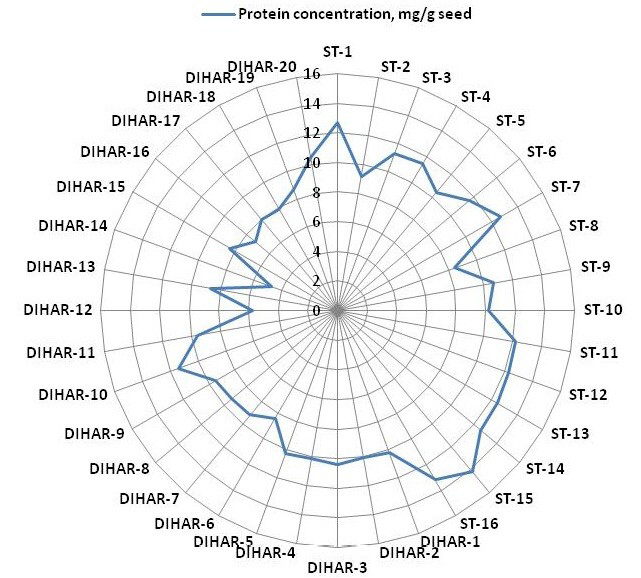
Figure 5: Spider wave chart for Total protein (buffer soluble) of seabuckthorn (DIHAR-1to 20: Hippophae rhamnoides subsp turkestanica and ST-1to 16:Hippophae salicifolia D. Don) seeds, collected from different location of Uttarakhand and Ladhakh
Protein Profiles
After quantification of TBSP (Figure 3)by using Bradford assay, the protein was run on 15% SDS-PAGE electrophoresis, the analysis of total seed protein in 36 genotypes of Seabuckthorn yielded approximately 15-35 clear and distinct polypeptide bands with molecular weights ranging from 20.1 kDa to 97.4 kDa. The total seed protein banding patterns were observed to be not identical for all the genotypes tested. However, in few genotypes, additional bands were also detected as shown in (Figure 5) and these unique bands differentiate between Uttarakhan and Leh- Ladakh germplasms, significant difference was found on the basis of banding pattern generated by SDS-PAGE. The dendrogram constructed using UPGMA cluster analysis of 36 Seabuckthorn genotypes show in Figure 6.
The buffer soluble protein from Sea buckthorn seeds ranged 04.75 to 14.10 mg/g, and from Uttarakhand collected seed protein concentration ranged between 08.30 to 14.10 mg/g, but seeds collected from Ladhakh the protein content ranged between 04.75 to 11.30 mg/g.
Analysis of Phenolics, Flavonoids and Free Readical Scavenging Activity of Sea Buckthorn Seeds
As shown in Figure 7 the total phenolics content is higher in Uttarakhand collected seeds but low in Ladakh collected seeds, but total flavonoid content was found negatively correlated with phinolics contents. The phenol contents of the Hippophae rhamnoides and Hippophae salicifolia D. Don in terms of mg gallic acid equivalent/200 mg of dry seeds sample (standard plot: y =0.028x, R2=0.992 The values were found between 33.84 to 65.66 mg catechol equivalent /200 mg of dry seeds asmple. The ST-10 contains the maximum and the DIHAR-6 contains the minimum amount of phenolic compounds. Flavonoids as one of the most diverse and widespread group of natural compounds are probably the most important natural phenols. These compounds possess a broad spectrum of chemical and biological activities including radical scavenging properties. Using the standard plot of Catechin (y = 0.02x, R2 =0.982, Figure 5), the flavonoid contents of Seabuckthorn seeds were found ranging from 1.45 to 4.79 mg Catechin equivalent/200mg of dry seeds sample. The flavonoid content of the DIHAR-19 was quite high compared to that of the ST-1, Total scavenging of antioxidant approximately same in all genotypes which show in Figure 7.
The SBT leaf alcoholic extract (100 mg/kg BW) protected the animals from chromium induced oxidative damage (Geetha et al., 2003). Besides providing protection against chromium induced oxidative injury, the SBT leaf extract also has the capability to protect the glial cells against hypoxia induced oxidative damage (Narayanan et al., 2005). Yasukawa et al. (2009) isolated and identified three phenolic compounds, (+)-catechin, (+)-gallocatechin, and (−)-epigallocatechin and a tritepenoid, ursolic acid from the active fraction of the 70% ethanol extract of SBT which exhibited remarkable anti-tumor activity.
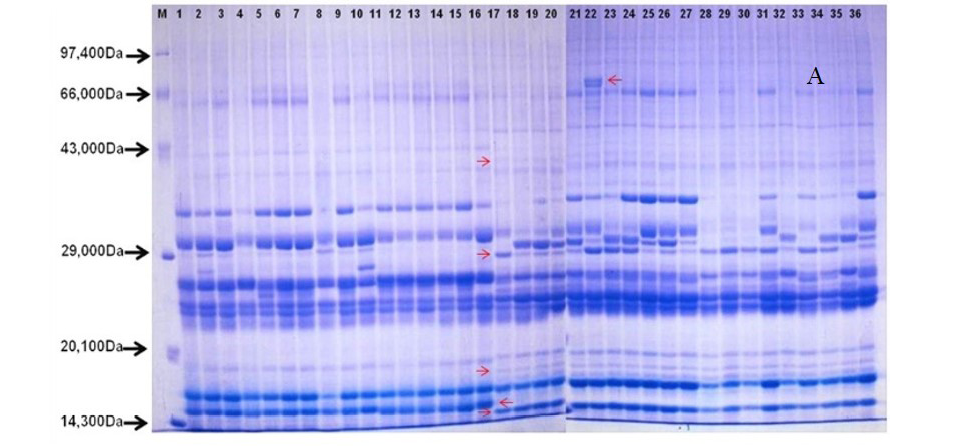

Total buffer soluble protein isolated from sea buckthorn seeds run in 15% SDS PAGE gel, A, Loading M= Medium range protein molecular weight marker, 1-16 sample collected from Uttarakhand and remaining 17-36 were collected from Ladhakh, and marking denote the unique bands. B, UPGMA Clustering generated by NTSYS Software.
The 20 seeds of H. rhamnoides and 16 of H. salicifolia D. Don were containing significant amount of phenols, flavonoids and total antioxidants. The objective of this study was to get information of the amount of phenolics and flavonoids in seeds of Hippophae rhamnoides and Hippophae salicifolia. A set of biochemical descriptors for the genus Hippophae was developed after thorough study of the germplasm obtained from explorations in different parts of India. Further intention of this study is to correlate relationship of these secondary metabolites to possible biological activities and evaluate SBT as a potential source of natural bioactive chemicals. This study provided the base to launch a breeding program for SBT improvement to exploit the potential of this magic shrub for sustainable economic development in mountain environments of the country in particular and for the world in general.
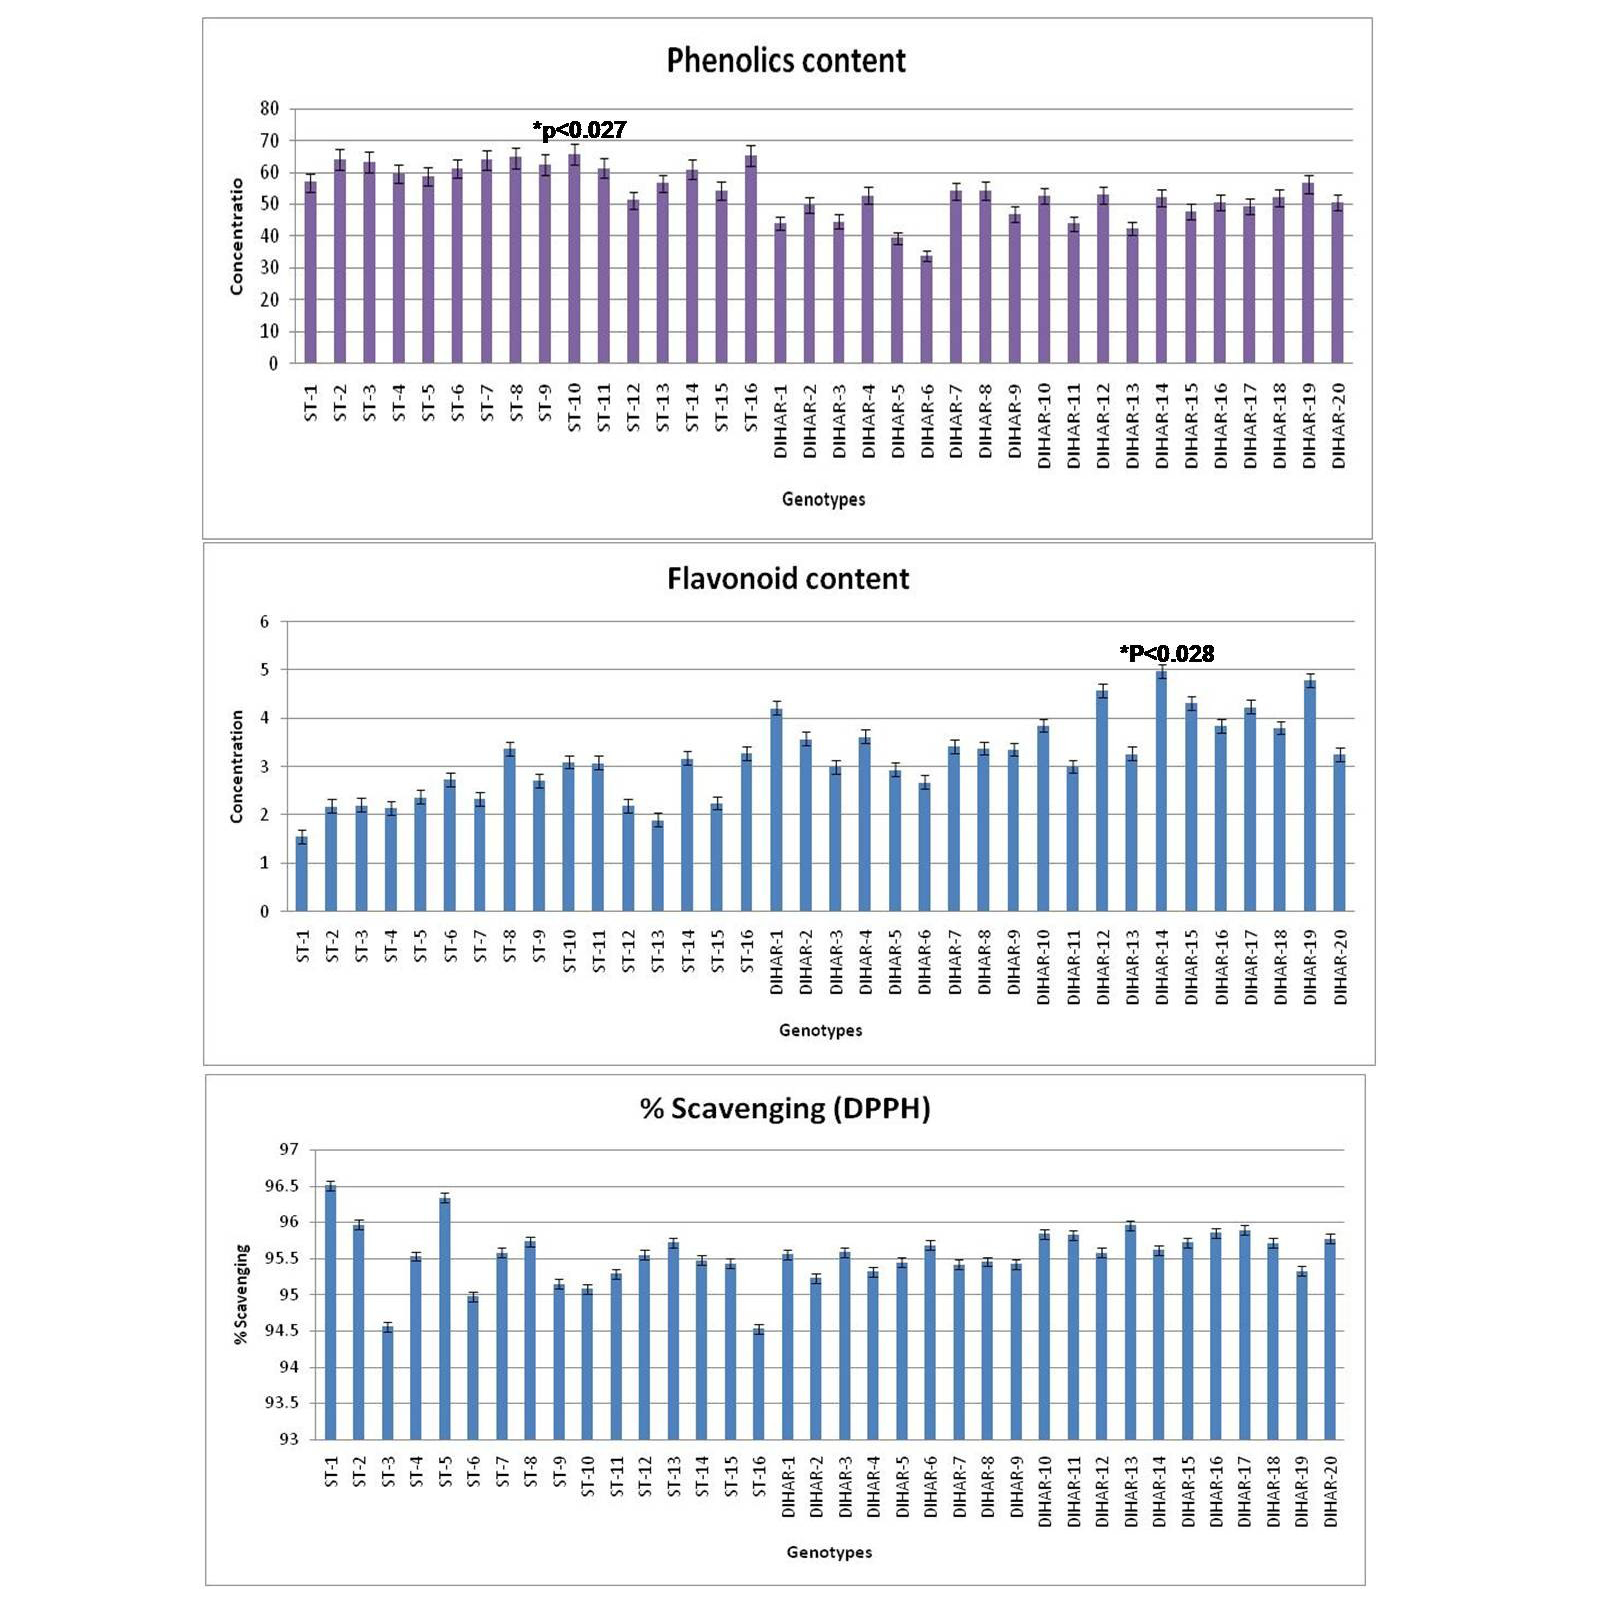
Figure 7: Graphical representation of anti-oxidant, Pattern for Total Phenolic content = Uttarakand> Ladakh, Pattern for total flavonoid content = Uttarakhand< Ladakh and Pattern for total anti-oxidant scavenging = Uttarakhand approximately same with Ladakh
Currently the results are allowing us to establish a direct and reliable relationship between molecular marker characteristics and certain morphological and biochemical parameters; approaches of molecular biology are necessary to be used to evidence specific markers.
According to Korekar et al. (2011) it was found that Antioxidant capacity in terms of IC50 value of pulp (3.39 mg ml–1) was up to 7.8 times higher than those reported for stem bark (0.43 mg ml–1) and up to 2.4 times higher than those found in seeds (1.4 mg ml–1). Further, antioxidant capacity by FRAP assay showed that the stem bark possess maximum antioxidant capacity (16.83) followed by seeds (15.26), leaves (12.73) and pulp (12.61), all as mM FeSO4. Significant correlation was found between TPC and antioxidant capacity by DPPH and FRAP assays. Korekar et al. (2013) found that the fruits were found to be rich in TPC ranging from 964 to 10,704 mg gallic acid equivalent/100 g. The free radical-scavenging activity in terms of inhibitory concentration (IC50) ranged from 0.7 to 9.1 mg/ml and ferric reducing antioxidant potential (FRAP) from 180 to 1355 FeSO4.7H2O mg/ml. The ascorbic acid and carotenoids content ranged from 56 to 3909 mg/100 g and 0.1e14.4 mg/100 g, respectively. A variation of 1e11 fold in TPC, 1e14 folds in IC50 by 2, 2-diphenyl-1-picrylhydrazyl (DPPH) assay and 1e8 fold in ferric reducing antioxidant potential, 1e70 fold in ascorbic acid content and 1e206 fold in carotenoid content among the examined fruit across 17 populations underlines the important role played by genetic background and the geographical location for determining the health promoting compounds. A clinical experiment demonstrated that Sea buckthorn seed or pulp extracts helped normalize liver enzymes, serum bile acids and immune system involved in liver inflammation and degeneration (Gao et al., 2003).
Conclusions
SSR markers have been used to assess the genetic diversity and inter- and intra-specific relationships of the genus Hippophae and to study the correlation between genetic distances and geographic distances among different genotypes of SBT. This preliminary work carried out with 36 UTR-SSR primers synthesized revealing the genetic diversity among 36 genotypes of Hippophae could be exploited further by increasing the number of SSR primers and by validating it with other available DNA markers. In this study, although SSR-PCR and SDS-PAGE profiles were reproducible and generated several bands, the banding patterns observed with protein profiling were not similar and discriminatory as observed with DNA and Proteins fingerprinting. Thus, it can be concluded that SSR-PCR and protein profiles which is a rapid and simple tool could be used in typing and differentiating a large number of SBT genotypes collected from different States and geographical region. Results obtained in this study can be considered for selection of genotype for breeding purpose to improve health promoting compounds in the seeds.
Acknowledgements
Authors acknowledge to the Department of Biotechnology (DBT) New Delhi and Dean, Hill campus, G.B. Pant Agriculture and Technology Ranichauri for providing seed materials. We also thank to Dr. V.K. Yadav, Hill campus Ranichauri, G.B. Pant Agriculture and Technology for providing guidance to the present work.
References


