Advances in Animal and Veterinary Sciences
Short Communication
Long-term Ruminal pH Measurement Using Orally Inserted Sensors in Calf
Yasin Najid1, Yvon Couture2, Sylvain Nichols2, Alian Fournier3, Dany Cinq-Mars4, Younes Chorfi1
1Département de Biomédecine Vétérinaire – Université de Montréal, Canada; 2Département de Sciences cliniques, Faculté de médecine vétérinaire–Université de Montréal, 3200 Sicotte St., P.O. Box 5000, Saint-Hyacinthe, QC, J2S 7C6, Canada; 3 Ministère d’Agriculture, Pêcheries et Alimentation du Québec, 460 Boulevard Louis-Fréchette Nicolet J3T 1Y2, Canada; 4Département des Sciences Animales, Université Laval, 2425 Rue de l’agriculture Québec, QC, G1V 0A6, Canada.
Abstract | The objective of this study was to test oral insertion of sensors in calf, and to evaluate their accuracy to measure rumen pH for 28 days. Cannulated Holstein calf (5 mo; 200 kg BW) was used in this study. Four T9 data loggers sensors L1, L2, L3, and L4 were orally inserted into the rumen at d0, d7, d14, and d21 respectively to measure ruminal pH every 5 min. Calculated averages pH of 15 min were used to compare the 4 data loggers. Oral insertions of the data loggers were successfully performed. Data logger L1 was more accurate in the beginning of the experiment than at the end. However, the correlations between calculated pH mean at 15 min (L1 vs L2, L1 vs L3, and L1 vs L4) were consistent. Thus, the T9 data loggers can be used to monitor pH measurement for a long-term period of 28 days.
Keywords | Calf, Data logger, Long-term pH measurement, Rumen
Editor | Kuldeep Dhama, Indian Veterinary Research Institute, Uttar Pradesh, India.
Received | September, 26 2014; Revised | October 18, 2014; Accepted | October 19, 2014; Published | October 28, 2014
*Correspondence | Younes Chorfi , Université de Montréal, Canada; Email: younes.chorfi@umontreal.ca
Citation | Najid Y, Couture Y, Nichols S, Fournier A, Cinq-Mars D, Chorfi Y (2014). Long-term ruminal pH measurement using orally inserted sensors in calf. Adv. Anim. Vet. Sci. 2 (9): 530-534.
DOI | http://dx.doi.org/10.14737/journal.aavs/2014/2.9.530.534
ISSN (Online) | 2307-8316; ISSN (Print) | 2309-3331
Copyright © 2014 Najid et al. This is an open access article distributed under the Creative Commons Attribution License, which permits unrestricted use, distribution, and reproduction in any medium, provided the original work is properly cited.
Measurement of ruminal fluid pH is commonly used to diagnose subacute ruminal acidosis (SARA). During last few years, different researchers had developed small stand-alone monitors such as data logger (Penner et al., 2006a, Sato et al., 2012). The data loggers were orally inserted into rumen ventral sac of sheep (Penner et al., 2009) or new-born calves (14.9±0.2 d) (Laarman et al., 2012). To orally administer data loggers, a sheep or calf were positioned to sit on their rumps. Monitoring variations of ruminal pH during SARA requires certain period of observation which can vary from few days to few weeks (Enemark et al., 2003). Previous studies used pH measurement systems for short period of time i.e. less than 7 days (Penner et al., 2009; Zhang et al., 2010; Li et al., 2011). Manufacturer suggests that when data loggers are used to monitor ruminal pH, they can lose some of their accuracy, as time goes by. Penner et al. (2006b) concluded that research is required to determine how electrode usage over time impacts baseline mV reading stability between standardizations, and concluded that daily standardization of new electrodes is not required and the duration between consecutive standardizations could be extended to 72 hrs. Therefore, the objective of this study was to use orally inserted T9 data loggers in calf, in order to evaluate their accuracy while measuring rumen pH for 28 days.
Clinically healthy cannulated Holstein calf (5 mo; 200 kg BW) was used in this study. Calf’s daily diet consisted of 3kg whole dry corn, 1Kg protein supplement, 2kg grass hay, and 130g commercial proteins, minerals and vitamins supplement (36% Veaux Lourds, La Coop fédérée, Qc). The animal was fed twice daily at 8:00 AM and 4:00 PM and had free access to fresh water. Animal care procedures followed the guidelines of the Canadian Council on Animal Care and the protocol was approved by the Animal Care Committee (CEUA) of the Faculty of veterinary medicine of the Université de Montréal.
Flexible white PVC tube with 26 mm and 33 mm for internal and external diameters respectively, was used to orally insert T9 data loggers into rumen ventral sac. Calf rumen cannula was used to determine the appropriate length of the tube. A metal detector and rumen cannula were used to verify the success of data loggers’ oral insertion.
The data loggers used were Dascor’s T9 models (Dascor, Escondido, Ca) including 1/2-AA lithium metal batteries (3.5 mV), Dascor’s model SRpH-102 pH sensors, and were 20.7 mm diameter, 140 mm length and weighted 230 g (Figures 1a and 1b).
In order to evaluate the accuracy over time, four T9 data loggers L1, L2, L3, and L4 were used to measure rumen pH. They were orally inserted into ventral sac of the rumen at d0, d7, d14 and d21 respectively. Rumen pH was continuously registered every 5 min during 28 days, and 15-min averages were calculated for statistical analysis. The T9 data logger pre and post-use standardizations were made at 38°C, using pH 4 and 7 buffers solutions (± 0.01 pH unit) (Fisher Scientific, New jersey, USA). The standardization results allowed transforming mV readings to pH values using a formula provided by the manufacturer.
Mixed procedure of SAS v.9.3 (SAS Institute Inc. 2013, Cary, N.C.) was used to determine the intra-class correlation coefficient so as to partition the variance in pH measurements among the various components. To compare the pH values of the four data loggers before and after calibration, the average of all readings was used and the analysis was carried out in a solution with pH 4 or 7. A high value of the intra-class correlation coefficient suggests that the two readings are close. Readings OF pH from two data loggers were compared at each 15-min intervals and in this case a high intra-class correlation coefficient indicates that the two data loggers provide similar readings. The analysis was used to compare pH values of data logger installed at d0 (L1) with those installed at d7 (L2), d14 (L3) and finally d21 (L3).
In our knowledge, no study had described the data logger’s oral insertion in young calves. The PVC tube (Figure 1c) allowed the oral insertion of a data logger accurately in the rumen and the adequate tube length was 152 cm for rumen deposition. Once in the rumen, the data loggers took approximately 15 to 20 minutes to reach the bottom as revealed by metal detector and manual check through the cannula.
Pre and post-standardization results are presented in table 1. The intra-classes coefficients of correlation were 0 and 0.66 respectively for standardization at pH 4 and at pH 7, this means that there was a significant difference between pre and post-standardization at pH 4, but no significant difference at pH 7. The difference between pre and post-use standardization at pH4 suggests that both pre and post-use standardization were essential to transform mV readings to pH values. However, the maximum error recorded when measuring the pH of buffer solutions was only 0.13. Penner et al. (2007) showed maximum possible errors for T7 data loggers between consecutive standardizations; 0.17 and 0.18, and 0.10 pH units for readings after 24, 48, and 72 hrs, respectively, within a pH range of 4.5 to 7.0. Data logger pH measurements are presented in Figure 2. The intra-classes coefficients of correlation were 0.81, 0.75, and 0.69 for L1 vs L2 at week 2, L1 vs L3 at week 3, and L1 vs L4 at week 4. Thus, the data logger L1 was more accurate in week 2 than in week 3, and more accurate in week 3 than in week 4. However, the intra-class coefficients of correlation suggest that the pH measurements at each 15 min were concordant (L1 vs L2, L1 vs L3, and L1 vs L4).
In the present study, the maximum difference between data logger pH measurements was 0.99 units. Previous studies in dairy cows, have shown that mean pH measurements can vary from 0.07 to 0.39 between continuous recording system and spot sampling methods (Alzahal et al., 2007; Sato et al., 2012). Duffield et al. (2004) have demonstrated that pH varies within the rumen, and the difference between cranial-ventral and central pH can reach 0.32 units. Thus, the reported differences in the present study may also be attributable to natural rumen pH variations.
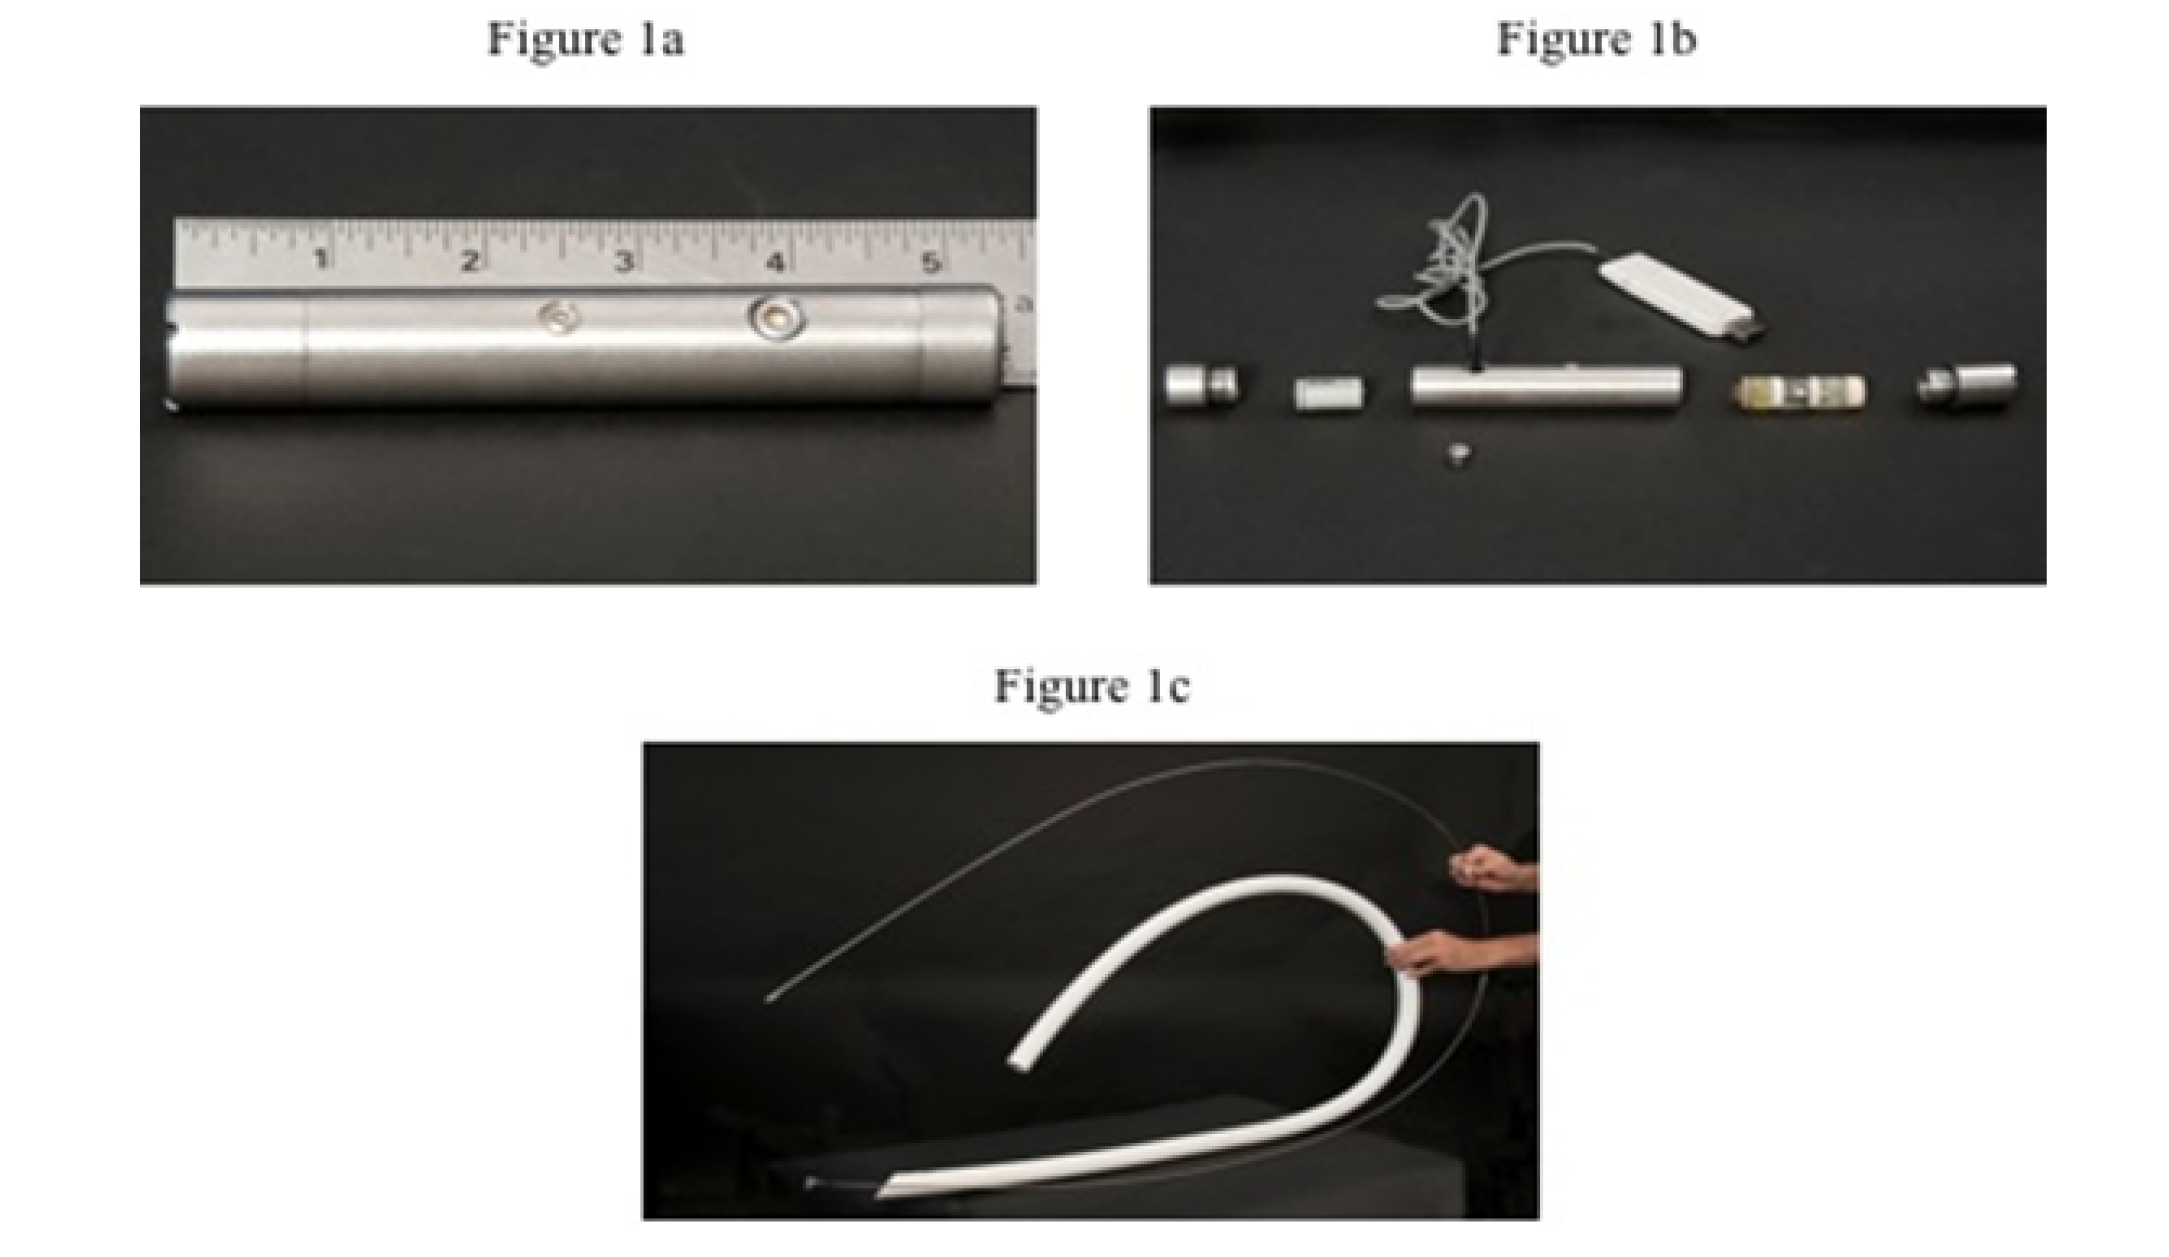
(Fig. 1a) and unassembled form (Fig. 1b); parts from left to right: threaded cap, 1/2 AA Lithium metal battery (3.6 mV), metal capsule which house the data logger, SRpH-102 pH sensor, pH sensor slip cap, and above a USB serial interface cable. Flexible white PVC tube (Fig. 1c), 230 cm total length, 26 mm and 33 mm for internal and external diameters respectively, used to orally insert T9 data logger into reticulum and rumen ventral sac, and a thin metal stem used to push data loggers inside PVC tube.
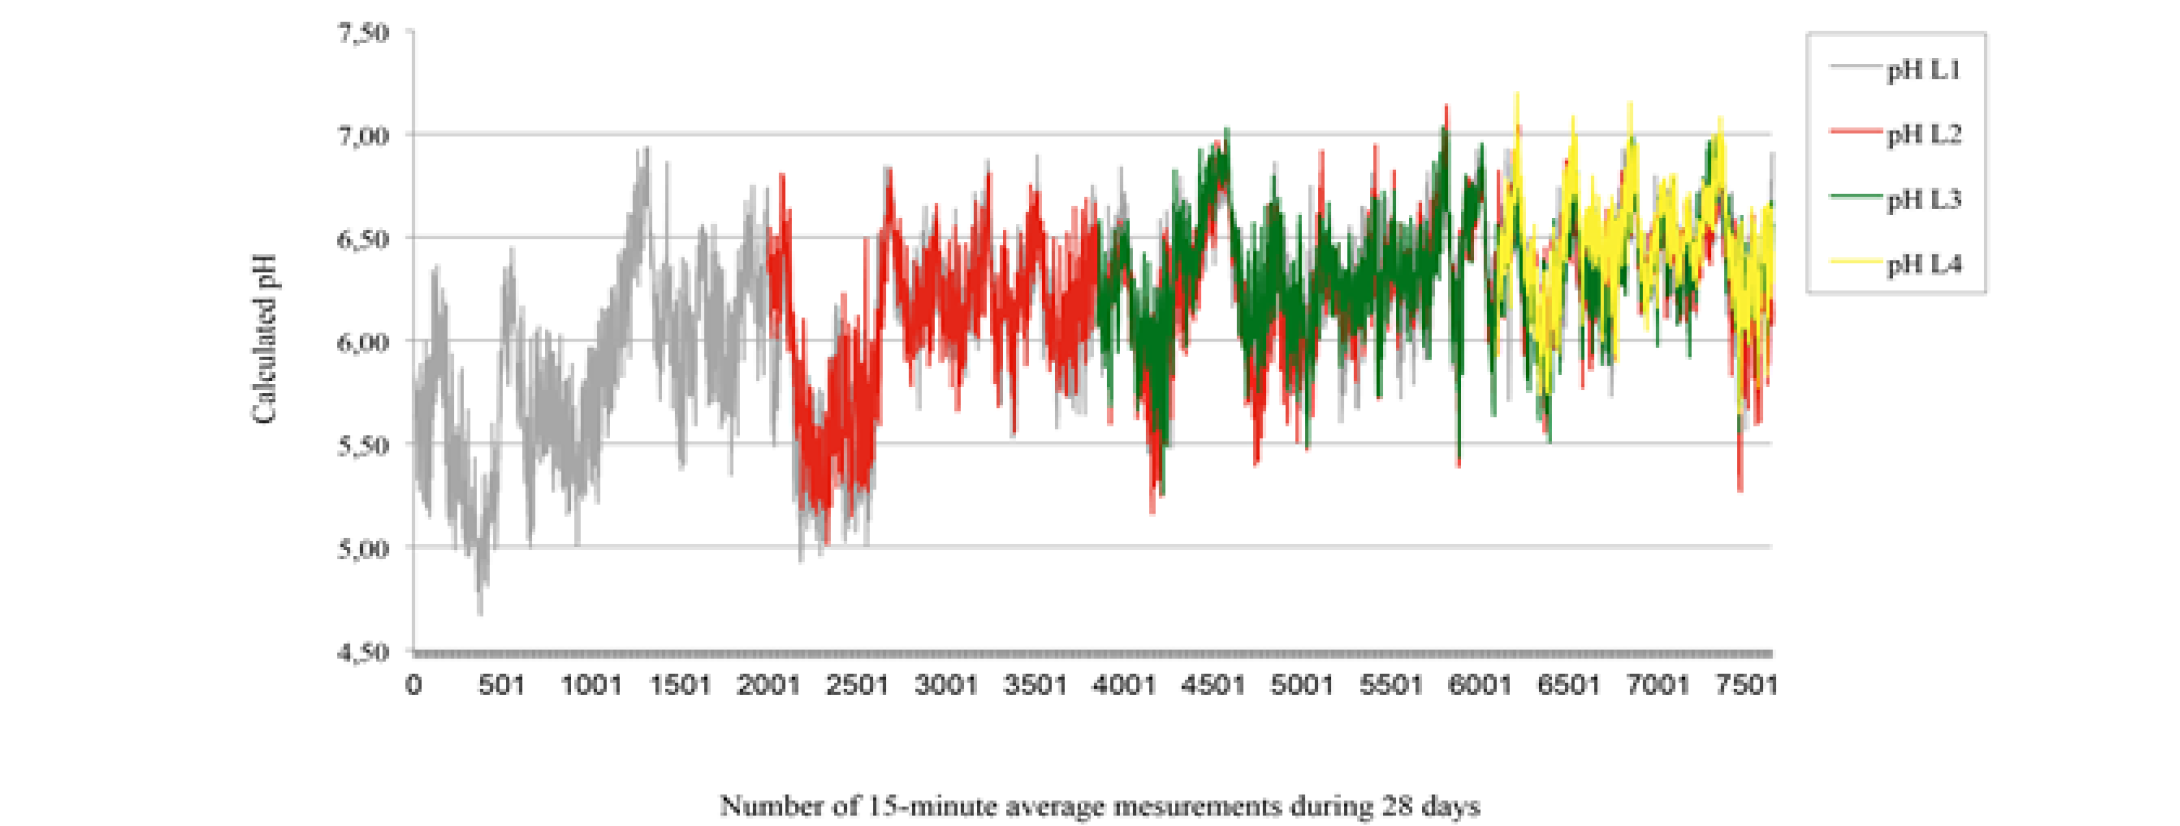
: 28-day rumen pH measurements in calf using T9 data loggers L1 (grey), L2 (red), L3 (green), and L4 (yellow) inserted at d0, d7, d14, and d21 respectively. Calculated pH are means of 15 min pH measurements registered at 5 min interval.
Table 1: Results of pre and post standarization (mean ± SD) in buffer solutions of pH 4 and 7 of four T9 data loggers used to measure ruminal pH in calf.
|
Data Loggers |
Pre-standardization |
Post-standardization |
Intra-classes coefficient of correlation |
|
pH4 |
pH4 |
||
|
L1 |
4.12 ± 0.00 (7) |
4.05 ± 0.03 (19) |
0.00 |
|
L2 |
3.95 ± 0.00 (12) |
4.09 ± 0.02 (14) |
|
|
L3 |
3.96 ± 0.00 (8) |
4.05 ± 0.06 (18) |
|
|
L4 |
3.98 ± 0.00 (8) |
4.01 ± 0.02 (20) |
|
|
pH7 |
pH7 |
||
|
L1 |
6.91 ± 0.01 (6) |
7.05 ± 0.00 (17) |
0.66 |
|
L2 |
7.11 ± 0.01 (13) |
7.13 ± 0.00 (19) |
|
|
L3 |
7.01 ± 0.02 (9) |
7.01 ± 0.01 (19) |
|
|
L4 |
6.95 ± 0.03 (7) |
6.95 ± 0.01 (18) |
( ) : number of measures
This study showed that oral insertion of T9 data logger is a non-invasive method that could be an acceptable alternative to rumen cannula for pH measurement. However, T9 data loggers were less accurate over time; nevertheless, the intra-class coefficients of correlation showed no difference between the 4 data loggers even though they were used at different time. Thus these devices can be used to monitor SARA for at least 28 days, but a post-standardizations at pH4 and pH7 are recommended.
Reference


