Advances in Animal and Veterinary Sciences
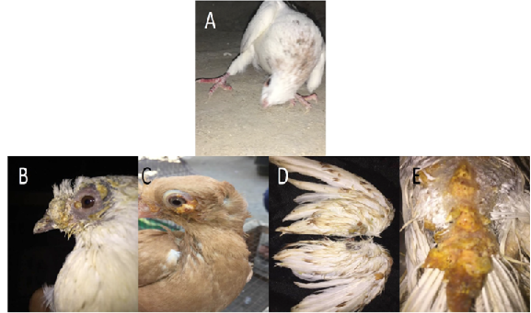
Gross pictures showing torticollis in pigeons infected with ND, (A) In case of PD, multiple yellowish nodules were observed on feathered and unfeathered skin in the head, beak (B), eyes (C), wings (D), back (E).
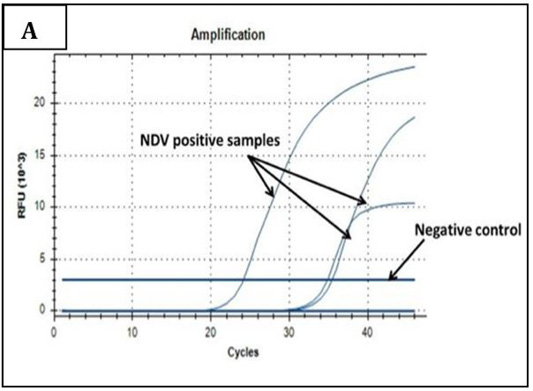
Amplification plot of RT-PCR in NDV molecular detection. Three field samples gave positive amplification with threshold cycles (Ct) ranging from 24-35. The negative control sample gave no amplification signals.
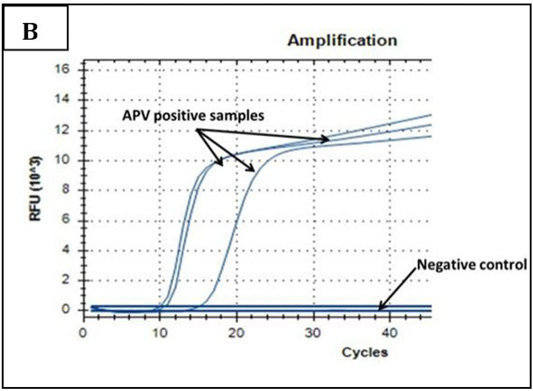
Amplification plot of PCR in PD molecular diagnosis. Three field samples gave positive results with threshold cycles (Ct) ranging from 11-15. The negative control sample gave no amplification signals.
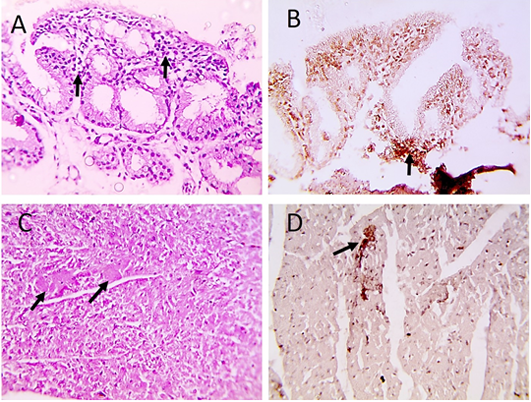
Microscopic pictures of PCR positive specimens for ND showing heterophilic infiltration in tracheal mucosa (black arrows) (A), few necrotic cardiomyocytes (black arrows) (C), HandE. PPMV-1 viral antigen is positively stained by IHC in tracheal mucosa (black arrows) (B) and in cardiomyocytes (black arrows) (D), IHC counterstained with Mayer’s hematoxylin, X: 400.

Microscopic pictures of PCR positive specimens for ND showing necrotizing pneumonia (black arrows) (A) with hyperplasia of bronchus associated lymphoid tissue (black arrows) (B), meningeal congestion (black arrowhead) and hemorrhage (black arrow) (D), marked cerebral congestion (black arrows) (E), HandE. PPMV-1 viral antigen is positively stained by IHC in alveolar wall (black arrows) (C) and in cerebral cortex (black arrows) (F), IHC counterstained with Mayer’s hematoxylin, X: 400.
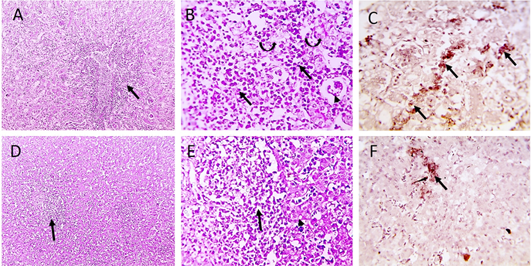
Microscopic pictures of PCR positively infected pigeon with NDV showing tubulointerstitial nephritis (staright black arrows) with tubular epithelial degeneration (curved black arrows), tubular epithelial necrosis (dashed black arrows) and atrophied glomeruli (black arrowheads) (A and B). Hepatitis with hepatocellular vacuolar degeneration (black arrowhead) and necrosis and high number of macrophages in sinusoids and space of Disse (black arrows) (D and E), H and E. PPMV-1 viral antigen is positively stained by IHC in interstitial renal tissue (black arrows) (C), in hepatic sinusoids and space of Disse (black arrow) (F), IHC counterstained with Mayer’s hematoxylin (A, D X:100; B, E, C, F X: 400).
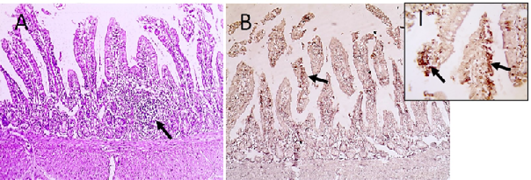
Microscopic pictures of PCR positive specimens for ND showing lymphoid aggregation (hyperplasia of gut associated lymphoid tissue) was noticed in duodenal mucosa (black arrows) (A), X:400. HandE. PMV-1 viral antigen is positively stained by IHC in intestinal epithelial cells and villous lamina propria (black arrows) (B and I), IHC counterstained with Mayer’s hematoxylin, X:100 and insert (I) X: 400.
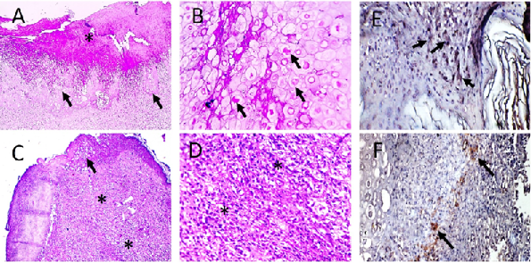
Microscopic pictures of PCR positive skin for PD showing thick keratinaceous and amorphous crust and necrosis (*) (A), hypertrophy and hyperplasia of epidermal stratified squamous epithelium having pale foamy vacuolated cytoplasm and dense eosinophilic ICIB (black arrows) (B), severe heterophils and lymphocytic cells infiltration in superficial and deep dermis (*) (C and D). HandE (A and C X:100; B and D X:400). Avipoxvirus viral antigen is positively stained by IHC in epidermal cells and in dermal infiltrating leukocytes (E and F), IHC counterstained with Mayer’s hematoxylin, X: 400.
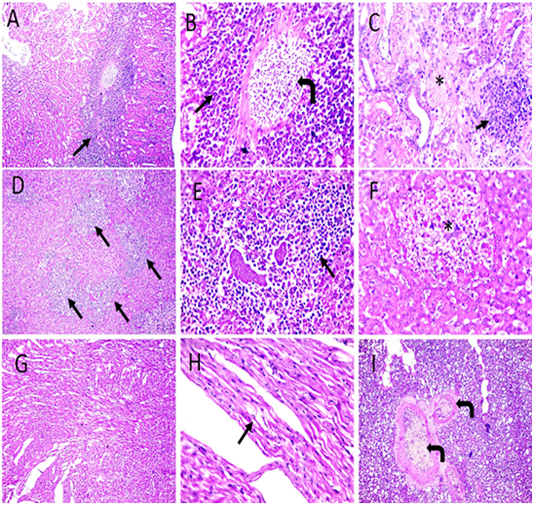
Microscopic pictures of PCR positive specimens for PD showing congestion (right angled black arrows), interstitial nephritis characterized by MNC infiltration admixed with RBCs mainly in perivascular space extending to interstitial tissue (black arrows) causing destruction of renal tubules accompanied with tubular necrosis in adjacent parenchyma (*) in kidneys (A-C). Perivascular infiltration with heterophils and lymphocytes (black arrows) with multifocal areas of necrosis (*) (D-F). Vacuolation in cardiac muscle fibers (black arrows) (G and H). Congestion of pulmonary blood vessels (black arrows) (I). H and E (A, D, G X: 100; others X: 400).
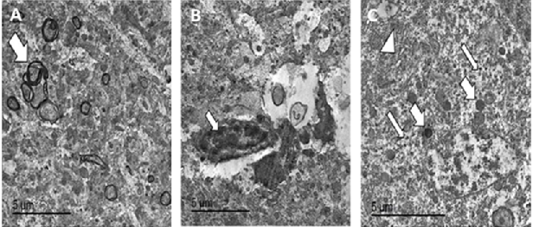
TEM micrographs from brain of PCR positively infected pigeon with NDV showing redundant axon (white arrow) (A), intranuclear electron dense inclusion body intranuclear electron dense inclusion body (white arrow) (B), hypertrophied neuron showing numerous electron dense granules clumping (thin white arrows), dilated mitochondria (thick white arrows) and dilated RER (white arrowhead) (C), bar =5 µm.
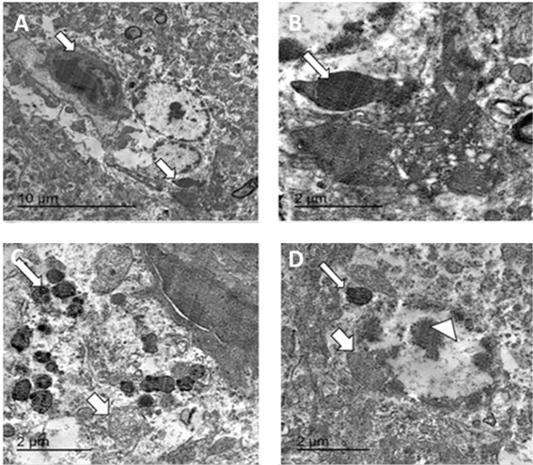
TEM micrographs from brain of infected pigeon with NDV showing neuron having intracytoplasmic electron dense inclusion bodies containing nucleocapsid (white arrow) (A) Bar=10µm, high magnification of neuron showing large globular electron dense intracytoplasmic inclusion body (white arrow) (B) Bar=2µm, hypertrophied neuron with numerous intracytoplasmic globular electron dense inclusion bodies (thin arrow) with marked mitochondrial dilation (thick arrow) (C) Bar=2µm, hypertrophied neuron with dilated mitochondria (thick arrow), intracytoplasmic (thin arrow) and intranuclear electron dense inclusion bodies (arrowhead) (D) bar =2 µm.
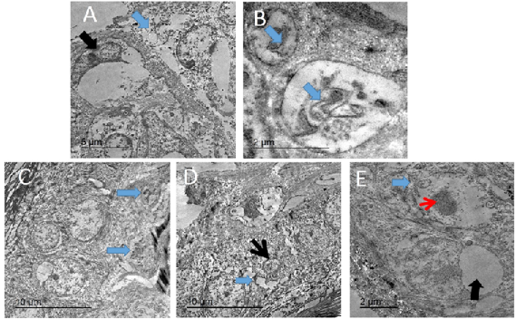
TEM micrograph of skin of PCR positively infected pigeon with PD showing swollen cells with damaged cytoplasmic organelles, nuclear membrane rupture (blue arrow) and compressed nucleus with electron lucent homogenous materials containing remnant of cytoplasmic organelles (black arrow). Bar= 5 µm (A), intracytoplasmic electron lucent inclusion bodies containing cellular debris (blue arrows) Bar=2 µm (B), two intracytoplasmic electron lucent bodies containing cellular debris (blue arrows). Bar= 10 µm (C), dilated intercellular spaces (blue arrow) with shrunken of individual cell nucleus (black arrow). Bar=10 µm (D), Swollen cells with marked loss of cytoplasmic organelles (blue arrow) and chromatin condensation of the nucleus (red arrow). Other showing large intracytoplasmic electron lucent vacuole compressing nucleus (black arrow). Bar=2 µm (E).


