Advances in Animal and Veterinary Sciences
Research Article

Mitochondrial Activity and Transcript Abundance of Quality Marker Genes during In vitro Maturation of Bovine and Buffalo’s Oocytes
Nasser Ghanem1,2*, Romysa Samy1, Beshoy SF Khalil2, Ibrahim Abdalla Hassan Barakat3,4, Ahmed Yousry Sayed Ahmed5, Esraa Moheb Ahmed Ismail5, Ayman A. Diab5, Gehan Safwat5, Md. Fakruzzaman6, Il-Keun Kong7
1Department of Animal Production, Faculty of Agriculture, Cairo University, Giza, Egypt; 2Cairo University Research Park (CURP), Faculty of Agriculture, Cairo University, Giza, Egypt; 3Zoology Department, College of Science, King Saud University, P.O. Box 2455, Riyadh 11451, Kingdom of Saudi Arabia; 4Cell Biology Department, National Research Center, 33 Bohouth St., Dokki, Giza, Egypt; 5Faculty of Biotechnology, October University for Modern Sciences and Arts– MSA University, Giza, Egypt; 6Department of Genetics and Animal Breeding, Patuakhali Science and Technology University, Out Campus, Khanpura, Babuganj, Barishal-8210, Bangladesh; 7Division of Applied Life Science (BK21), Graduate School of Gyeongsang National University, Jinju 660-701, Republic of Korea.
Abstract | In vitro embryo production is a well-known biotechnology tool to improve and sustain animal productivity. Therefore, optimization of this technique would enhance both animal productivity and farm profitability. The aim of the present study was to compare the mitochondrial activity and patterns of expression of genes that contribute to its regulation during the in vitro maturation of buffalo (Bubalus bubalis) and bovine (Bos indicus) oocytes. Ovaries were collected from local Egyptian abattoirs and cumulus-oocytes complexes (COCs)were aspirated from 2-8mm follicles diameter and were divided into four categories according to oocyte morphology. The grade A and grade B were cultured in TCM medium (supplemented with all required chemicals and hormones) for 22 hours at 38.5o C and collected after their in vitro maturation (IVM). The total RNA of the oocytes was then extracted and target mitochondrial transcripts (TFAM and CPT2) were analyzed by real-time PCR. The results of this work revealed the intensity of mitochondria and lipids was reduced in good than bad matured bovine oocytes. However, there was no change of mitochondrial and lipid fluorescent intensities of bad quality oocytes before and after in vitro maturation. The expression profile of CPT2 gene was higher in immature compared to matured oocytes of bovine while, buffalo oocytes did not shown differences in the expression of this gene. Furthermore, the expression profile of CPT2 gene was lower in immature and matured buffalo oocytes than those of bovine. The transcript abundance of TFAM did not indicate any differences among in vitro maturation of both species. It was concluded that the patterns of the gene expression of CPT2 vary during in vitro maturation of bovine oocytes in reflecting their maturation competence than that of buffalo. Increased metabolic activity of oocytes during IVM is in line with CPT2 expression that is involved in lipid oxidation required for this process.
Keywords | Oocyte quality, Gene expression, mRNA, IVM
Received | May 31, 2021; Accepted | July 08, 2021; Published | September 25, 2021
*Correspondence | Nasser Ghanem, Department of Animal Production, Faculty of Agriculture, Cairo University, Giza, Egypt; Email: nassergo@agr.cu.edu.eg
Citation | Ghanem N, Samy R, Khalil BSF, Barakat IAH, Ahmed AYS, Ismail EMA, Diab AA, Safwat G, Fakruzzaman M, Kong IK (2021). Mitochondrial activity and transcript abundance of quality marker genes during in vitro maturation of bovine and buffalo’s oocytes. Adv. Anim. Vet. Sci. 9(11): 1810-1815.
DOI | http://dx.doi.org/10.17582/journal.aavs/2021/9.11.1810.1815
ISSN (Online) | 2307-8316; ISSN (Print) | 2309-3331
Copyright © 2021 Ghanem et al. This is an open access article distributed under the Creative Commons Attribution License, which permits unrestricted use, distribution, and reproduction in any medium, provided the original work is properly cited.
INTRODUCTION
The mammalian cumulus-oocyte complexes have all cytoplasmic, nuclear and molecular constituents required for orchestrating early preimplantation development (Ghanem et al., 2020; Mtango et al., 2008; Sirard et al., 2006). The oocyte is formed by sequence of controlled events within the ovary during fetal life and terminates with the ovulation of metaphase II oocyte during postnatal life (Picton et al., 1998). In bovine, when diameter of the ovarian follicle reached up to 2mm the oocytes diameter is approximately 110 μm, and acquires the ability to resume meiosis and supporting embryonic development (Fair et al., 1995; Hyttel et al., 1997).
The mitochondrial organization and distribution is linked with nuclear maturation rate of bovine oocytes (Silva et al., 2013). Ghanem et al. (2021) has reported increased rate of mitochondrial central distribution of buffalo competent oocytes (BCB+). On the other hand, the rate of diffuse mitochondrial distribution was increased in competent (BCB+) compared to less competent (BCB-) porcine COCs after IVM which is coupled with improvement of developmental capacity (Fu et al., 2015).
The efficiency of nuclear maturation and embryo development of buffalo derived COCs under in vitro culture condition are lower than that of bovine species (Madan et al., 1994a, b, 1996). The quality of COCs is a determining factor for the efficiency of in vitro embryo preimplantation development (Rizos et al., 2002). In addition, intracellular mitochondrial intensity and genes regulating their activity are indicators of oocyte ability to develop to embryo under in vitro conditions (Silva et al., 2013; Torner et al., 2008). Therefore, the objective of the present study was to compare the mitochondrial activity and patterns of expression of genes that contribute to its regulation during the in vitro maturation of buffalo (Bubalus bubalis) and bovine (Bos indicus) COCs.
MATERIALS AND METHODS
This study was done on Cairo University Research Park. All chemical were purchased from Sigma-Aldrich except mentioned in the text.
Experimental design
This study is performed to understand the molecular regulation of mitochondrial activity in competent bovine oocytes compared to incompetent buffalo oocytes during in vitro maturation. Oocyte quality was evaluated under a stereomicroscope and scored into four grades according to the homogeneity of the cytoplasm and layers of cumulus cells. Good quality oocytes were recovered of both species were in vitro matured using the same media under the same conditions. Following in vitro maturation, oocytes were denuded from cumulus cells and stored at -80o C untiltotal RNA was isolated. Six groups of both immature and matured oocytes of each species were used for RNA isolation and quantitative real-time PCR. Moreover, six groups of both immature and matured oocytes of each species were fixed in parafomldehyde for mitochondria and lipid staining.
Oocytes recovery
Shortly after the bovine and the buffalo were slaughtered, ovaries were obtained from nearby abattoir. The ovaries were brought to the lab in a thermos flask filled with warm saline solution (37 ℃) supplemented with 1.0% antibiotic (gentamicin sulphate). The ovaries were then washed three times with physiological saline, twice with ethanol 70% and finally with physiological saline twice. All visible ovarian follicles with size of 3 to 8 mm of each species (bovine and buffalo) were recovered separately. The media used for recovery consists of tissue culture media (TCM 199) supplemented with 2% fetal calf serum (FCS), 0.3 mg/mlglutamine and 50 µg/ml antibiotic (gentamicin sulphate). The cumulus oocytes complexes (COCs) were recovered by aspiration using syringe attached to 10-gaugeneedle.
Oocytes evaluation and in vitro maturation
The aspirated content was poured from the bottom of the falcon tube and added in a washing petri dish plate which is then was put under the stereomicroscope (Leica, Bensheim, Germanys). The cumulus oocytes complexes were collected grouped into three groups depending on their overall morphology of oocyte cytoplasm and the number of cumulus cell layers according to Ghanem et al. (2021) under the microscope.
Cumulus-oocytes complexes were in vitro matured in media composed of TCM 199-HEPES supplemented with 0.15 mg/ml glutamine, 10% FCS, 22 μg/ml Na-pyruvate, 1µg/ml estradiol 17 β, 0.02 IU/ml FSH and 50 μg/ml gentamycin. The culture dish (3cm petri dish) was then prepared by adding the in vitro culture media in a volume of 100 µl micro drops. The selected oocytes were transferred into the micro drops where 50 oocytes incubated in each drop and finally covered with mineral oil. The culture dish was incubated at the incubator (Binder, York, UK) at 38.5 oC, 100% humidity, 5% CO2, 5% O2 and 90% N2 for 22 hrs according to Ghanem et al. (2021).
Denudation of oocytes
Cumulus cells were removed by repeat pipetting of intact COCs oocytes in into IVM medium supplemented with 0.25% of hyaluronidase. The denudation was confirmed by carefully check under stereomicroscope (Leica, Bensheim, Germanys).
Fixation of oocytes
Immature and in vitro matured oocytes were washed three times in 0.3% (wt/vol) PVP in 1 M PBS (PVP-PBS). The washed oocytes were fixed in 4% paraformaldehyde in PVP-PBS for 30 min at least according to Ghanem et al. (2021).
Mitochondria and lipid staining
The oocytes of each species were stained for lipid using Nile red (10 mg/ml, Sigma-72485, USA) dissolved in PVP-PBS solution (0.3% [wt/vol] PVP in 1 M PBS) for 3 hours in the dark at room temperature according to Ghanem et al. (2021). The fluorescent stained oocytes were then washed three times using PVP-PBS solution for 15 minutes each.
Following lipid staining, the oocytes were stained for mitochondrial activity evaluation. The staining of mitochondria was done using Mito Tracker flourscent dye (125Nm, Invirogen-M7514, USA) dissolved in DMSO and incubated for 5 minutes in the dark at room temperature according to Ghanem et al. (2021). A washing step was done for stained oocytes using PVP-PBS solution for three times 15 minutes each. Thereafter, the stained oocytes were mounted on glass slide with glycerol and covered with glass slip. To capture the fluorescent image of each stained oocyte, microscope provided with a fluorescence unit was available for measuring of both Nile red and MitoTracker dyes at 580–596 nm emission. The fluorescent images of stained oocytes were saved and anlysed by Image J software. The data of fluorescence intensity were presented as mean ± SD.
RNA extraction
RNA was extracted from 30 oocytes using Arcturus picopure RNA isolation kit (Cat# 12204-01 Thermo Fisher Scientific, USA) with respect to the manufacturer’s protocol. The oocytes were washed several times with PBS. Then, the oocytes are put in a 0.1% of pronase for two to five minutes. Afterwards, the oocytes were washed in pre-warmed DEPC water. Next, the oocytes were placed in 1.5ml RNase free tube. Extraction buffer (100 µl) were added followed by pipetting. The sample was then incubated for 30 minutes at 42 oC followed by centrifugation at 3000g for two minutes. Later, the supernatant was transferred in a new 1.5ml RNA free tube. Conditioning buffer (250 µl) was added to the RNA free tube which is then incubated for 5 minutes at room temperature. The tube was then centrifuged at 16000g for one minute. After then, 70% ethanol (100 µl) were added to cell extract from RNA extraction followed by pipetting. The mixture was then added to the column and centrifuged at 100g for two minutes.
The sample was centrifuged again for 30 seconds at 1600g. Then, 100 µl of wash buffer I were added followed by centrifugation of the sample for 1 minute at 8000g. A mixture containing 5 µl of DNase I and 35µl of RDD was added to the sample and mixed gently. The sample was then incubated at room temperature for 15 minutes followed by the addition of 100 µl of wash buffer II and centrifuged at 16000g for two minutes. The sample was centrifuged again at 16000g for one minute. The column was then transferred to a new 1.5 ml tube followed by the addition of 20 µl of elution buffer. The sample was then incubated for one minute at room temperature. Afterwards, the sample was centrifuged twice, once at 1000g for one minute and the other at 16000g for one minute. The RNA concentration and quality was measured using Nano Drop 2000C instrument (Thermo Scientific, Wilmington, DE, USA) and considering the reading at A260/280 nm.
cDNA synthesis
For removal of any DNA contaminants, digestion of DNA was done using DNA digestion kit (Thermo Scientific, California, USA) by adding to RNA (1 µg), the mix of 10X reaction buffer with MgCl2 (1 µl), DNase I (1 µl) and water nuclease free to reach 10 µl total volume. The tube was then incubated at 37 0 C for 30 min. Subsequently, 1 µl 50 mM EDTA was added followed by incubation at 65 oC for 10 min. The prepared RNA was later used as a template for reverse transcription.
The cDNA synthesis was performed using the Revert Aid First Strand cDNA Synthesis kit (Thermo Fisher Scientific, USA). In a sterile nuclease free tube on ice, the following reagents were added, 5 µg of total RNA, 1 µl of oligo (dt) 18 primer, and 12 µl of water nuclease free. Afterwards, the following components were added, 4 µl of 5X reaction buffer, 1µl of RiboLock RNase inhibitor, 2 µl of mM dNTP mix, and 1 µl of RevertAid M-MulV RT. The sample was mixed by pipetting, incubated at 42 ℃ for 60 min and the reaction was then terminated by heating at 70 ℃ for 5 min.
Quantitative real-time PCR
The pair of primers specific to each target genes (Table 1) were designed by primers3 program (https://primer3.ut.ee/) from available gene sequence in NCBI Gene bank database. In addition, gene namely GAPDH was used as housekeeping transcript for normalization and data analysis. For real-time PCR reaction, the following reagents were mixed well, thawed on ice, Sybr Green qPCR Master Mix (Thermo Fisher Scientific, USA), supplemented with Rox dye, template DNA, primers and nuclease-free water. In a qPCR tube, the following components were added, 12 µl of Maxima Sybr Green qPCR Master Mix, 5µl Rox, 0.5 µl of forward primer (10 µM), and 0.5 µl of reverse primer (10 µM), 2 µl of template DNA, and nuclease-free water to 20 µl. The qPCR reactions were performed according to the following cycling program: 50 ℃ for 2 min, 95 ℃ for 10 min followed by cycling step for 40 cycles of 95 ° C for 15 second and at 60 ° C for 1 minute. Finally, the melt curve was generated at 95°C for 15 seconds and 60℃ for 1 minute.
Table 1: List of sequences of primers used for quantitative real-time PCR.
| Gene Name | Gene bank accession number | Primer sequence | Fragment size (bp) |
| CPT2 | NM_001045889 |
F: 5’-CCGAGTATAATGACCAGCTC-3’ R: 5’-GCGTATGAATCTCTTGAAGG-3’ |
152 |
| TFAM | NM 001034016 |
5′-CTGGTCAGTGCTTTGTCTGC-3′ 5′-CTAAAGGGATAGCGCAGTCG -3′ |
128 |
| GAPDH | NM_001034034.2 |
F: 5’- AGGTCGGAGTGAACGGATTC -3’ R: 5’- GGAAGATGGTGATGGCCTTT -3’ |
219 |
Abbreviations: PCR, polymerase chain reaction; bp, base pair.
Statistical analysis
Relative expression was calculated using the relative quantification method (2-ΔΔCT method) (Ghanem et al., 2021). The relative gene profile expressed data were analyzed by using the general linear model procedure (SAS, 2004). Fluorescent intensity data were analyzed by one-way ANOVA. Significant differences between groups were detected using Duncan’s multiple range test. Differences with P < 0.05 were considered significant.
Table 2: Fluorescent intensity of mitochondrial activity and lipid content of buffalo oocytes during in vitro maturation. Values with different superscripts (a, b, c, d) are significantly different at p≤0.05.
| Trait |
Good |
Bad |
||
| Immature (n=15) | Matured (n=12) | Immature (n=10) | Matured (n=8) | |
|
Mitochondrial activity /106 |
4.97a±0.18 |
1.46b±0.18 |
2.75a±0.18 |
1.13b±0.18 |
|
Lipid content/106 |
3.15a±0.09 |
1.28b±0.09 |
2.25a±0.09 |
0.86b±0.09 |
RESULTS AND DISCUSSION
This study was designed to characterize the metabolic activity of oocytes with different quality and to compare expression of selected mitochondrial genes (TFAM and CPT2), during maturation in bovine and buffalo oocytes. The results of this work revealed that the fluorescent intensity of mitochondria and lipids was higher in good quality than bad quality bovine oocytes (Table 2, Figure 1). In addition, the intensity of mitochondria and lipids was reduced in good than bad matured oocytes (Table 2, Figure 1). However, there was no change of mitochondrial and lipid fluorescent intensities of bad quality oocytes before and after in vitro maturation (Table 2, Figure 1). Silva et al. (2013) have reported enhancement of nuclear maturation and predominance of centrally located mitochondria in good quality (BCB+) than that of low quality (BCB-)bovine oocytes. Buffalo in vitro matured BCB+ oocytes that cultured under low (5%) and high oxygen (20%) tension had higher rate of central mitochondrial distribution (Ghanem et al., 2021). The distribution of porcine oocyte mitochondria was considered a good indicator of cytoplasmic maturation (Fu et al., 2015). Indeed, the oocytes depends on mitochondrial metabolic activity to produce enough ATP required during in vitro maturation and further embryo development (Krisher et al., 2007).
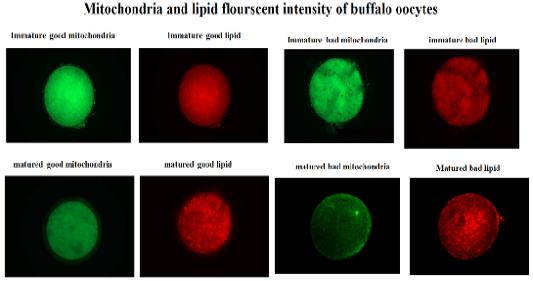
Figure 1: Fluorescent intensity of mitochondrial activity and lipid content of buffalo oocytes during in vitro maturation. Values with different superscripts (a, b, c, d) are significantly different at p≤0.05
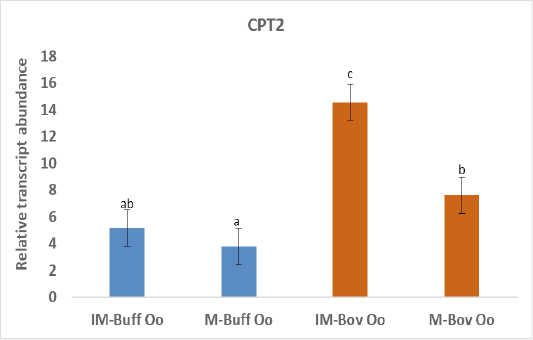
Figure 2: Relative gene of CPT2 in bovine and buffalo oocytes during in vitro maturation. Values with different superscripts (a, b, c, d) are significantly different at p≤0.05.
The biogenesis of mitochondria is crucial to support the increasing demand for energy during the maturation process (Eichenlaub-Ritter and Peschke, 2002) and ATP production through oxidative phosphorylation (Osellame et al., 2012). In addition, transcriptional activity of CPT2 gene is taking part in fatty acid metabolism and elevated expression of CPT2 throughout maturation verified the significance of FAO for the progression of meiosis (Sanchez-Lazo et al., 2014). Indeed, our results revealed higher expression of CPT2 in both buffalo and bovine immature oocytes than the matured oocytes (Figure 2). In support of our study, a research demonstrated that bovine oocyte that failed to develop to an embryo was linked with reduced mtDNA copy number and mRNAs (May-Panloup et al., 2005). Down regulation of genes regulating mitochondrial function was detected in low-quality oocytes (Hsieh et al., 2004). While competent good quality oocytes have a high copy of mtDNA that is required during early embryo development (El-Shourbagy et al., 2006). The expression of CPT2 gene was greater in buffalo oocytes cultured under low compared to high oxygen tension and linked with increased mitochondrial activity. Ghanem et al. (2021). The increased expression of CPT2 before oocyte maturation could be due to enhanced uptake of FA from the cytoplasm to mitochondria oocytes to be utilized in beta-oxidation to produce enough energy required for this process (Paczkowski et al., 2013).
Moreover, the data of the present study indicated no changes in the expression of TFAM gene neither in bovine nor in buffalo oocytes during in vitro maturation (Figure 3). A study has suggested that TFAM is determining gene mtDNA replication in oocytes however, TFAM was reduced during oocyte maturation (Spikings et al., 2007). Indeed, the up regulation of TFAM in mitochondria decreases the production of ROS (Zhao et al., 2021). Deadenylation of mRNAs plays an important role in translational silencing and is a rate-limiting process in regulation of gene expression (Chen and Shyu, 2011). Therefore, the unchanged expression of TFAM before and after the maturation of oocytes, suggests that the TFAM transcripts could be deadenylated and preserved till its de novo polyadenylation is necessary throughout the initial stages of the embryo cleavage (Němcová et al., 2019).
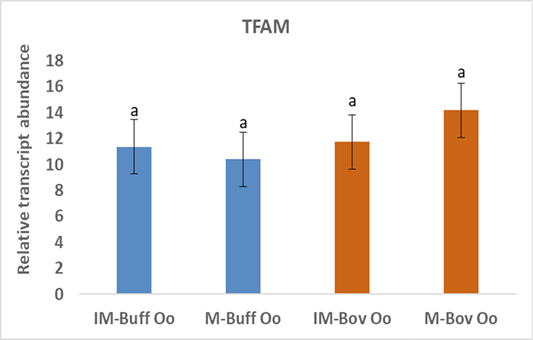
Figure 3: Relative gene of TFAM in bovine and buffalo oocytes during in vitro maturation. Values with different superscripts (a, b, c, d) are significantly different at p≤0.05.
CONCLUSIONS AND RECOMMENDATIONS
The variation of CPT2 gene expression during in vitro maturation of bovine oocytes in reflecting their maturation competence than that of buffalo. Increased metabolic activity of oocytes during IVM is in line with CPT2 expression that is involved in lipid oxidation required for this process. Moreover, TFAM showed neither higher nor lower expression in both bovine and buffalo oocytes throughout the maturation process which may be due to deadenylation during the maturation process.
Novelty Statement
Our results indicated the mitochondrial activity and transcript abundance of marker genes during in vitro maturation of oocytes both in bovine and buffalo species. Result clearly demonstrated that’s the patterns of the gene expression of CPT2 vary during in vitro maturation of bovine oocytes reflecting their maturation competence than that of buffalo. This indicated that increased metabolic activity of oocytes during IVM is in line with CPT2 expression that is involved in lipid oxidation required for this process.
AUTHOR’S CONTRIBUTION
All authors have contributed equally in designing and conducting of the manuscript and revised it before submission.
Conflict of interest
The authors have declared no conflict of interest.
REFERENCES


