Advances in Animal and Veterinary Sciences
Research Article

Predicting Body Weight Based on Body Measurements at Different Ages and Sex in Saburai Goat
Akhmad Dakhlan*, Arif Qisthon, Muhammad Dima Iqbal Hamdani
Department of Animal Husbandry, Faculty of Agriculture, Universitas Lampung, Jl. Prof. Sumantri Brojonegoro No.1 Gedung Meneng Bandar Lampung, Lampung, Indonesia 35145.
Abstract | This study aimed to predict live body weight (BW) of Saburai goat based on body measurements (body length = BL, shoulder height = SH, chest girth = CG) in Saburai goats at different ages and sex. A total of six hundred fifty-four data generated from 214 Saburai goats (108 female goats and 96 male goats) aged 0-12 months were used in this study. We used analysis of correlation and regression model between body measurements and BW using R program. Determination coefficient (R2), root mean square error (RMSE), Akaike Information Criterion (AIC) and Bayesian Information Criterion (BIC) were used as a reference in finding the best model in addition to using stepwise regression to find a simpler and more efficient model. The result showed that BL, SH and CG positively correlated to BW with the highest correlation value generally was CG followed by BL and SH. Combination of BL and CG was the best predictor for BW and showed the more parsimonious regression model for predicting BW at all ages and sex. Age and sex of goat affected the regression model suggesting that different sex and age had own regression model to predict BW of Saburai goat.
Keywords | Body measurements, Body weight, Correlation, Regression model analysis, Saburai goat
Received | June 09, 2021; Accepted | August 04, 2021; Published | September 25, 2021
*Correspondence | Akhmad Dakhlan, Department of Animal Husbandry, Faculty of Agriculture, Universitas Lampung, Jl. Prof. Sumantri Brojonegoro No.1 Gedung Meneng Bandar Lampung, Lampung, Indonesia 35145; Email: akhmad.dakhlan@fp.unila.ac.id
Citation | Dakhlan A, Qisthon A, Hamdani MDI (2021). Predicting body weight based on body measurements at different ages and sex in Saburai goat. Adv. Anim. Vet. Sci. 9(11): 1791-1799.
DOI | http://dx.doi.org/10.17582/journal.aavs/2021/9.11.1791.1799
ISSN (Online) | 2307-8316; ISSN (Print) | 2309-3331
Copyright © 2021 Dakhlan et al. This is an open access article distributed under the Creative Commons Attribution License, which permits unrestricted use, distribution, and reproduction in any medium, provided the original work is properly cited.
INTRODUCTION
Saburai goat is a new composite breed goat and a superior goat in Lampung Province and was established by the Ministry of Agriculture of the Republic of Indonesia in 2015 as a Lampung local goat (Kementan, 2015). The Saburai goat is a small ruminant livestock as a result of grading-up between females Ettawa Grade (EG) goat (Ettawa x Kacang goat) and male Boer goats with genetic composition of 25% EG goats and 75% Boer goats. Saburai goat is much more preferred by the village communities because of its rapid growth exceeding other local goats in Indonesia such as Kacang goat, Rambon goat or EG goat, although their body weight is lower than Boer goats. In 2018 Saburai goat population reached to 3,293 heads (Sulastri et al., 2019).
The average adult body weights of male and female Saburai goats were 37.27 ± 7.38 kg and 33.81 ± 6.12 kg, respectively, with body length of 58.10 ± 14.94 cm and 51.34 ± 10, respectively, shoulder height of 61.79 ± 8.95 cm and 55.67 ± 6.81 cm, respectively, and chest girth of 63.78 ± 8.06 cm and 55.95 ± 9.05 cm, respectively (Kementan, 2015). According to Sulastri et al. (2014), the average of birth weight, weaning weight and yearling weight of mixed male and female Saburai goats were 3.02 ± 0.66 kg, 19.67 ± 1.54 kg, and 42.27 ± 2,12 kg, respectively.
In general, Saburai goats were raised by farmers for breeding and as savings that can be cashed at any time needed for the needs of their daily life. When they sell their goat, the price was based on prediction of goat body weight visually by the middleman (buyer). This prediction is not accurate because the prediction is subjective and this is detrimental to farmers. To overcome this problem, we should find a method in predicting body weight which is practical in the field conditions where facilities are limited in rural area, one of them is by using body measurements as predictors for live body weight without weighing livestock first (Trisnawanto et al., 2012; Musa et al., 2012; Paputungan et al., 2013). In addition, knowledge about livestock body weight is important for maintenance management, for example, to determine the amount of feed and drug dosage to be given, and for selection purposes.
Several studies have shown that body measurements of goat can be used to estimate their body weight (Khan et al., 2006; Tekle, 2014; Natsir et al., 2010; Basbeth et al., 2015; Hazza et al., 2017; Berhe, 2017; Abd-Allah et al., 2019; Dakhlan et al., 2020, 2021; Waheed et al., 2020). If we see the cross section of the goats, the body resembles a geometric shape in the form of a tube. According to Isroli (2001), the volume of the tube itself is actually body weight. The width of the base on the tube is the circumference of the chest while the height is the length of the body. This combination of chest girth and body length results in a tube volume which is called as body weight. That is why in many studies chest girth and body length were the best predictor for live body weight (Topal and Macit, 2004; Afolayan et al., 2006; Chitra et al., 2012; Shirzeyli et al., 2013; Iqbal et al., 2013; Waheed et al., 2020; Dakhlan et al., 2020, 2021).
Studies on using body measurements to predict live body weight of goat have been done in many regions of the world. In previous studies, the relationship between body weight and body measurements of goats was based on a certain age and on a certain gender. There has not been much research on how age and gender influence the regression model. The present study was aimed to analyse the correlation and regression model between live body weight and some body measurements (body length, shoulder height, chest girth) of Saburai goat at different ages and sex, and to find the fittest regression model in estimating body weight based on body measurements.
MATERIALS AND METHODS
The data used in this study were 654 kids aged 0-12 months generated from 108 Saburai does and 96 Saburai bucks recorded from 2010-2016. For the purposes of analysis, the data were divided into 3 age groups, namely 0, 3-6 and 9-12 months of age.
Live body weight was taken using scales. Body length (BL) was measured as the distance from the anterior edge of shoulder to the posterior edge of ischium using a meter tape; shoulder height (SH) is the distance from the ground surface where the goat is trampling to the highest part of the shoulder using a measuring stick with the goat in an upright position; chest girth (CG) was measured as the circumference of the chest just behind forelegs using meter tape. Data tabulation was done with the Excel program. Descriptive analysis was performed using mean, standard deviation (SD), minimum, maximum and coefficient of variation (CV%) of the data.
Correlation and regression model analysis between body measurements (body length, shoulder height and chest girth) and live body weight were performed using R program (R Core Team, 2020; Dakhlan, 2019). Linear and multiple linear regression model used were as follows:
Y = a + b1*BL + b2*SH + b3*CG ....(7)
Where Y is live body weight (kg), BL is body length (cm), SH is shoulder height (cm), CG is chest girth (cm), a is intercept or regression constant, b1, b2, and b3 are regression coefficient of BL, SH and CG, respectively.
Shapiro-Wilk normality test and QQ-Plot were used to check normality of residual of each regression model. Pearson’s correlation coefficient was used to evaluate the relationship between body weight and body measurements. Determination coefficient (R2), RMSE (root mean square error), AIC (Akaike Information Criterion) and BIC (Bayesian Information Criterion) were used as a reference in the search for the best model in addition to using stepwise regression to find a simpler and more efficient model (simplicity of models). The higher R2 and the smaller RMSE, AIC and BIC of a model is the better. Student t-test was used to investigate the effect of sex and age on predicted of two regression models compared. ANOVA test was also performed to evaluate the effect of sex and age on the slope of two regression models compared (Dakhlan, 2019; Astuti, 2007) by comparing the two regression models with and without interaction with sex or age. In addition, visualization of the two regression models can be used to determine whether the two regression models were different or not. To evaluate multicollinearity among predictor variables (body measurements) we calculated the VIF (Variance Inflation Factor). If the VIF > 10 means that there were multicollinearity of predictor variables in the data set.
RESULTS AND DISCUSSION
Description of body weight and body measurements of Saburai goat
Data on body weight and body measurements of Saburai goats at different groups of age and sex are presented in Table 1. Normality test revealed that all data used in this study were normally distributed. In general, body weight and body measurements of male Saburai goat were higher (P<0.05) than those of female goat. In the early age (at birth) the body weight and body measurements for both males and females were observed to be almost similar, but with age advancement males performed higher (more weight, longer body length, higher shoulder height, and bigger chest girth) than their counterpart females. The results showed that overall means along with standard deviation for body weight at 0, 3-6, and 9-12 month of ages were 3.41 ± 0.49, 17.29 ± 4.79, and 31.77 ± 7.58 kg, respectively for females and 3.30 ± 0.33, 23.25 ± 6.61, and 35.93 ± 7.16 kg, respectively for males. The body length of female in the three age groups was recorded to be 31.18 ± 2.49, 46.62 ± 5.21, 59.48 ± 7.26 cm, respectively, while that of the male in these age groups were found to be 34.21 ± 3.17, 50.53 ± 6.93, 63.51 ± 5.99 cm, respectively. The average of shoulder height in female in three age groups was noted to be 31.81 ± 2.69, 49.29 ± 5.31, 60.63 ± 6.97 cm, respectively, while that of the male in these age groups were recorded to be 33.71 ± 2.15, 46.66 ± 6.31, 60.81 ± 5.49 cm, respectively. The mean chest girth in the female of three age groups was found to be 35.03 ± 3.65, 54.53 ± 6.87, 68.30 ± 7.95 cm, respectively, while that of the male in the same age groups were investigated to be 34.33 ± 2.13, 60.97 ± 7.57, 76.08 ± 5.72 cm, respectively.
The birth weights of current study (3.40 ± 0.50 kg for females and 3.30 ± 0.34 kg for males of Saburai goats) were higher than those of other local goats such as Boerawa goats (50% Boer goat; 50% EG goat), EG goats, Boerka goats (50% Boer goat; 50% Kacang goat) and Kacang goats with birth weights of 2.91 kg, 2.36 kg, 2.43 kg and 1.87 kg, respectively (Harris et al., 2009). In comparison to birth weight of female Saburai goat from previous study by Adhianto et al. (2017) (3.3 ± 0.4 kg) and Adhianto et al. (2019) (3.1 ± 0.3 kg), this current study was relatively the same. The similarity result with previous study with the same breed of goat may be because of the same regency with relatively the same environment.
Weaning weights (3 months of age) of Saburai goats (not presented here) in this study (14.75 ± 2.89 kg for females and 18.57 ± 4.12 kg for males) were higher than those of other local goats such as Boerawa goats and EG goats with weaning weights of 14.28 ± 0.71 kg and 12.93 ± 0.56 kg, respectively (Sulastri and Dakhlan, 2006). However, this current results were relatively the same as Dakhlan et al. (2009) results who reported that weaning weights of Boerawa goats and EG goats that were traditionally reared were 18.40 kg and 16.81 kg, respectively, whereas for rational rearing with the addition of concentrates were 22.95 kg and 18.06 kg, respectively. This result confirmed with the result reported by Adhianto et al. (2017, 2019) in female Saburai goat in Gisting and Sumberrejo district, Tanggamus regency, which were 16.10 ± 3.40 kg and 14.90 ± 3.70 kg, respectively.
Table 1: Statistics of body weight (kg) and body measurements (cm) of Saburai goats aged 0, 3-6, and 9-12 months.
| Age | Sex | Parameters | BW | BL | SH | CG |
| 0 month (at birth) | Female (n = 108) | Average | 3.41 | 31.18 | 31.81 | 35.03 |
| SD | 0.49 | 2.49 | 2.69 | 3.65 | ||
| Maximum | 4.4 | 38 | 38 | 48 | ||
| Minimum | 2.4 | 25 | 27 | 24 | ||
| CV% | 14.38 | 7.99 | 8.47 | 10.43 | ||
|
Male (n = 96)
|
Average | 3.3 | 34.21 | 33.71 | 34.33 | |
| SD | 0.33 | 3.17 | 2.15 | 2.13 | ||
| Maximum | 4.5 | 41 | 38 | 42 | ||
| Minimum | 2.8 | 24 | 28 | 28 | ||
| CV% | 9.95 | 9.28 | 6.37 | 6.21 | ||
| 3-6 months | Female (n = 138) | Average | 17.29 | 46.62 | 49.29 | 54.53 |
| SD | 4.79 | 5.21 | 5.31 | 6.87 | ||
| Maximum | 30 | 58 | 58 | 69 | ||
| Minimum | 10 | 36 | 38 | 40 | ||
| CV% | 27.69 | 11.17 | 10.77 | 12.61 | ||
|
Male (n = 157)
|
Average | 23.25 | 50.53 | 46.66 | 60.97 | |
| SD | 6.61 | 6.93 | 6.31 | 7.57 | ||
| Maximum | 39 | 67 | 61 | 77 | ||
| Minimum | 9.5 | 37 | 35 | 39 | ||
| CV% | 28.43 | 13.71 | 13.53 | 12.42 | ||
| 9-12 months | Female (n = 102) | Average | 31.77 | 59.48 | 60.63 | 68.3 |
| SD | 7.58 | 7.26 | 6.97 | 7.95 | ||
| Maximum | 55 | 77 | 77 | 86 | ||
| Minimum | 21 | 47 | 49 | 51 | ||
| CV% | 25.85 | 12.2 | 11.49 | 11.64 | ||
|
Male (n = 119)
|
Average | 35.93 | 63.51 | 60.81 | 76.08 | |
| SD | 7.16 | 5.99 | 5.49 | 5.72 | ||
| Maximum | 60 | 76 | 75 | 93 | ||
| Minimum | 24 | 49 | 54 | 66 | ||
| CV% | 19.93 | 9.43 | 9.03 | 7.51 |
Note: BW: body weight; BL: Body length; SH: Shoulder height; CG: Chest girth; SD: standard deviation; CV: Coefficient of variation.
The current study finding (at 3-6 and 9-12 month of age) are in partially agreement with those of Thiruvenkadan (2005), with body weight were higher in the present study. Khan et al. (2006) reported similar result with current study, those were 14.50-18.60 (kg) live body weight, 58.70-59.60 (cm) body length, 56.50-60.30 (cm) height at withers and 57.60-59.10 (cm) hearth girth, in Beetal goats at 4-12 month of age. Whereas Raja et al. (2013) reported mean body weight of 10.14 ± 0.28 and 9.82 ± 0.26 (kg); body length of 46.38 ± 0.43 and 46.46 ± 0.41 (cm); withers height of 51.05 ± 0.46 and 50.62 ± 0.43 (cm) and heart girth of 49.99 ± 0.44 and 49.47 ± 0.42 (cm), respectively for male and female of Beetal goats at 3-6 month, which are not in agreement with the findings of the present study. These differences may be because of different breed and environmental and rearing management.
Correlation and regression model between body weights and body measurements of Saburai goats
Correlation coefficient between body weight and body measurements of female and male Saburai goats at different sex and age are presented in Table 2. Results of this study showed that body length (BL), shoulder height (SH) and chest girth (CG) positively correlated to body weight (BW) with the highest correlation value generally was CG followed by BL and SH. Furthermore, correlation among predictor variables were under 0.90 meaning that different predictor variables have no similar predictive relationship with the BW. In addition, multicollinearity test showed that among predictor variables (body measurements) had VIF (variance inflation factors) value lower than five indicating that multiple regression model can be applied as predictor variables for BW in this study (Dakhlan, 2019).
The present study showed that the correlation coefficient between body weight and body measurements increased with increasing ages. The results of current study confirmed with the result reported by Khan et al. (2006) that generally correlation coefficient between body weight and body measurements increased with increasing ages. However, current result differed from those reported by Basbeth et al. (2015) which the correlation coefficient between body weight and body measurements decreased with the increasing ages. This different finding might be caused by the different breed and environment of the goats.
The results of this study differed from those by Khan et al. (2006) and Abd-Allah et al. (2019). Khan et al. (2006) reported that the height at withers or shoulder height of goats aged 4-12 months had the highest correlation (r=0.75) with body weight followed by heart girth or chest girth (r=0.62) and body length (r=0.49) in the Livestock Research and Development Station Surezai, Peshawar, Pakistan. Furthermore, Abd-Allah et al. (2019) reported that body length had the highest correlation (r=0.95) with body weight in female Shami goats in subtropical areas in Egypt, while in male goats the highest correlated body measurements to body weight was heart girth (r=0.98). The current study corroborate the findings of a study by Adeyinka and Mohammed (2006), Raja et al. (2013), Berhe (2017) and Waheed et al. (2020) that chest girth had the highest correlation with body weight in Nigerian Red Sokoto Goats, in Attappady Black goats in Kerala, India, in Maefur goat in Tigray, Northern Ethiopia, and in Beetal goats in Punjab, Pakistan, respectively. Abd-Allah et al. (2019) reported that chest girth had the highest correlation (r=0.98) with body weight in male Shami goats in subtropical areas in Egypt, while in female goats the highest correlated body measurements to body weight was heart girth (r=0.95). While Iqbal et al. (2013) reported body length correlated with body weight higher compared to height at withers, heart girth, rump and forehead with correlation coefficient of 0.805, 0.766, 0.767, 0.088 and 0.229, respectively.
Table 2: Phenotypic correlations between live body measurement traits.
| BW | BL | SH | CG | |
| Female 0 month (at birth) | ||||
| BW | 1.00 | |||
| BL | 0.72 | 1.00 | ||
| SH | 0.34 | 0.43 | 1.00 | |
| CG | 0.62 | 0.77 | 0.56 | 1.00 |
| Female 3-6 month | ||||
| BW | 1.00 | |||
| BL | 0.73 | 1.00 | ||
| SH | 0.54 | 0.78 | 1.00 | |
| CG | 0.82 | 0.71 | 0.71 | 1.00 |
| Female 9-12 month | ||||
| BW | 1.00 | |||
| BL | 0.82 | 1.00 | ||
| SH | 0.72 | 0.84 | 1.00 | |
| CG | 0.90 | 0.76 | 0.71 | 1.00 |
| Male 0 month (at birth) | ||||
| BW | 1.00 | |||
| BL | 0.48 | 1.00 | ||
| SH | 0.50 | 0.36 | 1.00 | |
| CG | 0.66 | 0.45 | 0.62 | 1.00 |
| Male 3-6 month | ||||
| BW | 1.00 | |||
| BL | 0.67 | 1.00 | ||
| SH | 0.47 | 0.80 | 1.00 | |
| CG | 0.89 | 0.65 | 0.48 | 1.00 |
| Male 9-12 month | ||||
| BW | 1.00 | |||
| BL | 0.83 | 1.00 | ||
| SH | 0.67 | 0.47 | 1.00 | |
| CG | 0.95 | 0.84 | 0.60 | 1.00 |
Note: BW: body weight; BL: Body length; SH: Shoulder height; CG: Chest girth.
Regression models (Equations 1-7), along with their criteria of model selection, between body weight and body measurements of female and male Saburai goats at different age are presented in Tables 3 and 4.
Based on R2, RMSE, AIC and BIC criteria, the best regression model for predicting body weight of female Saburai goats at 0, 3-6 and 9-12 months (Table 3) was using combination of BL and CG, combination of BL, SH and CG, and combination of BL and CG predictors, respectively. On the other hand for male (Table 4), combination of BL and CG was the best predictor for BW at 0 month of age, while combination of BL, SH and CG was the best predictors for predicting BW both at 3-6 and 9-12 month of age. In all the best regression model, CG was the highest regression coefficient indicating that CG determine the highest variation for BW, except in female Saburai goat at age 0 month which BL (0.12) was higher in regression coefficient than CG (0.02). Among the criteria, AIC and BIC confirmed with the result of stepwise regression analysis method with the highest R2 except in regression model for female at 9-12 month of age in which equation 5 and 7 had the same R2 (0.85) with the regression coefficient of SH in Equation 7 was not significant (0.53) so that the best equation noted to be Equation 5. Two regression models for male goats at birth (0 month) showed similar R2 (0.47 in equation 5 and 0.48 in Equation 7), but the best regression model was Equation 5 because in Equation 7 regression coefficient of SH was not significant (0.23). However, two regression models for male at 3-6 month of age had the same R2 (0.81) for Equations 5 and 7 but the best regression model was Equation 7 with all coefficient of regression were significant (0.00 for BL, 0.05 for SH and 0.00 for CG).
Table 3: Regression models of body weight on body measurements of female Saburai goats aged 0, 3-6 and 9-12 months along with criteria of model selection.
| Regression model | Intercept (a) | Coefficient of regression (slope) | RMSE | r | R2 | AIC | BIC | ||
| b1(BL) | b2(SH) | b3(CG) | |||||||
| Goats aged 0 month (at birth) | |||||||||
| BW=a+b1BL | -0.99 | 0.14(0.00) | - | - | 0.34 | 0.72** | 0.52 | 74.2 | 82.04 |
| BW=a+b2SH | 1.44 | - | 0.06(0.00) | - | 0.46 | 0.34** | 0.12 | 134.93 | 142.78 |
| BW=a+b3CG | 0.5 | - | - | 0.08(0.00) | 0.38 | 0.62** | 0.38 | 98.54 | 106.38 |
| BW=a+b1BL+b2SH | -1.1 | 0.13(0.00) | 0.01(0.65) | - | 0.34 | 0.62** | 0.52 | 75.99 | 86.45 |
| BW=a+b1BL+b3CG | -0.99 | 0.12(0.00) | - | 0.02(0.12) | 0.33 | 0.70** | 0.53 | 73.71 | 84.17 |
| BW=a+b2SH+b3CG | 0.53 | - | 0.002(0.92) | 0.08(0.00) | 0.38 | 0.55** | 0.38 | 100.53 | 110.99 |
| BW=a+b1BL+b2SH+b3CG | -0.95 | 0.12(0.00) | 0.003(0.87) | 0.02(0.14) | 0.33 | 0.65** | 0.33 | 75.68 | 88.76 |
| Goats aged 3-6 months | |||||||||
| BW=a+b1BL | -14.06 | 0.67(0.00) | - | - | 3.25 | 0.73** | 0.54 | 723.25 | 732.03 |
| BW=a+b2SH | -6.69 | - | 0.49(0.00) | - | 4.02 | 0.54** | 0.29 | 781.48 | 790.26 |
| BW=a+b3CG | -13.77 | - | - | 0.57(0.00) | 2.75 | 0.82** | 0.67 | 676.44 | 685.22 |
| BW=a+b1BL+b2SH | -13.26 | 0.72(0.00) | -0.06(0.45) | - | 3.25 | 0.67** | 0.54 | 724.65 | 736.36 |
| BW=a+b1BL+b3CG | -18.56 | 0.28(0.00) | - | 0.42(0.00) | 2.55 | 0.84** | 0.71 | 658.2 | 669.9 |
| BW=a+b2SH+b3CG | -12.22 | - | -0.08(0.21) | 0.61(0.00) | 2.73 | 0.75** | 0.67 | 676.79 | 688.5 |
| BW=a+b1BL+b2SH+b3CG | -15.39 | 0.46(0.00) | -0.33(0.00) | 0.50(0.00) | 2.34 | 0.78** | 0.76 | 636.39 | 651.02 |
| Goats aged 9-12 months | |||||||||
| BW=a+b1BL | -18.94 | 0.85(0.00) | - | - | 4.35 | 0.82** | 0.67 | 416.09 | 422.88 |
| BW=a+b2SH | -15.47 | - | 0.78(0.00) | - | 5.25 | 0.72** | 0.51 | 442.94 | 449.73 |
| BW=a+b3CG | -25.55 | - | - | 0.85(0.00) | 3.34 | 0.90** | 0.8 | 378.65 | 385.44 |
| BW=a+b1BL+b2SH | -20.24 | 0.77(0.00) | 0.10(0.46) | - | 4.33 | 0.80** | 0.67 | 417.52 | 426.57 |
| BW=a+b1BL+b3CG | -30.49 | 0.33(0.00) | - | 0.62(0.00) | 2.96 | 0.91** | 0.85 | 363.63 | 372.68 |
| BW=a+b2SH+b3CG | -29.72 | - | 0.17(0.03) | 0.75(0.00) | 3.23 | 0.88** | 0.82 | 375.87 | 384.92 |
| BW=a+b1BL+b2SH+b3CG | -29.88 | 0.37(0.00) | -0.06(0.53) | 0.63(0.00) | 2.95 | 0.88** | 0.85 | 365.21 | 376.52 |
Note: number in parenthesis indicated the significance of the regression coefficient (b1, b2 and b3); r: Pearson’s correlation coefficient; R2: coefficient of determination; RMSE: root mean square error; AIC: Akaike information criterion; BIC: Bayesian information criterion; BW: body weight; BL: Body length; SH: Shoulder height; CG: Chest girth. **significant at P<0.01; bold typed indicated the best regression model.
Table 4: Regression models of body weight on body measurements of male Saburai goats aged 0, 3-6 and 9-12 months along with criteria of model selection.
| Regression model | Intercept (a) | Coefficient of regression (slope) | MSE | r | R2 | AIC | BIC | ||
| b1(BL) | b2(SH) | b3(CG) | |||||||
| Goats aged 0 month | |||||||||
| BW=a+b1BL | 1.62 | 0.05(0.00) | 0.29 | 0.48** | 0.23 | 36.89 | 44.39 | ||
| BW=a+b2SH | 0.73 | - | 0.08(0.00) | 0.28 | 0.50** | 0.25 | 34.21 | 41.71 | |
| BW=a+b3CG | -0.18 | - | - | 0.10(0.00) | 0.25 | 0.66** | 0.43 | 9 | 16.5 |
| BW=a+b1BL+b2SH | 0.14 | 0.04(0.00) | 0.06(0.00) | - | 0.26 | 0.59** | 0.35 | 23.01 | 33.01 |
| BW=a+b1BL+b3CG | -0.44 | 0.02(0.01) | - | 0.09(0.00) | 0.24 | 0.64** | 0.47 | 4.41 | 14.41 |
| BW=a+b2SH+b3CG | -0.45 | - | 0.02(0.15) | 0.09(0.00) | 0.24 | 0.65** | 0.45 | 8.88 | 18.88 |
| BW=a+b1BL+b2SH+b3CG | -0.65 | 0.02(0.02) | 0.02(0.23) | 0.07(0.00) | 0.24 | 0.67** | 0.48 | 4.87 | 17.37 |
| Goats aged 3-6 months | |||||||||
| BW=a+b1BL | -9.27 | 0.64(0.00) | - | - | 4.86 | 0.67** | 0.46 | 948.22 | 957.39 |
| BW=a+b2SH | 0.33 | - | 0.49(0.00) | - | 5.82 | 0.47** | 0.22 | 1004.5 | 1013.67 |
| BW=a+b3CG | -24.03 | - | - | 0.78(0.00) | 3.03 | 0.89* | 0.79 | 799.41 | 808.58 |
| BW=a+b1BL+b2SH | -7.31 | 0.79(0.00) | -0.20(0.06) | - | 4.81 | 0.61** | 0.47 | 946.47 | 958.7 |
| BW=a+b1BL+b3CG | -26.33 | 0.16(0.00) | - | 0.68(0.00) | 2.91 | 0.87** | 0.81 | 788.71 | 800.93 |
| BW=a+b2SH+b3CG | -25.2 | - | 0.05(0.23) | 0.75(0.00) | 3.01 | 0.81** | 0.79 | 799.95 | 812.18 |
| BW=a+b1BL+b2SH+b3CG | -24.95 | 0.25(0.00) | -0.12(0.05) | 0.67(0.00) | 2.87 | 0.79** | 0.81 | 786.63 | 801.91 |
| Goats aged 9-12 months | |||||||||
| BW=a+b1BL | -26.98 | 0.99(0.00) | - | - | 3.99 | 0.83** | 0.69 | 476.74 | 484.03 |
| BW=a+b2SH | -17.03 | - | 0.87(0.00) | - | 5.3 | 0.67** | 0.45 | 524.54 | 531.84 |
| BW=a+b3CG | -54.35 | - | - | 1.19(0.00) | 2.29 | 0.95** | 0.9 | 383.32 | 390.62 |
| BW=a+b1BL+b2SH | -42.71 | 0.79(0.00) | 0.47(0.00) | - | 3.28 | 0.88** | 0.79 | 446.2 | 455.92 |
| BW=a+b1BL+b3CG | -53.89 | 0.12(0.12) | - | 1.08(0.00) | 2.25 | 0.92** | 0.9 | 382.84 | 392.56 |
| BW=a+b2SH+b3CG | -57.79 | - | 0.20(0.00) | 1.07(0.00) | 2.11 | 0.91** | 0.91 | 371.65 | 381.37 |
| BW=a+b1BL+b2SH+b3CG | -57.4 | 0.15(0.04) | 0.21(0.00) | 0.93(0.00) | 2.05 | 0.94** | 0.92 | 369.32 | 381.47 |
Note: number in parenthesis indicated the significance of the regression coefficient (b1, b2 and b3); r: Pearson’s correlation coefficient; R2: coefficient of determination; RMSE: root mean square error; AIC: Akaike information criterion; BIC: Bayesian information criterion; BW: body weight; BL: Body length; SH: Shoulder height; CG: Chest girth. **significant at P<0.01; bold typed indicated the best regression model.
Even though all body measurements included in the current study could provide together a better prediction of Saburai goat BW because of the higher R2, combination of BL and CG showed the more parsimonious regression model with BW and remain high value of correlation. Furthermore, if we wanted to use single body measurement, CG is the best predictor to BW compared to BL and SH. It was recorded that the highest and strongly positive (P< 0.01) correlation of single body measurement to BW was CG both for the female and male Saburai goats compared to BL or to SH.
The result of this study was in accordance with the result reported by Raja et al. (2013), Chitra et al. (2012), Adeyinka and Mohammed (2006), Berhe (2017), Habib et al. (2019), Abd-Allah et al. (2019) and Dakhlan et al. (2020, 2021), that CG was the best predictor to BW of goat. In addition, CG is the easiest way to measure for live body weight prediction in the field conditions.
Effect of sex and age on regression model using single body measurements of Saburai goats
Result of t-test between predicted body weight of two regression models with different group of age showed that different age affected on the regression model. This means that different group of age has own regression model. Furthermore, ANOVA test result indicated that different group of age has different slope of regression line (regression coefficient). We can see from Figure 1 that the regression line of different age group are not parallel for each predictor indicating that the three different ages had different slope and different predicted body weight using the three body measurements. In other words, estimating body weight based on each of body measurement may use different regression models for female Saburai goat at different group of age. The same situation happened in male Saburai goats (Figure 2) where different age group had own regression model.
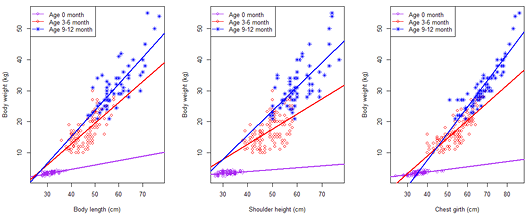
Figure 1: Scatter plot and regression line between body weight and body measurements of Female Saburai goats at three different age group.
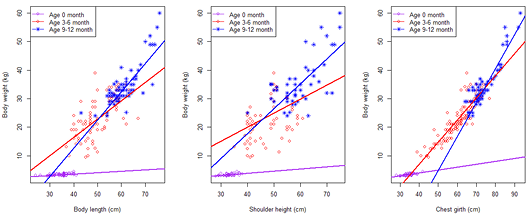
Figure 2: Scatter plot and regression line between body weight and body measurements of male Saburai goats at three different age group.
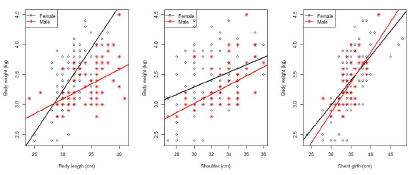
Figure 3: Scatter plot and regression line between body weight and body measurements of female and male Saburai goats at age 0 month (at birth).
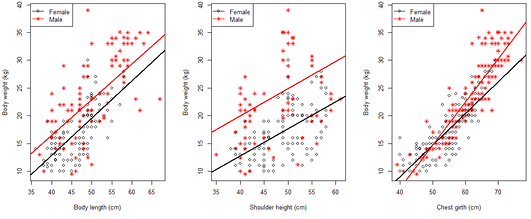
Figure 4: Scatter plot and regression line between body weight and body measurements of female and male Saburai goats at age 3-6 month.
Figures 3, 4 and 5 show the scatter plot and regression line between body weight and body measurements at three different age group.
The result of t-test indicated that different sex affected on regression model (P<0.05) for each predictor at 0 month of age. ANOVA test result indicated that only body length had different slope (P<0.05) of the regression model. Based on Figure 3 we can see regression line between female and male were significantly different (not parallel and interact each other) for body length predictor, while for shoulder height and chest girth the two regression line between female and male are almost parallel. Overall, different sex had different regression model.
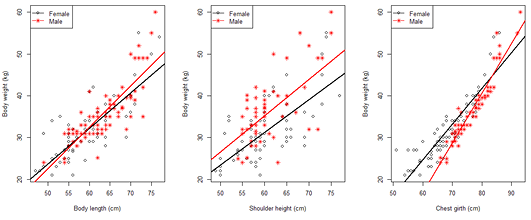
Figure 5: Scatter plot and regression line between body weight and body measurements of female and male Saburai goats at age 9-12 month.
At age 3-6 and 9-12 months only chest girth had different slope of the regression line between female and male Saburai goat, while for body length and shoulder height had parallel slope between female and male. The result of t-test and ANOVA test indicated that different sex at age 3-6 and 9-12 month of age had different regression model.
CONCLUSIONS AND RECOMMENDATIONS
Chest girth had the highest correlation and was the best predictor for body weight of Saburai goat at all ages and sex if using single body measurement. The combined chest girth and body length had a higher, significant correlation and more parsimonious model in predicting body weight of the Saburai goat compared to other combination of body measurements at all ages and sex. Sex and age influenced the regression model of body weight to all body measurements at all ages and sex suggesting that different age or sex should use different regression model. Results of this study suggest as well that chest girth and body length could be used as selection criteria to improve body weight of Saburai goats.
ACKNOWLEDGEMENTS
The authors acknowledge to Dean of Faculty of Agriculture, University of Lampung for funding this research and publication cost. Farmer in Sumberrejo district Tanggamus regency Lampung province deserve great thanks for providing data for this study.
Novelty Statement
Research on the effect of sex and age on the regression model and the regression line (slope) between body measurements and body weights, especially in goats has never been done. Especially in Saburai goats, this is a preliminary study. We found that body weight prediction should use different regression models for different age and sex groups.
AUTHOR’S CONTRIBUTION
AD arranged and designed the research, analyzed data, and wrote the manuscript. AQ critically reviewed the manuscript. MDIH collected and tabulated the data and studied the literture.
Conflict of interest
The authors have declared no conflict of interest.
REFERENCES


