Advances in Animal and Veterinary Sciences
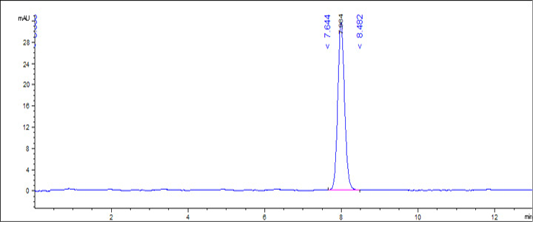
Chromatogram of glyphosate standard at a conc. of 0.2 ppm.
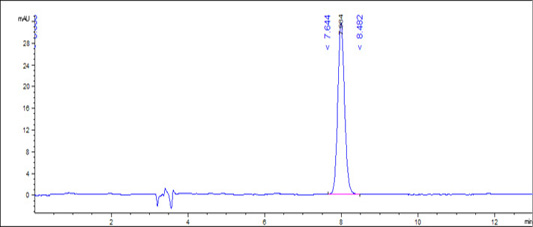
Chromatogram of glyphosate in blank fish muscle at a conc. of 0.2 ppm.
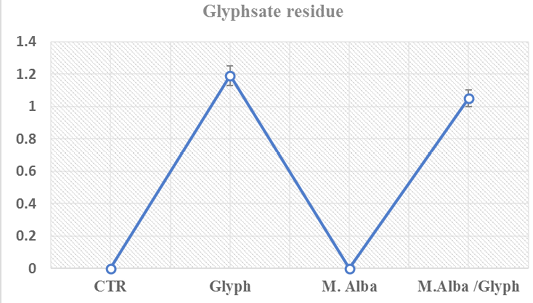
Glyphosate concentrations in fish muscle (µg/kg) showed no significant changes among intoxicated group with glyph and treated intoxicated group (glyph/M. albus) at twenty-one day in cat fish
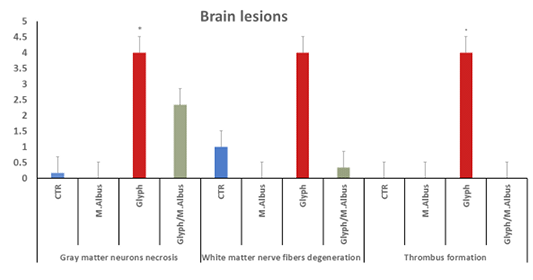
Showing that the brain of intoxicated fish with glyphosate have enhanced gray matter neurons necrosis, white matter nerve fiber degeneration and thrombus formation, while these lesions were dissppeared from CTR and other treated group and improved in treated group with (Glyh+M.albus). Data expressed as Mean ± SE, analyzed using one-way ANOVA at P≤0.05, column with (*) indicate significant difference among the values of different groups. (C=Control, G=glyph, M=M. albus, T=(Glyph/M. albus).
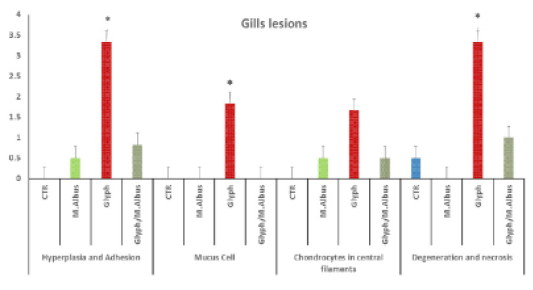
Showing that the gills of fish intoxicated with glyphosate have enhanced hyperplesia and adhesion of gill filaments, mucus cell, chondrocytes proliferation in centeral filaments and degeneration and necrosis of gill filaments, while these lesions were dissppeared from CTR and other treated group and improved in treated group with (Glyh+M. albus). Data expressed as Mean ± SE, analyzed using one-way ANOVA at P≤0.05, column with (*) indicate significant difference among the values of different groups. (C=Control, G=glyph, M=M. albus, T=(Glyph/M. albus).
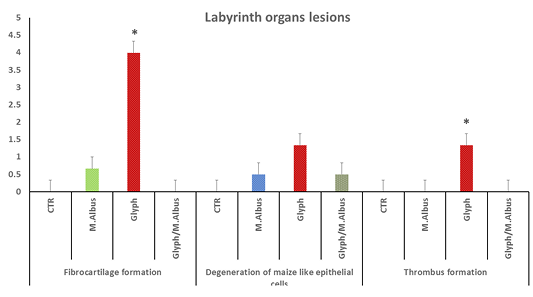
Showing that labryinth organ of fish intoxicated with glyphosate have enhanced fibrocartilage formation, degeneration of Maize like epithelial cell and thrombus formation, while these lesions were dissppeared from CTR and other treated group and improved in treated group with (Glyh+M. albus). Data expressed as Mean ± SE, analyzed using one-way ANOVA at P≤0.05, column with (*) indicate significant difference among the values of different groups. (C=Control, G=glyph, M=M.albus, T=(Glyph/M.albus).
Showed that the kidney of fish intoxicated with glyphosate have degeneratin ,necrosis sloughing of epithelial renal tubuli, glomerular atrophy, blood dialation and flolding, blood caplliary thickness, thrombus in blood capillary, complete necrosis of tissue and intersititial fibrosi, while theses lesions were dissppeared from CTR and other treated group and improved in treated group with (Glyh+M.albus). Data expressed as Mean ± SE, analyzed using one-way ANOVA at P≤0.05, column with (*) indicate significant difference among the values of different groups. (C=Control, G=glyph, M=M. albus, T=(Glyph/M. albus)
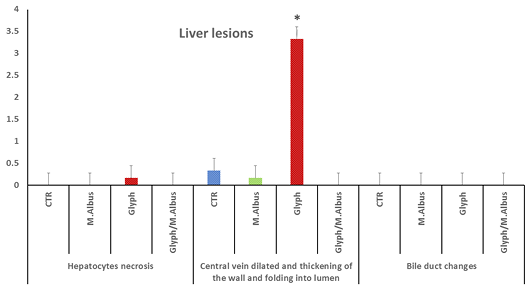
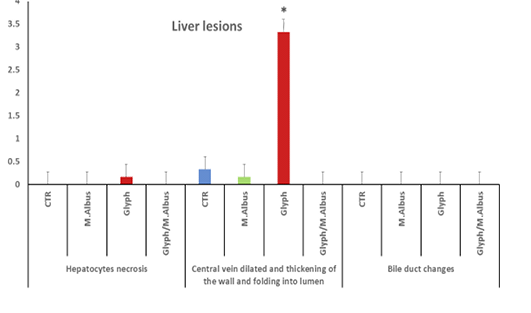
Showing that liver of fish intoxicated with glyphosate have hepatocytes necrosis, central vein dialtation and thickening of the wall and folding in lumen and no changes in bile duct were recorded, while these lesions were dissppeared from CTR and other treated group and improved in treated group with (Glyh+M. albus). Data expressed as Mean ± SE, analyzed using one-way ANOVA at P≤0.05, column with (*) indicate significant difference among the values of different groups. (C=Control, G=glyph, M=M. albus, T= (Glyph/M. albus).
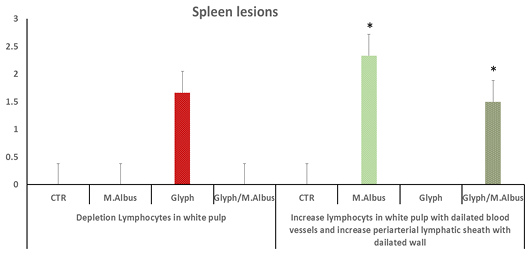
C showing that the spleen of fish intoxicated with glyphosate have enhanced depletion of lymphocytes in white pulb, but the increase lymphocytes in white pulp with dilated blood vessels and increase in periarterial lymphatic sheath were recorded in mullberry group,and treated group. Data expressed as Mean ± SE, analyzed using one-way ANOVA at P≤0.05, column with (*) indicate significant difference among the values of different groups. (C=Control, G=glyph, M=M. albus, T=(Glyph/M. albus).
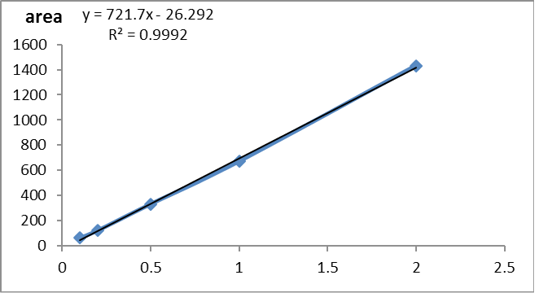
Standard curve of glyphosate conc. versus peak area.
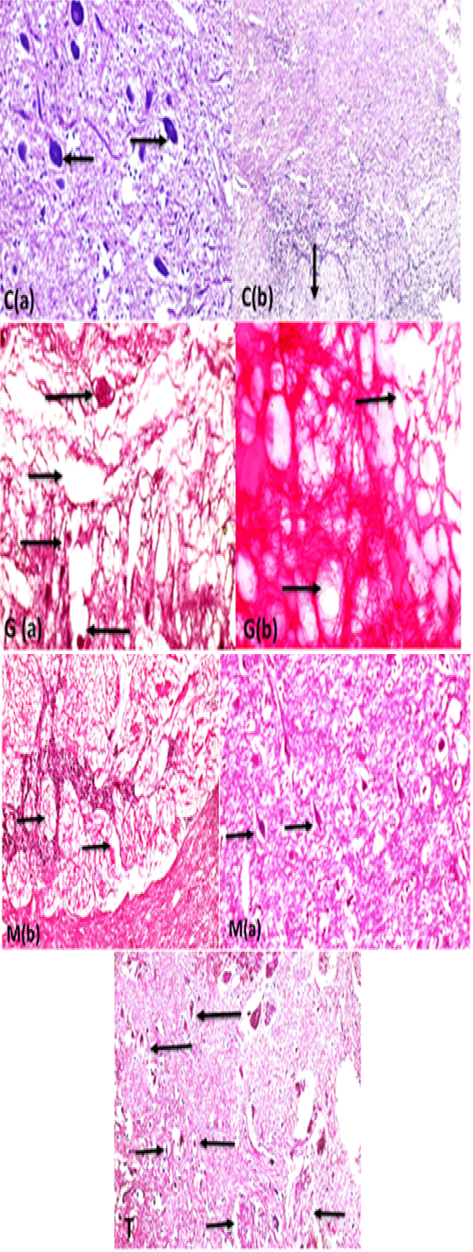
C (a):Brain fish (gray matter) control showing normal neurons with basophilic cytoplasm and central nuclei (arrows) with intact brain parenchyma (H and EX400) and C(b): the white matter nerve fibers showing intact nerve fibers in brain medulla (arrow) (H and EX200.G (a): brain (gray matter fish intoxicated with glyphosate) showing severe acidophilic necrosis of neurons retracted shrinkage of the nuclei and cells (long arrows) with cavitations of brain moth eaten appearance (short thin arrow) and thrombosis of blood capillary (short thick arrow) (StainH and EX400) G(b): white matter of brain fish showing severe degeneration of white matter nerve fibers (spongiosis) ( long arrows) (Stain H and EX200). M ( a ) brain showing highly intact healthy brain gray matter parenchyma and healthy basophilic neurons (arrows) (H and EX400) M(b) showing marked healthy nerve fibers neurons in white matter (arrows) H and EX200).T: Brain gray and white matter in protected group showing neurons retain to normal structure (long arrows) in compare with glyphosate group neurons, but still some neurons suffering from necrosis (small retracted pyknotic nuclei )(short thin arrows), marked improvement of brain parenchma with no spongiosis , with marked regeneration of nerve fibers neurons (short thick arrows) (H and EX200).
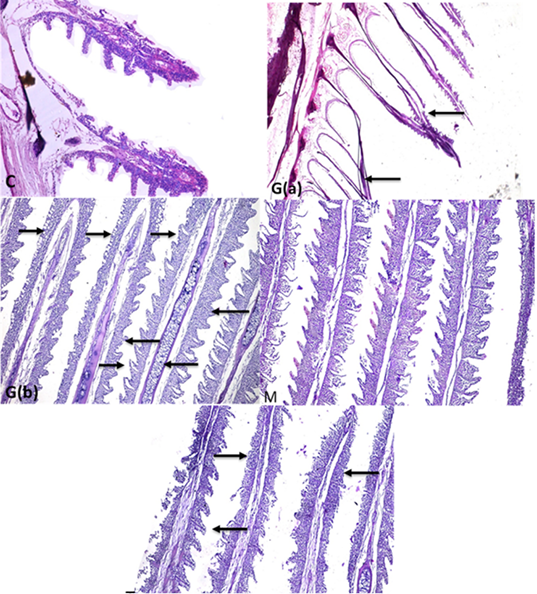
C: Fish gills showing gills with normal primary and secondary gill filament with normal cellular structure and central blood supply of gill filaments (H and EX100) G (a):Gills fish showing necrosis and degeneration of all epithelial cells covering gill filaments (gill filaments appeared bar from all cells) (arrows)(H and EX4) G(b): some parts of gills showing inter lamellar hyperplasia ,inflammatory infiltration of mononuclear cells ( long thick arrows) in gill filaments with mucus cells proliferation (long thin arrows) and chondrocytes proliferation in the center of gill filaments (short thin arrow) with lamellar fusion of gill secondary filaments in the upper part (thick short arrow) (StainH and EX100) M gills: showing highly intact healthy gill filaments with normal secondary non fused gill filament with central blood supply (H and EX100) T: gills showing improved gill filaments structure (long arrow) with still presence of gill necrosis (short arrows) (H and EX100).
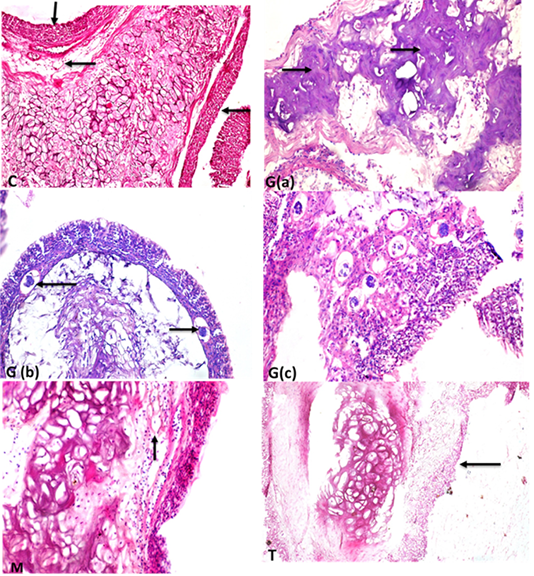
C: labyrinth organ showing central elastic cartilage in the center with normal maize like structure epithelium tissues in the periphery (short arrow) and normal blood capillaries (long arrow) (StainH and EX200). G(a) labyrinth organ of fish showing conversion of elastic cartilage into fibrocartilage (arrows) (H and EX400). G(b) labyrinth organ with thrombosis (arrows) of blood capillaries (H and EX200) (StainH and EX100 ). G(c) high power of previous picture showing thrombosis of blood capillaries (H and Ex400). M :elastic cartilage normal with maize like epithelium structure in the periphery and healthy blood supply (arrow)(H and EX400)T: showing intact elastic cartilage with few some degenerative changes and degeneration of epithelial cell in maize like structure in the periphery(long arrow) (H and EX200).
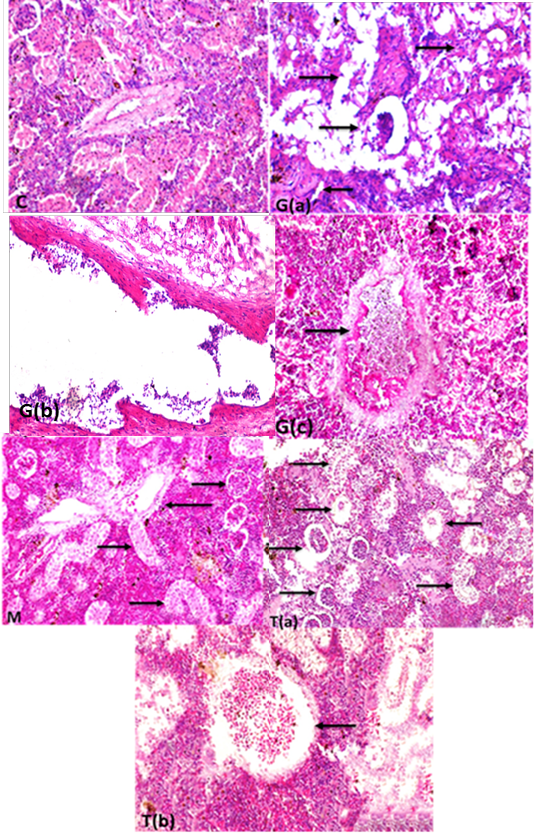
(c) kidney showing glomeruli with normal kidney tubular epithelium and normal circumscribed wall thickness of blood vessel(H and EX400).G (a): Kidney fish intoxicated with glyphosate showing atrophied renal glomeruli (long thin arrow) degeneration and necrosis of renal tubular epithelium (short arrows) and interstitial fibrosis (thick long arrow),(H and EX400) G(b) blood vessels in kidneys showing folding of all wall tunics into the lumen with severe thickening in the wall of blood vessels folding into lumen (H and EX400) ,G(c) kidneys showing thrombosis in the lumen of renal blood vessel attached to the wall with accumulated RBCs and leukocytes (H and EX400) M: Kidney fish showing healthy glomeruli (long thick arrow) , and highly improved renal tubular epithelium (long thin arrows) with normal blood vessels wall (short thick arrow) (H and EX200) T(a):kidneys fish showing high intact renal glomeruli (long thick arrow), and normal renal tubular epithelium of renal tubuli (long thin arrow) but still present of degree of degenerative changes of some renal tubules (short thick arrow)(H and Ex200) T(b): renal blood vessels with normal circumscribed vessels wall with normal thickness and normal blood content (arrow)(H and EX400) H and E semi quantitative scoring of hepatic lesions.
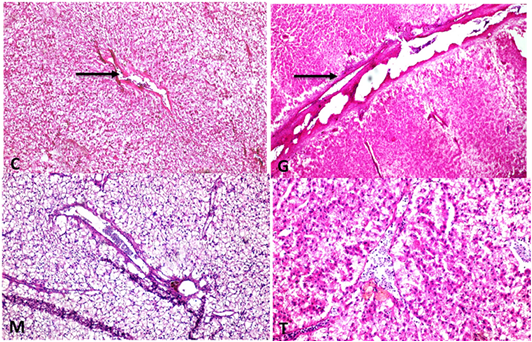
C: Liver showing normal thickeness portal vein wall (H and EX100)G: liver showing portal vein wall thickening, hyalinization with folding into lumen (H and EX100) M: liver with normal thickness portal vein wall ( H and EX200) T: Liver with normal thin thickness portal vein wall (H and EX200).
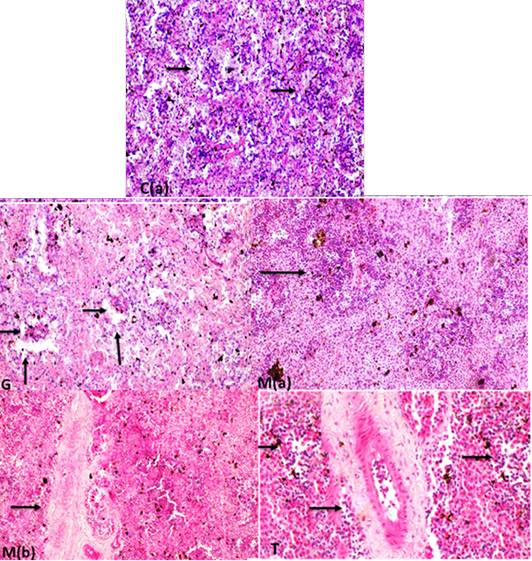
C(a): spleen white pulp impacted with lymphocytes (arrows)(H and EX200). C(b): Spleen fish showing normal diameter central arteriole (H and EX400) G: spleen fish revealing depletion of lymphocytes in white pulp ( long arrows) with normal diameter central arteriole (short arrows) (H and EX200) M(a): increase lymphocytes in white pulp (arrow)(H and EX400) M(b ):high increase in periarterial lymphatic sheath (arrow) (H and Ex200). T: increase lymphocytes in white pulp with dilated blood vessels and increase periarterial lymphatic sheath.


