Advances in Animal and Veterinary Sciences
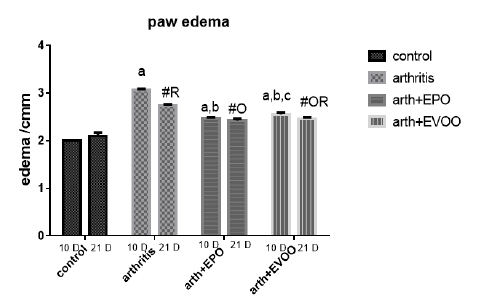
Edema diameter in arthritis, EPO and EVOO treated rats.
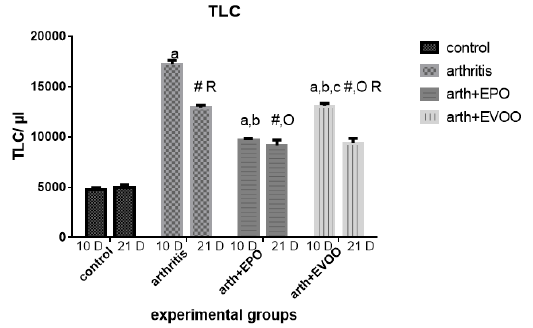
Total leucocytic count in arthritis, EPO and EVOO treated rats.
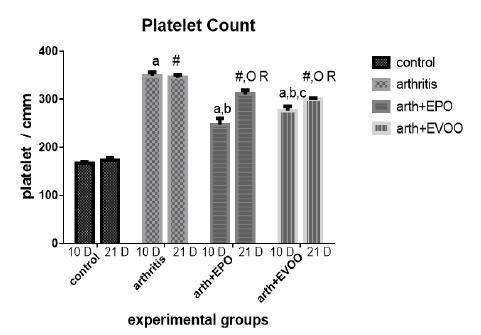
Platelets count in arthritis, EPO and EVOO treated rats.
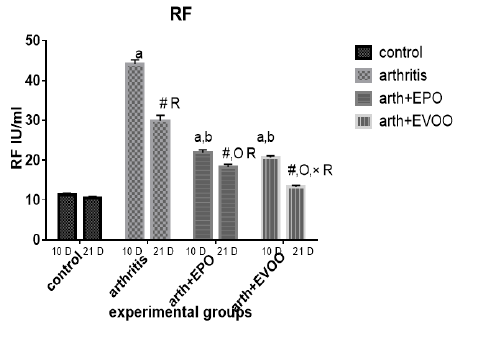
Serum RF levels in arthritis, EPO and EVOO treated rats.
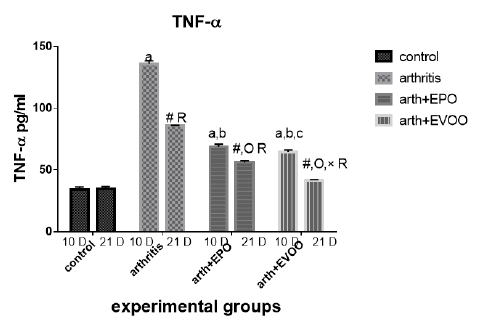
Serum TNF-α levels in arthritis, EPO and EVOO treated rats.
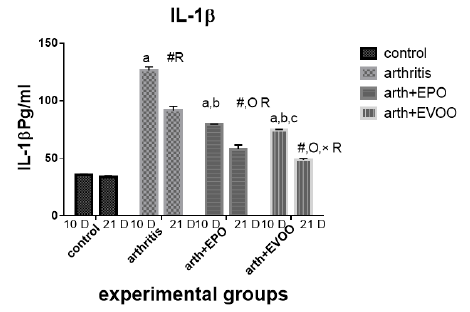
Serum IL-1β levels in arthritis, EPO and EVOO treated rats.
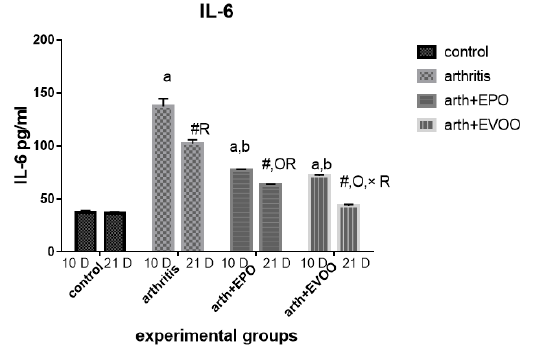
Serum IL-6 levels in arthritis, EPO and EVOO treated rats.
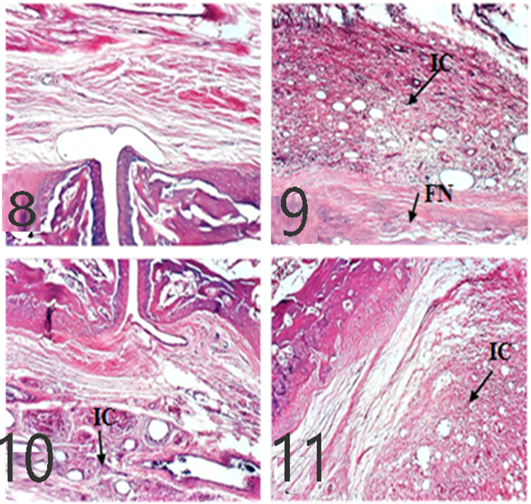
Ankles of rats 10 dpi by (H and E x 100). A: No histopathological changes in the control (normal) group; B: inflammatory cells (IC) infiltration and focal necrosis (FN) of articular cartilage in arthritis group; C: Few inflammatory cell infiltrations in the EPO-treated group; D: Few inflammatory cell infiltrations in EVOO-treated group.
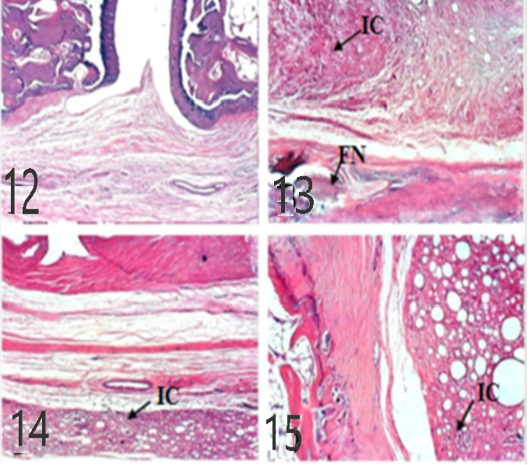
Ankles of rat 21 dpi showing: by (H and E x 100). A: No histopathological changes in the control (normal) group; B: inflammatory cells (IC) infiltration and focal necrosis (FN) of articular cartilage in arthritis group; C: Few inflammatory cell infiltrations (H and E) in the EPO-treated group; D: Few inflammatory cell infiltrations (H and E) in EVOO-treated group.
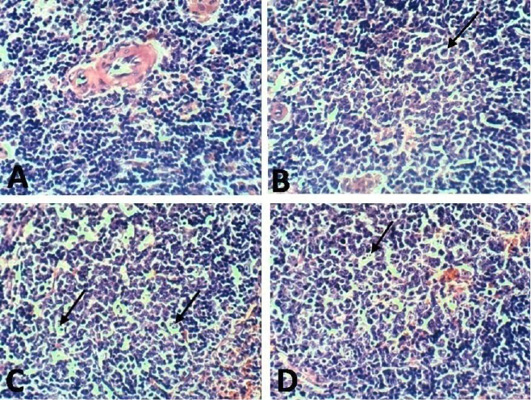
Spleen of rat 10 dpi showing by (H and E x 100). A: No histopathological changes in the control (normal) group; B: lymphoblasts proliferation and mitotic figure in arthritis group; C: inflammatory cells infiltration in EPO treated group; D: inflammatory cells infiltration in EVOO treated group.
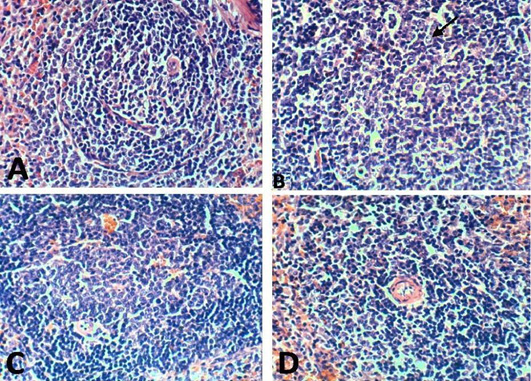
Spleen of rat 21 dpi by (H and E x 100) showing. A: No histopathological changes in the control (normal) group; B: lymphoblasts proliferation and mitotic figure in arthritis group; C: No histopathological changes in the EPO-treated group; D: No histopathological changes in the EVOO-treated group.


