Advances in Animal and Veterinary Sciences
Research Article

Functional Glycomics and Anxiety-related Behaviors in Single Versus Group-Housed C57BL/6 and DBA/2 Male Mice.
Ahmed F. Abou-Elnaga1, Gaber E. Batiha2, Christian T. Potter3, Ibrahim F. Rehan4*
1Department of Husbandry and Development of Animal Wealth, Faculty of Veterinary Medicine, Mansoura University, Egypt; 2Department of Pharmacology and Therapeutics, Faculty of Veterinary Medicine, Damanhour University, Damanhour, Al Beheira, Egypt; 3Department of neuroscience, center for neuroscience at the University of Pittsburgh, Pennsylvania, United States of America; 4Department of Husbandry and Development of Animal Wealth, Faculty of Veterinary Medicine, Menofia University, Shebin Alkom, Menofia, Egypt.
Abstract | Anxiety-related behaviors are indices reflecting the welfare conditions of animals. Correlating anxiety levels of C57BL/6 and DBA/2 in different tests to glycomic responses as a realistic biochemical markers in mice remains unclear. Sixty-four mice, 12 weeks old, were housed either singly or in groups of four (n= 32 each) and tested for anxiety-related behavior after 7 weeks of different housing and their anxiety levels were correlated to their functional glycomic responses in the context of different housing conditions. DBA/2 mice demonstrated less grooming, lower incidence of rearing, higher defecation, and a higher latency to begin rearing and grooming in an induced grooming test. They also displayed more anxiety-related behaviors in DL exploration than the C57BL/6 mice did. The serum N-glycans were examined using glycoblotting along with matrix-assisted laser desportionionization-time of flight/mass spectrometry (MALDI-TOF/MS) to follow the molecular correlates of anxiety in mice behaviors in-vivo. Sialylated N-glycan was significantly increased in the DBA/2, and correlated with the mice’s behavioral data, confirming that there were more anxiety-like responses than the C57BL/6 mice. To our knowledge, sialylated N-glycan is a novel biomarker of anxiety. This approach has the potential to improve neurobehavioural research on anxiety.
Keywords | Anxiety, N-glycan, MALDI-TOF/MS, Welfare, Mice
Received | March 27, 2021; Accepted | May 29, 2021; Published | August 15, 2021
*Correspondence | Ibrahim F. Rehan, Department of Husbandry and Development of Animal Wealth, Faculty of Veterinary Medicine, Menofia University, Shebin Alkom, Menofia, Egypt; Email: ibrahim.rehan@vet.menofia.edu.eg
Citation | Elnaga AFA, Batiha GE, Potter CT, Rehan IF (2021). Functional glycomics and anxiety-related behaviors in single versus group-housed C57BL/6 and DBA/2 male mice. Adv. Anim. Vet. Sci. 9(10): 1532-1546.
DOI | http://dx.doi.org/10.17582/journal.aavs/2021/9.10.1532.1546
ISSN (Online) | 2307-8316; ISSN (Print) | 2309-3331
Copyright © 2021 Elnaga et al. This is an open access article distributed under the Creative Commons Attribution License, which permits unrestricted use, distribution, and reproduction in any medium, provided the original work is properly cited.
INTRODUCTION
Numerous behavioral differences have been reported between C57BL/6 and DBA/2 for memory, anxiety, pain responses, and sensitivity thresholds to psychological medications (Filiou et al., 2021). Grooming is an indicator of different internal and external states of the animal and can reflect anxiety (Kalueff et al., 2016; Jirkof et al., 2019).
In the induced grooming test, latency, frequency of bouts, duration, rearing behavior, and defecation are the main indices to assess anxiety-related behavior (Kalueff et al., 2016). Dark light (DL) exploration is another common etiological model of anxiety-related behavior that is designed for mice (Eltokhi et al., 2020).
In our study, we used both tests to confirm the level of anxiety between both C57BL/6 and DBA/2 strains in the different housing conditions.
Moreover, we analyzed the mouse’s sera, which contained both Neu5Ac and Neu5Gc-sial-terminal(s) due to the effect of CMP-Neu5AcHydroxylase enzyme, that converts Neu5Ac to Neu5Gc (Mahmoud et al., 2019; Rehan et al., 2020). These sialylated Neu5Ac/Neu5Gc-terminal(s) N-glycans were differently expressed in stress conditions (Mahmoud et al., 2019; Rehan et al., 2020). However, Neu5Gc-terminal(s) also maintains the anxiety-adapted responses in BALB/c mice strain (Gebrehiwot et al., 2018; Mahmoud et al., 2019; Rehan et al., 2020). Additionally, lectin-binding sia-α-2-6Gal/GalNAc was elevated in mice under chronic stress and in depressed patients, whereas ST6GalNAc2 expression was diminished in blood sampling taken from depressed patients (Yamagata et al., 2018).
Thus, we hypothesize that the expression levels of these two sialic acid terminal N-glycan determined using glycoblotting combined with matrix-assisted laser desportion ionization-time of flight/mass spectrometry (MALDI-TOF/MS) (Miura et al., 2008; Hirose et al., 2011; Sanes et al., 2018; Mahmoud et al., 2019; Rehan et al., 2020) can be used as a key to estimating anxiety in-vivo. In the present study, we investigate the effect of single housing on anxiety-related behavior (induced grooming test, DL exploration test) correlating to their functional glycomic profiles in two different strains.
MATERIALS AND METHODS
All experimental procedures were conducted following the Menofia University legislation and guidelines. In addition, all animal experiments reported here were approved by the Ethical Committee of Menofia University, Egypt (Protocol dated 032021).
General Animal Housing
Sixty-four male mice, (C57BL/6J and DBA/2, n =32 each), 12 weeks old, 28 ± 2.1 grams upon arrival were used in this experiment. They were obtained from Theodor Bilharz Research Institute, Giza, Egypt. All mice were maintained under controlled temperature conditions (22±2 ºC), humidity (60%), lighting regime (a 12:12 h light/dark cycle), and had access to water and pelleted food ad-libitum (mice chow®, Oil and Soap Manufacturing Company, El-Gharbia, Egypt). The bedding was changed weekly, and nesting material (wood shavings) was used as enrichment for all mice.
Experimental Treatments
At arrival, according to (Võikar et al., 2005) mice from the two strains were assigned randomly to one of the following experimental treatments for 7 consecutive weeks:
Spray Test (Induced-Grooming Test)
For induction of artificial grooming, mice were transported to the dimly lit room and left undisturbed for 3 hrs before the testing, the mice were individually placed in a clean plastic observation box (30 cm x 30 cm x 30 cm), misted with a spray bottle filled with water (25ºC), were placed in front of the spray nozzle 20-30 cm away, and lightly sprayed from above eight times to the dorsal surface of mice by the mist. The box of observations was thoroughly cleaned with ethanol 70% after each subject finishes the test. In all experiments, each mouse has a 5 minutes recording with a digital video camera (Hikvision, Binjiang District, Hangzhou, China). During the recording time, the experimenter stands 2 m away and in front of the observation box.
To evaluate grooming activity, three behavioral measures were assessed in every test as follows: 1) latency to start grooming (s), 2) frequency (bout), and 3) duration spent grooming (s). Also, three non-grooming measures had been evaluated; 1) vertical rears (total duration for animal stand vertical on its hind legs and his forelegs are in the air or against box wall), 2) the latency to initiate vertical rear (s), and 3) defecation. The number of deposited boli was scored as an index of their emotion (Kalueff et al., 2004).
Dark Light (DL) Exploration Test
Mice were tested in a Plexiglass box (45 cm length x 20 cm width x 20 cm height) that had two compartments. Two-thirds of the box was illuminated by 500 Lux, while the other 1/3 was entirely darkened by black paint. Both compartments were separated by a door (10 cm x 5 cm). At the beginning of the test, animals were placed on the dark side for 1 minute. After this first minute, the door was opened and the mice had the chance to walk free in between both compartments for 5 minutes. Latency to enter the illuminated side, time spent in both compartments, and frequency to enter the light compartment were calculated by an experienced experimenter (Eltokhi et al., 2020).
The order of the tests (and intervals between them) was: induced grooming, then 2 days of rest, then DL. The order of testing was chosen to conduct the less invasive tests first (Võikar et al., 2004). All behavioral tests were performed during the dark period of the circadian cycle.
Importantly, the serum N-glycan levels of mice were analyzed immediately after performing the behavioral tests to confirm the in vivo status of the experimented mice.
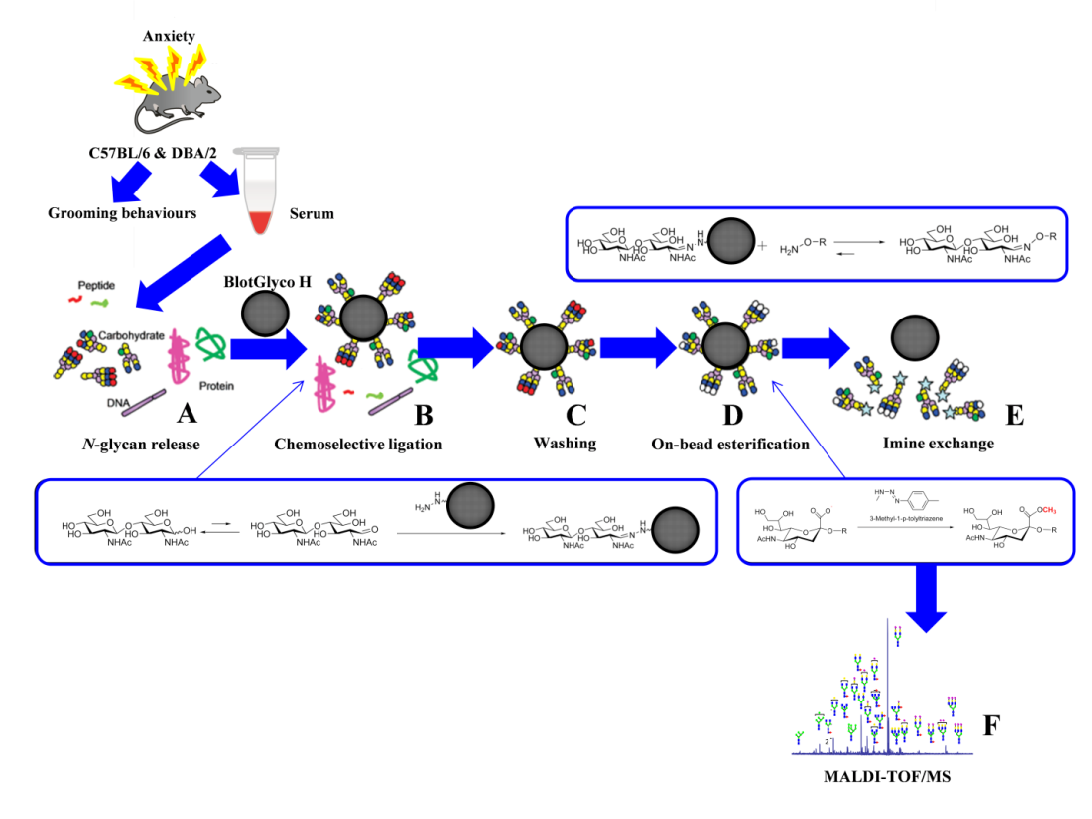
Figure 1: Glycoblotting followed by MALDI-TOF/MS analysis of mice sera: (A) N-glycan release; (B) chemoselective ligation of whole serum N-glycans by “BlotGlyco” beads; (C) washing; (D) on-bead esterifications of sialyl-terminal(s); and (E) trans-iminization by benzyloxiamine to generate BOA-tagged N-glycans; and (F) MALDI-TOF/MS analysis. The figure was drawn, in its original form,by the authors of this manuscript.
Glycoblotting-Based Serum Glycomics
The experimental mice were decapitated for euthanasia, and 0.5-1.0 ml of the blood was carefully collected. Further, we kept the clotted blood at 4 ºC for 16 hr and proper centrifugation was performed at 5000 g for up to10 minutes. Finally, mice sera were transferred into new tubes to keep them at -80 ºC until they were analyzed. Ten microliters of mice sera (n=32/group) were prepared for the release of N-glycans. The N-glycan mixture underwent the glycoblotting process for the quantification before the MALDI-TOF/MS analysis. The human N-glycan sera protocol, with simple modifications, was used in this study, as reported previously (Gizaw et al., 2015; Gizaw et al., 2016; Gebrehiwot et al., 2018; Mahmoud et al., 2019; Rehan et al., 2020). Afterward, a PNGase F. BlotGlyco®H bead was used to capture N-glycan carefully by the glycoblotting method. The methyl-esterification of the sialic acid terminal(s) was also performed. Then, to tag N-glycan with benzyloxyamine (BOA), a trans-imination reaction was done. The mixture of N-glycans tagged with BOA was subjected to MALDI-TOF/MS analysis (as shown in Figure 1 A-F). Importantly, the GlycoMod Tool predicted the possible N-glycan compositions of the experimental masses, which were mainly reported on GlycoSuiteDB, (http://web.expassy.org/glycomod/), and non-reported compositions were later checked using the consortium for functional glycomics (CFG), (http://www.functionalglycomics.org), to identify and categorize the genetic diversity in N-glycan structures in mouse serum. N-glycan profiling was primarily done on sources from the sera of Ratus ratus, especially sources from mouse serum, cells, and tissues. Moreover, the intensity of the isotopic peak of each glycan was normalized using 40 μM of the internal standard (disialyloctasaccharide) for each status, and their concentrations were calculated from a calibration curve using human serum standards) Gizaw et al., 2015; Gizaw et al., 2016; Gebrehiwot et al., 2018; Mahmoud et al., 2019; Rehan et al., 2020). The observed ions of experimental m/z values which were performed using MALDI-TOF/MS were relatively higher than the Expasy MW values because N-glycans were labeled

Figure 2: Average latency of first vertical rear, average duration of vertical activity, and number of fecal boli deposited by the mice of the two inbred stain of experimental treatments. Data represented as mean ± SEM.”***” showed a significance level, P ≤ 0.001,”**” a significance level, P ≤ 0.01,”*” a significance level, P ≤ 0.05). B6GH: GH-C57BL/6J; D2GH: GH-DBA/2; B6SH: SH-C57BL/6J; D2SH: SH-DBA/2; S: second.
with BOA for trans-imination (105 m/z), formation of Na-adduct (23 m/z) by laser condition during shooting for performingTwo-way ANOVA of SPSS version 20 was performed using strain (C57BL/6J and DBA/2) and housing (group- and single-housed) as the independent variables for detecting the respective effects. Post hoc comparisons were carried out using the Bonferroni test. The N-glycan concentration (µM) for each molecular mass (m/z) was fixed as the dependent variable followed by Bonferroni-Post Hoc tests to compare each strain to its housing type. The significant difference was considered when P ≤ 0.05. Also, the Pearson coefficient correlation test for the duration of grooming and Spearman’s rho correlation test for grooming bouts had been applied to estimate the correlation between N-glycans and different behaviors. In which (r) = 0.7 was considered a strong correlation, (r) = 0.5-0.7 a moderate to strong correlation, and (r) = 0.3-0.5 a weak to moderate correlation.
MS analysis, and the esterification of sialic acid(s) per methyl group (14 m/z). More detailed information of chemicals and N-glycomic steps, written in Supporting Information I, II.
Statistical Analyses
Two-way ANOVA of SPSS version 20 was performed using strain (C57BL/6J and DBA/2) and housing (group- and single-housed) as the independent variables for detecting the respective effects. Post hoc comparisons were carried out using the Bonferroni test. The N-glycan concentration (µM) for each molecular mass (m/z) was fixed as the dependent variable followed by Bonferroni-Post Hoc tests to compare each strain to its housing type. The significant difference was considered when P ≤ 0.05. Also, the Pearson coefficient correlation test for the duration of grooming and Spearman’s rho correlation test for grooming bouts had been applied to estimate the correlation between N-glycans and different behaviors. In which (r) = 0.7 was considered a strong correlation, (r) = 0.5-0.7 a moderate to strong correlation, and (r) = 0.3-0.5 a weak to moderate correlation.
RESULTS AND DISCUSSION
Behavioral Findings
The data demonstrated the strain, housing condition, and strain by housing condition interaction effect to clarify all factors that might cause such changes in mice’s behaviors. We predicted that such behavior would not be changed either due to the genetic background or the special housing condition only, but due to handling a specific strain in a particular housing condition.

Figure 3: Average latency to start grooming, average of total duration of grooming activity, and average number of grooming bouts by the mice of the two inbred strains of experimental treatments. Data represented as mean ± SEM.”***” showed a significance level, P ≤ 0.001,”**” a significance level, P ≤ 0.01,”*” a significance level, P ≤ 0.05 using SPSS program). B6GH: GH-C57BL/6J; D2GH: GH-DBA/2; B6SH: SH-C57BL/6J; D2SH: SH-DBA/2; S: second.
Strain effect: as shown in Figure 2, GH-C57BL/6J mice demonstrated shorter latency to start vertical rearing than those of GH-DBA/2 mice (latency: 6s (C57BL/6J), 16.8s (DBA/2), F(3,60)=10.0508, P=0.003). Moreover, the average number of rears increased in GH-C57BL/6J than in GH-DBA/2 (average number of rears: 41 r (GH-C57BL/6J), 21.1 r (GH-DBA/2), F(3,60)=9.335, P=0.004). A strain effect was also noticed in deposited boli by mice. For instance, DBA/2 mice, in both housing conditions, defecated more than C57BL/6J ones (defecation average: 1.25 d (GH-C57BL/6J), 2.75 d (GH-DBA/2), 2 d (SH-C57BL/6J), 3.75 d (SH-DBA/2), F(3, 60)=10.11, P=0.003). In Figure 3, induced grooming behavior patterns showed a significant strain effect where GH-DBA/2 mice displayed more latency to start grooming compared to GH-C57BL/6J (latency: 5.25 s (C57BL/6J), 15.3 s (DBA/2), F(3, 60)=5.9843, P=0.020). In addition, the total duration of grooming activity was greater in GH-C57BL/6J compared to GH-DBA/2 mice, F(3,60)=15.238, P=0.002. For the number of grooming bouts, C57BL/6J performed more grooming bouts than those DBA/2 mice in both housing conditions, (average of grooming bouts: 40.5 b (GH-C57BL/6J), 14 b (GH-DBA/2), 26.5 b (GH-C57BL/6J), 10.75 b (GH-DBA/2), F(3,60)=176.770, P=0.0001). In Figure 4, C57BL/6J spent more time in the light compartment when compared to DBA/2 mice in both housing conditions, F(3,60)= 7.419, P=0.022. Also, we found that strain had a significant effect on latency to enter the light compartment, where C57BL/6J entered the light side faster than DBA/2 strain in both housing F(3,60)= 9.543, P=0.0013.
Housing condition effect: GH-C57BL/6J mice exhibited more grooming bouts than SH-C57BL/6J (grooming bouts: 40.5 b (GH-C57BL/6J), 26.5 b (SH-C57BL/6J), F(3,60)=29.466, P=0.0003). Furthermore, single housing increased latency to enter a light compartment in DBA/2, F(3,60)= 9.543, P=0.05 in DL box. It indicated that SH-DBA/2 displayed significantly less anxiety than C57BL/6J of both housing and GH-DBA/2 mice, see Figure 4.
Strain*housing condition effect: SH-C57BL/6J exhibited more grooming bouts than GH-DBA/2 mice, while, GH-C57BL/6J exhibited more grooming bouts than SH-DBA/2 (grooming bouts: 40.5 b (GH-C57BL/6J), 26.5 b (SH-C57BL/6J), 14 b (GH-DBA/2), 10.75 b (SH-DBA/2), F(3,60)=11.4438, P=0.002). In addition, we investigated
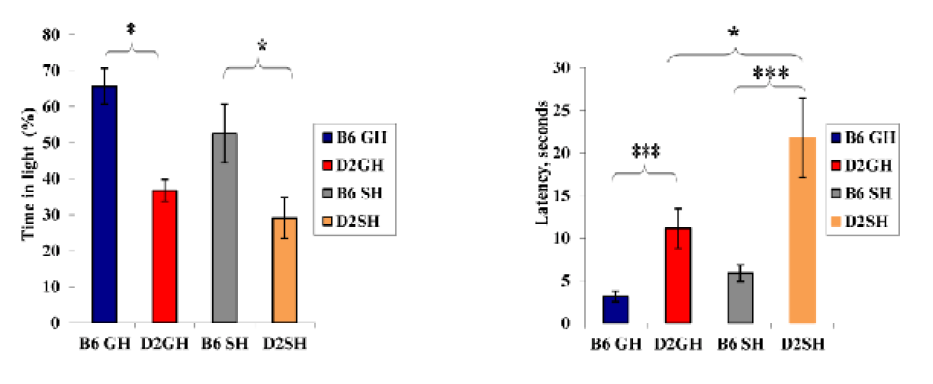
Figure 4: Time (%) in light litcompartment, latency in seconds to enter light compartment in DL box by the mice of the two inbred strains in the two experimental treatments. Data represented as mean ± SEM”***” showed a significance level, P≤ 0.001,”**” a significance level, P ≤ 0.01,”*” a significance level, P ≤ 0.05 using SPSS program). B6GH:GH-C57BL/6J; D2GH:GH-DBA/2; B6SH:SH-C57BL/6J; D2SH:SH-DBA/2; S: second.
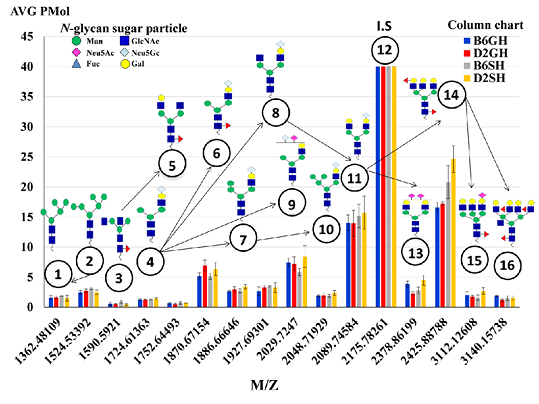
Figure 5: The average expression levels (pmole) of the 15 major N-glycans of the C57BL/6 and DBA/2 mouse serum, identified by the biosynthetic pathway. Peak number 12 at m/z 2175 assigned as an internal standard structured, [(Hex)2 (HexNAc)2 (Neu5Ac)2 + (Man)3 (GlcNAc)1], with 40 μM concentrations. N-glycans sugar particles showed as follow: HexNAc, N-acetylhexosamine (GlcNAc, N-acetylglucoseamine (blue square) or GalNAc, N-acetylgalactoseamine (yellow square) depends on the description); Deoxyhexose, fucose (redtriangle); Hex, hexose (Mannose (green circle), and galactose (yellow circle) depend on the description); and Neu5Ac, 5-N-acetylneuraminic acid (purple diamond), I.S, Internal Standard. B6GH:GH-C57BL/6J; D2GH: GH-DBA/2; B6SH: SH-C57BL/6J; D2SH: SH-DBA/2.
the strain*housing condition effect and showed that GH-DBA/2 mice had more latency to groom when compared to SH-C57BL/6J (latency: 2.8 s (GH-DBA/2), 15.3 s (SH-C57BL/6J), F(3,60)=1.643, P=0.042). We found that SH-C57BL/6J mice groomed more time than GH-DBA/2; whereas GH-C57BL/6J groomed more time than SH-DBA/2, (grooming duration: 157.7 s (SH-C57BL/6J), 122.5 s (GH-DBA/2), 137 s (SH-DBA/2), F(3,60)=4.20057, P=0.049).
Mass spectrometry analyses of N-glycans
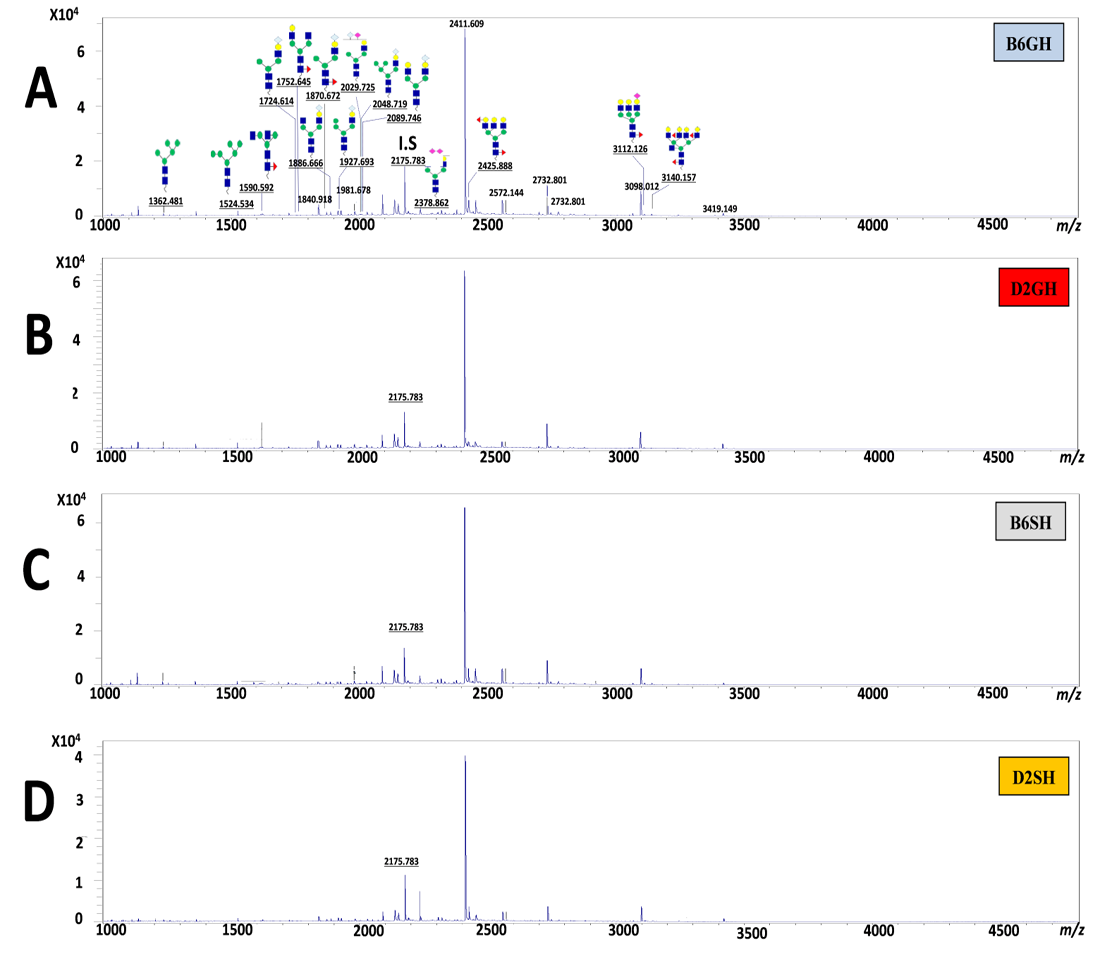
The N-glycomic analysis procedure in C57BL/6 and DBA/2 mice sera was performed using glycoblotting accompanied with MALDI-TOF/MS (Figure 1, steps A~F). The selected 15 N-glycans structures (Table 1) of mice sera were identified in Glycosuit DB and/or the Consortium for Functional Glycomics (CFG). The ratio of N-glycan in mouse (C57BL/6 and DBA/2) serum showed 13% high mannose-, 34% hybrid-, and 53% of complex sialylated N-glycans. Importantly, the two sial-terminals Neu5Ac andNeu5Gc, synthesized in both mice sera, N-glycomics can be assessed by the expression of N-glycan MS spectra peaks in both mice strains that were significantly altered in all experimental groups (Figure 5). Herein, the significances of these peaks were statistically calculated among groups (Table 2).
N-glycan Peaks Analysis
For strain effect, it was obvious that DBA/2 mice, especially single housed ones, were very responsive to the changes in N-glycans when compared to C57BL/6 mice. As a result, shown in Table 2, we noticed changes in most of our estimated peaks indicating that SH-DBA/2 mice showed more significant elevation in peaks 4, 7, 9, 10, 13, 15 when compared to SH-C57BL/6, F(3,60)=1.822, P=0.006, F(3,60)=4.862, P=0.009, F(3,60)=3.432, P=0.016, F(3,60)=5.238,
Table 1: Estimated Structure of 15 Major N-glycans of Serum in C57BL/6 and DBA/2 Mice.
| Peak number | m/z | ExPasy MW | Structure | Type | Source |
|
(a)1 |
1362.48109 | 1234.43347 |
(Hex)2 + (Man)3 (GlcNAc)2 |
High-mannose | UniCarbKB |
|
(a)2 |
1524.53392 | 1396.4863 |
(Hex)3 + (Man)3 (GlcNAc)2 |
High-mannose | UniCarbKB |
|
(a)3 |
1590.5921 | 1462.54448 |
(HexNAc)2 (Deoxyhexose)1 + (Man)3 (GlcNAc)2 |
Complex | UniCarbKB |
|
(b)4 |
1724.61363 | 1582.55036 |
(Hex)1 (HexNAc)1 (Neu5Gc)1 + (Man)3 (GlcNAc)2 |
Hybrid | UniCarbKB |
|
(a)5 |
1752.64493 | 1624.59731 |
(Hex)1 (HexNAc)2 (Deoxyhexose)1 + (Man)3 (GlcNAc)2 |
Complex | UniCarbKB |
|
(c)6 |
1870.67154 | 1728.60827 |
(Hex)1 (HexNAc)1 (Deoxyhexose)1 (Neu5Gc)1 + (Man)3 (GlcNAc)2 |
Hybrid | UniCarbKB |
|
(b)7 |
1886.66646 | 1744.60319 |
(Hex)2 (HexNAc)1 (Neu5Gc)1 + (Man)3 (GlcNAc)2 |
Hybrid | CFG |
|
(a)8 |
1927.69301 | 1785.62974 |
(Hex)1 (HexNAc)2 (Neu5Gc)1 + (Man)3 (GlcNAc)2 |
Complex | CFG |
|
(b)9 |
2029.7247 | 1873.64578 |
(Hex)1 (HexNAc)1 (Neu5Ac)1 (Neu5Gc)1 + (Man)3 (GlcNAc)2 |
Hybrid | CFG |
|
(a)10 |
2048.71929 | 1906.65602 |
(Hex)3 (HexNAc)1 (Neu5Gc)1 + (Man)3 (GlcNAc)2 |
Hybrid | CFG |
|
(a)11 |
2089.74584 | 1947.68257 |
(Hex)2 (HexNAc)2 (Neu5Gc)1 + (Man)3 (GlcNAc)2 |
Complex | UniCarbKB |
| 12 | 2175.78261 | 2019.70369 |
I.S: (Hex)2 (HexNAc)2 (Neu5Ac)2 + (Man)3 (GlcNAc)1 |
||
|
(d)13 |
2378.86199 | 2222.78307 |
(Hex)2 (HexNAc)2 (Neu5Ac)2 + (Man)3 (GlcNAc)2 |
Complex | UniCarbKB |
|
(e)14 |
2425.88788 | 2297.84026 |
(Hex)3 (HexNAc)3 (Deoxyhexose)2 + (Man)3 (GlcNAc)2 |
Complex | UniCarbKB |
|
(c)15 |
3112.12608 | 2970.06281 |
(Hex)5 (HexNAc)4 (Deoxyhexose)1 (Neu5Ac)1 + (Man)3 (GlcNAc)2 |
Complex | UniCarbKB |
|
(e)16 |
3140.15738 | 3012.10976 |
(Hex)4 (HexNAc)5 (Deoxyhexose)3 + (Man)3 (GlcNAc)2 |
Complex | CFG |
(a)N-glycan structure reported in serum, (b) not sourced, (c) reported in human, (d) reported in rat, and (e) not categorized. Peaknumber12 is an internal standard of N-glycan structure. HexNAc, N-acetylhexosamine;GlcNAc, N-acetylglucoseamine or GalNAc, N-acetylgalactoseamine; Deoxyhexose, fucose; Hex, hexose; Man, mannose, and galactose; and Neu5Ac, 5-N-acetylneuraminic acid. CFG, consortium for functional glycomics; and I.S, internal standard.
P=0.006, F(3,60)=38.525, P=0.002, and F(3,60)=6.114, P=0.005, respectively. GH-C57BL/6 mice had shown elevation only in two peaks, peaks 13 and 16, when compared to GH-DBA/2, F(3,60)=38.525, P=0.007), F(3,60)=3.608, P=0.023), respectively. For the housing condition effect, it was very clear to notice that single housing, especially for DBA/2 caused a dramatic elevation in the majority of our N-glycan peaks- peak 4, 7, 10, 13, 14, 15, 16 when compared to group-housed mice of the same strain, F(3,60)=1.822, P=0.009, F(3,60)=4.862, P=0.033, F(3,60)=5.238, P=0.012, F(3,60)=38.525, P=0.002, F(3,60)=6.874, P=0.015, F(3,60)=6.114, P=0.011, and F(3,60)=3.608, P=0.023, respectively. GH-C57BL/6 have the only elevation in one peak (peak 13) when compared to SH-C57BL/6, F(3,60)=38.525, P=0.025). Also, for the strain*housing condition interaction effect, it was very noticeable that DBA/2 was very responsive for changes of N-glycans, where SH-DBA/2 had a clear elevation for peaks 4, 10, 14, 15 when compared to GH-C57BL/6, (F(3,60)=1.822, P=0.013), (F(3,60)=4.862, P=0.007), (F(3,60)=6.874, P=0.007), and (F(3,60)=6.114, P=0.017), respectively. Also, separated MS spectra showed N-glycans of all experimental groups in Supporting Materials, Suplementry Figure 1. So, we can summarize that the more anxious DBA/2 strain, especially in the single housing condition, had a more responsive elevation in the majority peaks of our estimated N-glycan except for peaks 13 and 16.
Glycotyping Analysis
In our work, as shown in Table 3, we analyzed our peaks (from peak 1 to peak 16 collectively) to see if we got changes in the complexity of N-glycan sugars resulting from the strain and housing condition effects, and we found that constitutional sugars of N-glycan had been modified between groups. For instance, a strain effect was seen where
SH-C57BL/6 had more mannose when compared to SH-DBA/2, (F(3,60)=5.014, P=0.001). Also, GH-C57BL/6 had more tri-fuc and bisecting when compared to GH-DBA/2, (F(3,60)=3.305, P=0.03), (F(3,60)=2.041, P=0.037), respectively. In addition, SH-DBA/2 had more sial-1 than SH-C57BL/6, (F(3,60)=2.659, P=0.012). For the housing condition effect, it was noticeable that SH-DBA/2 had more mono-fuc and bisecting when compared to GH-DBA/2, (F(3,60)=8.527, P=0.002), (F(3,60)=2.041, P=0.048), respectively. For strain*housing condition interaction effect, we noticed that SH-C57BL/6 had more mannose, mono-fuc, di-fuc, and tri-anten than GH-DBA/2, (F(3,60)=5.041, P=0.006), (F(3,60)=8.527, P=0.0001), (F(3,60)=2.105, P=0.03), (F(3,60)=2.12, P=0.03), respectively. Also, GH-C57BL/6 had more tri-fuc than SH-DBA/2, (F(3,60)=3.305, P=0.03). Moreover, SH-DBA/2 had more sial-1 than GH-C57BL/6, (F(3,60)=2.659, P=0.012).
Table 2: N-glycan (µM) Candidates of C57BL/6 and DBA/2 Mouse Serum, Detected by Highest Amount (m±SEM) and their Significance Levels.
| Peak number | m/z | B6GH | D2GH | B6SH | D2SH | |
| Significance among groups and (P-value) | ||||||
| 1 | 1362.48109 | 1.599688±0.358 | 1.644062±0.264 | 1.859943±0.026 | 1.51222±0.486 | -------- |
| 2 | 1524.53392 | 2.449914±0.341 | 2.735487±0.303 | 3.114974±0.148 | 2.48021±0.761 | -------- |
| 3 | 1590.5921 | 0.60511±0.268 | 0.552507±0.069 | 0.874316±0.385 | 0.453037±0.148 | -------- |
| 4 | 1724.61363 | 1.255782±0.119 | 1.268822±0.757 | 1.257644±0.085 | 1.41012±0.502 |
(a)D2SH >B6SH (0.006**) |
|
b)D2SH >B6GH (0.013*) |
||||||
|
(c)D2SH >D2GH (0.009**) |
||||||
| 5 | 1752.64493 | 0.676181±0.123 | 0.538635±0.130 | 0.737794±0.204 | 0.691992±0.021 | ------------ |
| 6 | 1870.67154 | 5.19174±0.552 | 6.938155±1.921 | 5.13491±1.822 | 6.358571±3.394 | ------------ |
| 7 | 1886.66646 | 2.660618±0.237 | 2.988345±0.430 | 2.725851±0.329 | 3.427845±1.173 |
(b)D2SH >B6GH/SH (0.009**) |
|
c)D2SH >D2GH (0.033*) |
||||||
| 8 | 1927.69301 | 2.678752±0.710 | 3.248452±0.330 | 3.416554±0.117 | 3.252693±1.023 | ------------ |
| 9 | 2029.7247 | 7.419128±0.720 | 7.220807±1.549 | 5.85523±1.410 | 8.423314±4.280 |
(a)D2SH >B6SH (0.016*) |
| 10 | 2048.71929 | 1.88798±0.155 | 1.972627±0.271 | 1.903098±0.221 | 2.396446±0.794 |
(a)D2SH >B6SH (0.006**) |
|
(b)D2SH >B6GH (0.007**) |
||||||
|
(c)D2SH >D2GH (0.012*) |
||||||
| 11 | 2089.74584 | 14.04291±3.272 | 13.95085±2.200 | 15.17057±1.965 | 15.71592±6.732 | ------------ |
| 12 | 2175.78261 | I.S | ||||
| 13 | 2378.86199 | 3.874986±0.498 | 2.289706±0.235 | 2.80644±0.566 | 4.510598±1.136 |
(a)D2SH >B6SH (0.007**) |
|
a)B6GH >D2GH (0.007**) |
||||||
|
(c)D2SH >D2GH (0.002**) |
||||||
|
(c)B6GH >B6SH (0.025**) |
||||||
| 14 | 2425.88788 | 16.58407±1.785 | 17.22071±0.290 | 20.78292±2.745 | 24.63496±10.215 |
(b)D2SH >B6GH (0.007**) |
|
(c)D2SH >D2GH (0.015*) |
||||||
| 15 | 3112.12608 | 2.024847±0.522 | 1.754002±0.240 | 1.58869±0.454 | 2.686581±1.411 |
(a)D2SH >B6SH (0.005**) |
|
(b)D2SH >B6GH (0.017*) |
||||||
|
(c)D2SH >D2GH (0.011*) |
||||||
| 16 | 3140.15738 | 1.854932±0.618 | 1.165976±0.195 | 1.496282±0.397 | 1.552452±0.756 |
(a)B6GH>D2GH (0.023*), (c)D2SH >D2GH (0.023*) |
The statistical analysis revealed the highest expression of serum N-glycoforms of mouse, appeared in the general linear model, SPSS.”***” showed a significance level, P ≤ 0.001,”**” a significance level, P ≤ 0.01,”*” a significance level, P ≤ 0.05); and (---) not detected. B6GH: GH-C57BL/6J; D2GH: GH-DBA/2; B6SH: SH-C57BL/6J; D2SH: SH-DBA/2; I.S., internal standard.(a): strain effect; (b): strain and housing effect; (c): housing effect.
Correlation Analysis
The glycomic analysis of experimental mice showed a novel N-glycomic mechanical pathway and significantly correlated with the animal behavioral findings (Table 4) by a Pearson coefficient correlation test for the duration of grooming and by a Spearman’s rho correlation test for grooming bouts. In which, the N-glycan in peak7 showed moderate negative correlation with time light (%) in DL (r=-0.463, P=0.007). Also, peak 10, 13, showed moderate negative correlation with grooming bout frequency (r=-0.463, P=0.008), (r=-0.404, P=0.022) respectively, and with time light (%) in DL (r=-0.482, P=0.005), (r=-0.398, P=0.024), respectively; however positive correlation has been recorded with latency in DL (r=0.42, P=0.017) (r=0.427, P=0.015).Additionally, peak number 14 at 2425m/z showed a moderate negative correlation with grooming bout frequency (r=-0.424, P=0.016); however, a positive correlation was recorded with latency in DL (r=0.358, P=0.044). Lastly, peak number 15 at 3112m/z showed a moderate negative correlation with time light (%) in DL (r=-0.428, P=0.014).
Table 3: Glycotyping Analyses (m ± SEM) of N-glycan of C57BL/6 and DBA/2 Mouse Serum.
| Glycotyping | B6GH | D2GH | B6SH | D2SH | Significance, P-values |
| High-Man | 3.95 ± 1.36 | 4.33 ± 1.53 | 4.97 ± 1.76 | 3.71 ± 1.31 |
(a)B6SH > D2SH, (0.001***) |
|
(c)B6SH > B6GH, (0.006**) |
|||||
| Mono-Fuc | 9.60 ± 3.62 | 3.27 ± 1.16 | 20.78 ± 7.35 | 16.30 ± 5.76 |
(b)B6SH > D2GH, (0.0001***) |
|
(c)D2SH > D2GH, (0.002**) |
|||||
| Di-Fuc | 12.30 ± 4.47 | 10.79 ± 3.81 | 20.78 ± 7.35 | 16.30 ± 5.76 |
(b)B6SH > D2GH, (0.030*) |
| Tri-Fuc | 1.87± 0.64 | 1.20 ± 0.42 | 1.50 ± 0.53 | 1.35 ± 0.48 |
(a)B6GH > D2GH, (0.005**) |
|
(b)B6GH > D2SH, (0.030*) |
|||||
| Sial-1 | 29.43 ± 10.47 | 32.60 ± 11.52 | 31.20 ± 11.03 | 37.69 ± 13.33 |
(a)D2SH > B6SH, (0.012*) |
|
(b)D2SH > B6GH, (0.044*) |
|||||
| Sial-2 | 10.76 ± 3.80 | 9.68 ± 3.42 | 8.66 ± 3.06 | 9.40 ± 3.33 | ------------ |
| Bisecting | 12.45 ± 4.52 | 2.67 ± 0.94 | 10.31 ± 3.65 | 13.00 ± 4.60 |
(c)D2SH > D2GH, (0.048*) |
|
(a)B6GH > D2GH, (0.037*) |
|||||
| Bi-anten | 20.94 ± 7.52 | 20.58 ± 7.37 | 23.01 ± 8.13 | 19.66 ± 6.95 | ------------ |
| Tri-anten | 12.30 ± 4.47 | 10.79 ± 3.81 | 20.78 ± 7.35 | 16.30 ± 5.76 |
(b)B6SH > D2GH, (0.030*) |
| Tetra-anten | 3.99 ± 1.37 | 2.98 ± 1.05 | 3.08 ± 1.09 | 3.67 ± 1.30 |
(a)B6GH > D2GH, (0.081) |
Glycotyping analyses (m ± SEM) of high-mannose, mono-,di-, tri-fucosylated, and mono-,di-sialylated (Neu5Ac and/or Neu5Gc residue), bisecting and bi-, tri-, tetra-antennary N-glycan of mouse serum. The statistical analysis revealed the highest expression of serum N-glycoforms, appeared in the general linear model, SPSS.”***” showed a significance level, P ≤ 0.001,”**” a significance level, P ≤ 0.01, and ”*” a significance level, P ≤ 0.05, and (------------) not detected.). B6GH: GH-C57BL/6J; D2GH: GH-DBA/2; B6SH: SH-C57BL/6J; D2SH: SH-DBA/2. (a): strain effect; (b): strain and housing effect; (c): housing effect.
Table 4: The Correlations Between Grooming Frequency, Time Light (%), and Latency in DL with Serum N-glycan Peaks of C57BL/6 and DBA/2 Mouse.
| N-glycan peaks | ||||||||||
| Correlations Coefficient | Peak No. 1 | Peak No. 2 | Peak No. 4 | Peak No. 7 | Peak No. 9 | Peak No. 10 | Peak No. 13 | Peak No. 14 | Peak No. 15 | Peak No. 16 |
| Significance (Grooming bouts) | 0.058 | 0.015 | -0.255 | -0.295 | -0.143 | -0.463 | -0.404 | -0.424 | -0.252 | -0.066 |
| Spearman's rho (r) | 0.752 | 0.934 | 0.159 | 0.101 | 0.435 | 0.008 | 0.022 | 0.016 | 0.164 | 0.721 |
| Significance (Time light (%) in DL) | -0.121 | -0.12 | -0.34 | -0.358 | -80 | -0.482 | -0.398 | -0.315 | -0.117 | 0.019 |
| PearsonCorrelation(r) | 0.51 | 0.512 | 0.057 | 0.044 | 0.665 | 0.005 | 0.024 | 0.079 | 0.523 | 0.918 |
| Significance (Latency in DL) | -0.168 | -0.085 | 0.163 | 0.244 | 0.089 | 0.42 | 0.427 | 0.358 | 0.099 | -0.015 |
| Pearson Correlation(r) | 0.359 | 0.645 | 0.371 | 0.179 | 0.627 | 0.017 | 0.015 | 0.044 | 0.591 | 0.936 |
Each value represented Spearman’s rho correlation coefficients and Pearson Correlation (r) = 0.3-0.5, weak to moderate correlation. DL: dark light; No.: Number.
Anxiety-Related Behaviors In DBA/2 And C57BL/6J Mice
Home cage behavioral differences between C57BL6 and DBA/2 mice in the two housing conditions were initially reported in our previous published paper (Abou-Elnaga et al., 2019), where a detailed behavioral ethogram was used to evaluate their anxiety levels based on their home-cage behaviors (interaction with enriched environment, grooming, bedding-directed behavior, feeding, sleep, exploratory behavior, and locomotion). Our previous finding agreed with many authors who stated that DBA/2 mice are more anxious than C57BL/6J (Võikar et al., 2005; Brigman et al., 2009). The results of the detailed behavioral analyses for both mice strains (C57BL/6J and DBA/2) in single versus group housing (Abou-Elnaga et al., 2019) are added in the Suplementry Table 1 of the Supporting Information. However, other studies were comparing anxiety-related behavior by various anxiety tests that had no consistency in their results. DBA/2 mice were less anxious and displayed higher activity in the light area of the DL test (Beuzen and Belzung, 1995), but DBA/2 exhibited higher anxiety-like behavior than the C57BL/6 mice in the DL test in a study by Eltokhi et al. (2020). Moreover, DBA/2 mice were less anxious in the elevated plus-maze than C57BL/6 (Eltokhi et al., 2020), whereas DBA/2 was more anxious in the same test in Võikar et al. (2005).
To help eliminate confusion, anxiety-related behavior merited more approaches to assess the differences between both strains. A familiar way to evaluate anxiety is using the induced grooming test and DL test to assess gross activity characteristics such as the latency to groom, frequency, duration of grooming, percent of the time in the light, and latency to enter the light compartment (Eltokhi et al., 2020). It was reported that using grooming measurements can be used for quantifying obsessive-compulsive disorder (OCD) and Tourette syndrome severity in the mouse model (Ahmari et al., 2016). Consistent with this, psychotropic drugs that exacerbate OCD in clinical patients have been reported to elicit robust grooming in rodents (Zike et al., 2017). Therefore, the current study focused on detailed analyses of anxiety-related behaviors in induced grooming test and DL exploration test in single versus group housing conditions of DBA/2 and C57BL/6J mice.
Our findings showed that mice from DBA/2 and C57BL/6J mice strains exhibited divergent behavioral patterns. Overall, DBA/2 mice had grooming activity, lower vertical activity, higher levels of defecation, more latency to begin rearing and grooming, less time in light, and a higher latency to enter the light compartment in the DL test. From here, we can hypothesize the following: lower grooming levels in DBA/2 mice may result from lower activity levels in DBA/2 when compared to the C57BL/6J strain (Abou-Elnaga et al., 2019). Additionally, grooming has been identified as a behavioral pattern of stress in rodents raising the possibility that less grooming in DBA/2 mice may reflect a higher anxiety level (Abou-Elnaga et al., 2019), which would agree with a lot of studies stating that grooming may be inhibited in stressful conditions and during anxiety due to its effect on locomotion activity and the occurrence of the freezing response (Kalueff et al., 2016). A significant decrease in the grooming frequency and duration in single housed C57BL/6J and DBA/2 mice may result from the stressful condition of a single housing. However, such reduction in grooming activity appeared with high significance in C57BL/6J mice; it may have occurred because the C57BL/6Jmouse is genetically known to be more active compared to the DBA/2 mouse strain, and consequently groomed more. Therefore, the significant effect of single housing was more obvious in C57BL/6 mice because they performed more time in grooming activities than DBA/2 (Hatcher et al., 2001).
Our data also indicated that less rearing, and more latency to rear in DBA/2 mice. Vertical rearing is the main parameter that can be used to assess general physical-motor abilities, level of interest towards a novel environment, and anxiety (Pitsikas et al., 2018).Therefore, we suggest that low rearing may indicate more anxiety in DBA/2. Interestingly, our result agreed with authors who postulated that decreased rearing behavior was indicative of increased anxiety level in DBA/2 mice (Seibenhener and Wooten, 2015). In the same point of view, defecation and urination can be used as measures of individual differences in emotions that more anxious mice had a higher level of defecation in different behavioral tests than the less anxious ones (Lavu et al., 2020). Noticeably, for strain effect, DBA/2 showed more anxiety than the C57BL/6 mice, whereas for the housing condition effect it was obvious that anxiety was exaggerated in the single-housed mice in the DL exploration test only for the DBA/2 model. DBA/2 mice were more affected by housing conditions. This seems to agree with previous data suggesting that there was a different reaction to the environmental manipulations between the C57BL/6 and the DBA/2mice and housing-dependent differences were more evident in the DBA/2 strain (Võikar et al., 2005).
Functional Glycomics In DBA/2 And C57BL/6 JMICE
The selected 15 N-glycans structures in mice sera were identified in Glycosuit DB and CFG, and also shown in previous reports (Mahmoud et al., 2019; Rehan et al., 2020; Gizaw et al., 2015; Gizaw et al., 2016; Gebrehiwot et al., 2018; Rehan et al., 2015). Our results demonstrated that the mice sera contained both Neu5Ac and Neu5Gc-sial-terminal(s) due to the effect of the CMP-Neu5Ac Hydroxylase enzyme that converted Neu5Ac to Neu5Gc (Varki, 2001; Varki, 2007; Mahmoud et al., 2019; Rehan et al., 2020). In a previously published paper (Mahmoud et al., 2019; Rehan et al., 2020), we illustrated that sialylated N-glycans (Neu5Ac-terminals; peak 13 “2 X Neu5Ac-terminals” and peak 15 “1 X Neu5Ac-terminal”) regulate the homeostatic immune balance of mice. Also, the serum N-glycan peak at 2410 m/z (2 X Neu5Gc-terminals) was highly expressed as a biomarker of chronic stress in BALB/c mice (Mahmoud et al., 2019) or in mice infected with acute/chronic Toxoplasma gondii (Rehan et al., 2020). In our previous research, expressing the peak2410 m/z is evidence of an immune compensatory mechanism of (stressed/infected) BALB/c mice to cope with the depressive-like challenge (Mahmoud et al., 2019; Rehan et al., 2020).
Interestingly, peaks of the mouse N-glycan number 4, 7, 8, 9, 10, 11, 13, and 15at 1724m/z, 1886m/z, 1927m/z, 2029m/z, 2048m/z, 2089m/z, 2378m/z, and 3112m/z, were significantly elevated in DBA/2 mice, especially in single housing condition when compared to the other groups, giving us a theory for mice’s anxiety responses by post-translational protein glycosylation mechanism. Our findings are supported by previous research that reported that sialylated N-glycans are significantly altered in diseased/stressed patients compared to the control subjects (Saldova et al., 2010; Terashima et al., 2014). Interestingly, it was clear that during the N-glycome pathway from peak 1 to peak 16 the expression levels of N-glycans of Neu5Gc terminal (in peak 4,7, 9, 10, 11) were dramatically increased in SH-DBA/2 mice, which we hypothesize is a response to the anxiety state by modifying N-glycome profiles.
Also, we got more significant expressions of N-glycans of Neu5Acs (inpeak13 “2 X Neu5Ac” and peak15 “1 X Neu5Ac”) instead of Neu5Gcs, which confirmed the anxiety challenge and the immune defense in vivo, such modification of Neu5Gc into Neu5Ac terminal (shown in peaks13, 15) are peaks supposed to be a compensatory mechanism for anxiety state (Mahmoud et al., 2019; Rehan et al., 2020; Gizaw et al., 2015; Gizaw et al., 2016; Gebrehiwot et al., 2018; Rehan et al., 2015; Reiding et al., 2016). In addition, peaks 10, 13 (Neu5Gc and Neu5Ac terminals) showed a moderate negative correlation with grooming bouts frequency and with percent time in the light compartment in DL, also peak 14 (multi-antennary structures of N-glycan) showed the same correlation with grooming bouts frequency and a moderate negative correlation was noticed with latency to enter the light compartment in DL. The modest correlation is realistic because it might relate to the influences of anxiety-adapted responses of experimental mice on the biosynthetic pathway of N-glycome profiles through the epigenetic background on genetic DNA-mutations, along with the possible roles of sialyltransferases and glycosyltransferases enzymes. Altogether, would cope, as possible, the anxiety threshold for regulating the homeostasis and for making a compensatory mechanism, particularly in DBA/2 strain.
In contrast, peaknumber16 (tetra-antennary, and bisecting N-glycan) was significantly expressed in GH-C57BL/6J, which indicated the smoother sequences of sugars to the glycan structures due to enzymatic activity and N-glycan reaching the natural end of its pathway. The biosynthetic pathway of sialylated N-glycans, Neu5Ac/Neu5Gc-terminals, significantly confirmed the evidence of glycosyltransferase enzymes for maintaining homeostasis; particularly in SH-DBA/2mice. However, the different expression levels of N-glycans seemed likely to be associated with anxiety, which might influence the sialyltransferase and sialidase enzymes’ activities (Mahmoud et al., 2019; Rehan et al., 2020; Gebrehiwot et al., 2018). From our current results, we find that the biosynthetic pathway of N-glycome is influenced by the anxiety state and correlated to behavioral results of mice, so we hypothesize that sialylated N-glycomes profile can be used as a biomarker for assessing the level of anxiety in C57BL/6 and DBA/2 mice.
Glycotyping analysis revealed that complicated N-glycans, such as fucosylated-, sialylated-, and bisecting-N-glycans, were more highly expressed in the DBA/2 than in the C57BL/6 strain, indicating more anxiety levels in DBA/2. Noticeably, the high-mannose/simple N-glycans identified in peaks 1 and 2 were of the highest peaks/expressions in C57BL/6J, due to the activity of exo-mannosidases enzymes responsible for trimming the multi-mannose residues. We found that that the higher activity of exo-mannosidases, the better the fitness condition of C57BL/6 when compared to the DBA/2 mice. This result was similar to a previous report showing that significant amounts of high-mannose N-glycan structures (mannose 9 ~ mannose 5) were detected in Holstein cow sera in the spring season of the optimum weather condition to get the maximum milk production )Rehan et al., 2015 (.Therefore, the MS spectra of N-glycomics in mice sera significantly showed the simplicity in SH-C57BL/6 while the complexity of N-glycan structures was in SH-DBA/2 mice, respectively, because of the enzymatic activities during the post-translational modifications of glycoproteins under stress condition. Finally, our finding in C57BL/6 and DBA/2 mice may create a significant diagnostic biomarker of anxiety, and therefore we confirm that the behavioral observations and N-glycome profiles collectively can play vital diagnostic markers of emotional behaviors in mice.
CONCLUSIONS
We provided evidence that measured parameters in induced grooming test and DL detected in C57BL/6 and DBA/2 mice may be related to higher anxiety of DBA/2 and a lower anxiety level in C57BL/6 mice. By employing a glycoblotting approach combined with MALDI-TOF/MS analysis of serum glycoproteins from these mice, we found differences in N-glycans peak expression that was correlated with anxiety. This alteration of N-glycome expression might come also from housing conditions (single versus group). Consequently, the mice’s behavioral adaptations to such stressors made an elevation of the biosynthetic pathway and enzymatic activities of their serum N-glycan structures. We reveal that sialylated N-glycan is a marker of anxiety in C57BL/6 and DBA/2 mice. Therefore, our results indicate that the DBA/2 mice might be of use in neurobiology research as an anxiety-sensitive model animal.
ACKNOWLEDGMENTS
The authors thank the Faculty of Veterinary Medicine at Mansoura and Menofia universities, Egypt for helping us to finish the work. We deeply appreciate the referees’ efforts in the assessment of this article.
AUTHORS’ CONTRIBUTIONS
A.F.A and I.F.R mutually contributed chemicals, materials, and research methods in the manuscript. G.E.B shared in the strategy and sample analysis. All authors took part in the in-vitro as well as in vivo analysis. They drafted, revised, and approved the manuscript.
Conflicts Of Interest
The authors confirmed that there were no conflicts of interest.
The supplementary material was written in Table S1 and Figure S1. Moreover, more detailed information of chemicals and N-glycomic protocol, written in the Supporting Information I, II.
REFERENCES
Supplementary Material
Chemicals And Reagents
Three-Methyl-1-p-tolyltriazene (MTT), ammonium bicarbonate 99% (ABC), sodium 2-hydroxy-3-tetradecanamidopropane-1-sulfonate[1-propanesulfonic acid, 2-hydroxyl-3-myristamido, sodium salt (1:1); PHM], disialyloctasaccharide, and O-benzylhydroxylamine hydrochloride (BOA) were obtained from Tokyo Chemical Industry Co., Ltd. (Tokyo, Japan). BlotGlycoH beads were purchased from Sumitomo Bakelite, Co., Ltd. (Tokyo, Japan). Peptide N-glycosidase F (PNGase F) was purchased from New England Biolabs Inc. (Ipswich, MA, USA). Trypsin, dithiothreitol (DTT), and iodoacetamide (IAA) were purchased from Sigma-Aldrich, Inc. (St. Louis, MO, USA). SweetBlot was obtained from Systems Instruments Co., Inc. (Hachioji, Japan). MultiScreen Solvinert filter plates (0.45 μm low binding hydrophilic PTFE, MSRLN0410) were purchased from Millipore Co., Inc. (Tokyo, Japan). Mass measurements were performed using MALDI-TOF/MS (Ultraflex III, Bruker Daltonics, Germany), and IMB-SPSS software was obtained from IBM Co., Inc. (Armonk, NY, USA).
Glycoblotting-Based Serum Glycomics
Pretreatment (N-glycan realease): The premix composition [0.33 M ABC (2.52 mL), 0.4% PHM in 10 mMABC (1.26 mL), 120 mM DTT (0.84 mL), mess up to 8.4 mL with water] was prepared, and then 50 µL of that premix was freshly added to serum of each mouse (10 µL). The internal standard (disialyl-octasaccharide) was added carefully (40 μM final concentration) was added carefully and the mixture was incubated at 60oC for 30 min. Freshly prepared 20 µLof 123 mM IAA was added and incubated to allow alkylation process at 25°C for 60 min in the dark. The mixture was then treated with Trypsin (10 µL, 40U/µL in 1 mM HCl) at 37°C for 3 hours, followed by heat inactivation of the enzyme at 90°C for 10 min after being cooled to room temperature. N-glycans was enzymatically released from trypsin-digested glycopeptides by incubation with 65 units of PNGase F at 37oC overnight. Further, 60 µL of digested mixture containing N-glycans was directly applied to glycoblotting technology.
Glycoblotting (chemoselective ligation, washing, on-bead esterifications, and imine exchange): Five hundred microliters of BlotGlyco®H beads in a 10 mg/mL suspensionwith water was initially placed into the wells of a MultiScreen Solvinert®96-well filter plate, and water was then removed by a vacuum. The digested mixtures of mouse serum (20 µL) containing released N-glycan were applied to each well together with 180 μL of 2% AcOH/CH3CN.
Table S1: The Detailed Behavioural Ethogram of C57BL6 and DBA/2 Mouse.
| Behavioural ethogram | B6GH | D2GH | B6SH | D2SH | Results | P-value |
| In crawl-ball | 23.99 ± 3.52 | 56.14 ± 4.54 | 54.86 ± 4.25 | 72.84 ± 3.56 | D2GH>B6GH | P<0.001 |
| D2SH>B6SH | P<0.001 | |||||
| B6SH>B6GH | P<0.01 | |||||
| Home-cage grooming | 9.02 ± 1.05 | 7.67 ± 1.14 | 6.80 ± 1.94 | 11.82 ± 1.47 | D2SH>D2GH | P<0.01 |
| D2SH>B6SH | P<0.05 | |||||
| Bedding-directed behaviour | 13.88 ± 1.22 | 14.93 ± 1.58 | 22.08 ± 3.02 | 13.83 ± 1.15 | B6SH>D2SH | P<0.01 |
| B6SH>B6GH | P<0.01 | |||||
| Feeding | 6.07 ± 0.99 | 13.88 ± 0.75 | 6.11 ± 0.86 | 7.32 ± 0.98 | D2GH>B6GH | P<0.001 |
| D2GH>D2SH | P<0.001 | |||||
| Sleep | 43.02 ± 2.75 | 55.10 ± 3.45 | 37.50 ± 3.98 | 61.38 ± 5.12 | D2GH>B6GH | P<0.01 |
| D2GH>B6SH | P<0.001 | |||||
| D2SH>B6GH | P<0.001 | |||||
| D2SH>B6SH | P<0.001 | |||||
| Exploratory behaviour | 18.43 ± 2.16 | 3.33 ± 2.19 | 20.69 ± 3.15 | 3.87 ± 3.09 | B6GH>D2GH | P<0.001 |
| B6SH>D2SH | P<0.001 | |||||
| Locomotion | 3.78 ± 0.36 | 1.97 ± 0.45 | 3.88 ± 0.41 | 1.07 ± 0.35 | B6GH>D2GH | P<0.001 |
| B6SH>D2SH | P<0.001 | |||||
| B6GH: GH-C57BL/6J; D2GH: GH-DBA/2; B6SH: SH-C57BL/6J; D2SH: SH-DBA/2. | ||||||
The plate was incubated at 80oC for 45 min to dryness in a thermostat in order to capture the glycans in the sample mixtures onto the beads via stable hydrazone bonds, and this was followed by successive washing using 200 μL each of 2 M guanidine-HCl in 16.6 mM ABC and water and 1% triethylamine in MeOH twice each. The acetyl capping of unreactive hydrazide functional groups was performed using 10% acetic anhydride in MeOH at 25°C for 30 min. The remaining acetic anhydride was removed by a vacuum. In bead methyl esterification, each well was washed twice with 10 mM HCl, MeOH, and dioxane, consecutively, and 150 mM MTT was then added, and the plate was incubated at 60oC for 90 min. The beads were serially washed using 200 μL of dioxane, water, methanol, and water. In order to obtain a perfect transamination reaction, 20 μL of 50 mM BOA was added, followed by a treatment with 180 μL of 2% AcOH in CH3CN at 80°C for 45 min, and an incubation at 80oC for 45 min. Labeled N-glycans were finally eluted with 100 μL water, and then directed to SweetBlotTM, an automated glycan processing machine.
Mass Spectrometry (MALDI-TOF/MS): The recoveredN-glycans labeled with BOA were finally eluted with100 μL water, analyzed after being spotted on MTP 384 target plates, and then crystallized by drying under a vacuum with an equivalent volume of the liquid matrix solution, 100 mM α-cyano-4-hydroxycinnamic acid diethyl ammonium salt (CHCA-DEA) dissolved in buffer solution (MeOH:H2O: DMSO: 10 mM NaOH = 50: 39: 10: 1). MALDI-TOF/MS data were then displayed on
an Ultraflex III, equipped with a reflector and controlled by the FlexControl 3.0 software package according to the general protocol. All spectral conditions were obtained using the reflector mode, ions generated by Smartbeam (pulsed UV solid laser, λex= 355 nm, 50 Hz) with 25 kV as the acceleration voltage, 26.3 kV as the reflector voltage, 160 ns as pulsed ion extraction in the positive mode, and typically totaling 1,000 shots of each spot.
Data Analysis: MS data were analyzed with the FlexAnalysis 3.0 software (BrukerDaltonik GmbH, Bremen, Germany, S/N=6, and quality factor threshold of 30).


