Advances in Animal and Veterinary Sciences
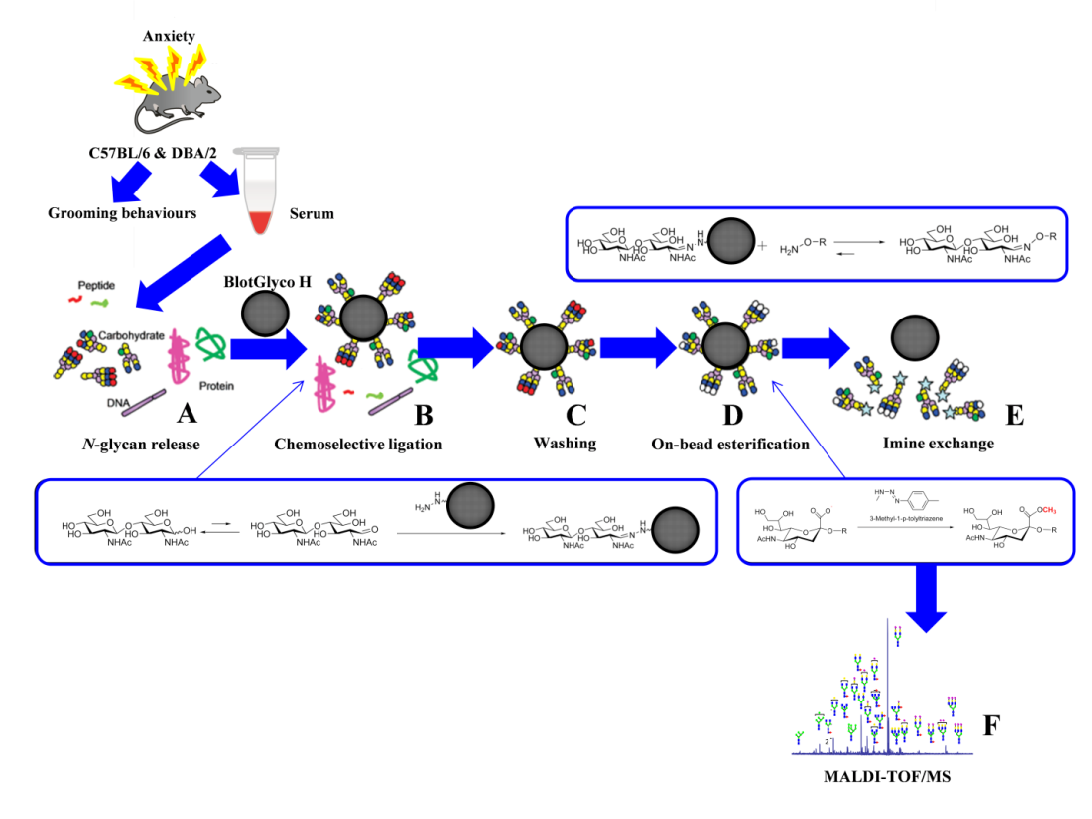
Glycoblotting followed by MALDI-TOF/MS analysis of mice sera: (A) N-glycan release; (B) chemoselective ligation of whole serum N-glycans by “BlotGlyco” beads; (C) washing; (D) on-bead esterifications of sialyl-terminal(s); and (E) trans-iminization by benzyloxiamine to generate BOA-tagged N-glycans; and (F) MALDI-TOF/MS analysis. The figure was drawn, in its original form,by the authors of this manuscript.

Average latency of first vertical rear, average duration of vertical activity, and number of fecal boli deposited by the mice of the two inbred stain of experimental treatments. Data represented as mean ± SEM.”***” showed a significance level, P ≤ 0.001,”**” a significance level, P ≤ 0.01,”*” a significance level, P ≤ 0.05). B6GH: GH-C57BL/6J; D2GH: GH-DBA/2; B6SH: SH-C57BL/6J; D2SH: SH-DBA/2; S: second.

Average latency to start grooming, average of total duration of grooming activity, and average number of grooming bouts by the mice of the two inbred strains of experimental treatments. Data represented as mean ± SEM.”***” showed a significance level, P ≤ 0.001,”**” a significance level, P ≤ 0.01,”*” a significance level, P ≤ 0.05 using SPSS program). B6GH: GH-C57BL/6J; D2GH: GH-DBA/2; B6SH: SH-C57BL/6J; D2SH: SH-DBA/2; S: second.
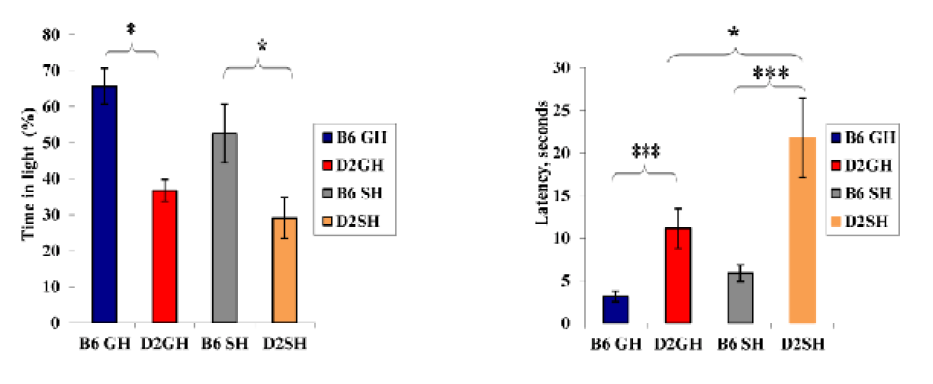
Time (%) in light litcompartment, latency in seconds to enter light compartment in DL box by the mice of the two inbred strains in the two experimental treatments. Data represented as mean ± SEM”***” showed a significance level, P≤ 0.001,”**” a significance level, P ≤ 0.01,”*” a significance level, P ≤ 0.05 using SPSS program). B6GH:GH-C57BL/6J; D2GH:GH-DBA/2; B6SH:SH-C57BL/6J; D2SH:SH-DBA/2; S: second.
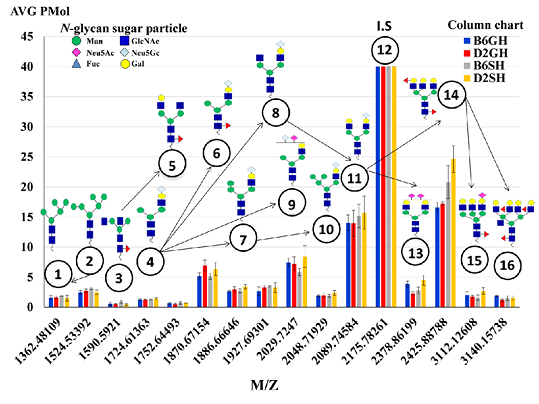
The average expression levels (pmole) of the 15 major N-glycans of the C57BL/6 and DBA/2 mouse serum, identified by the biosynthetic pathway. Peak number 12 at m/z 2175 assigned as an internal standard structured, [(Hex)2 (HexNAc)2 (Neu5Ac)2 + (Man)3 (GlcNAc)1], with 40 μM concentrations. N-glycans sugar particles showed as follow: HexNAc, N-acetylhexosamine (GlcNAc, N-acetylglucoseamine (blue square) or GalNAc, N-acetylgalactoseamine (yellow square) depends on the description); Deoxyhexose, fucose (redtriangle); Hex, hexose (Mannose (green circle), and galactose (yellow circle) depend on the description); and Neu5Ac, 5-N-acetylneuraminic acid (purple diamond), I.S, Internal Standard. B6GH:GH-C57BL/6J; D2GH: GH-DBA/2; B6SH: SH-C57BL/6J; D2SH: SH-DBA/2.
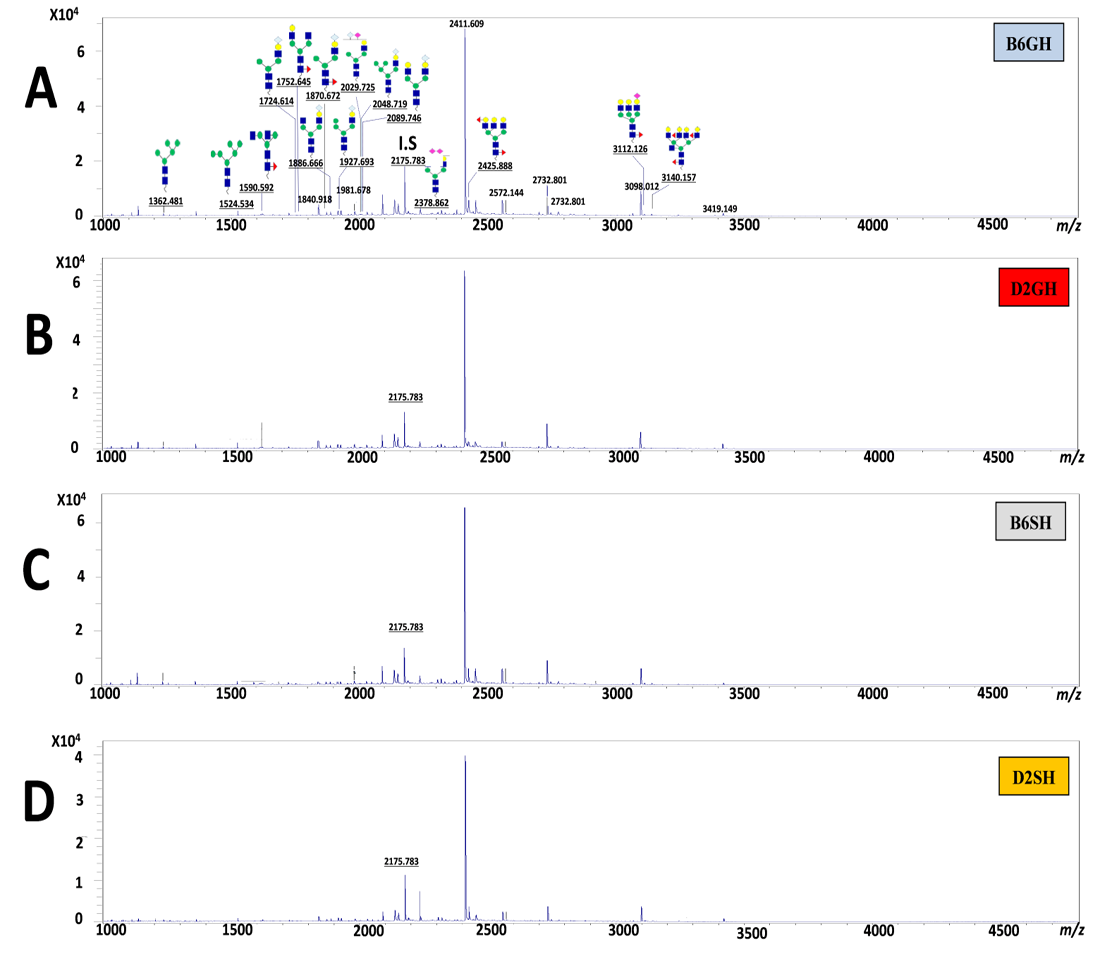
Representative MALDI-TOF/MS spectra showing typical N-glycan profiles of mouse serum. (A) in GH-C57BL/6, (B) in GH- DBA/2, (C) in SH- C57BL/6, and (D) in SH- DBA/2.I.S, internal standard at peak# 2175. B6GH: GH-C57BL/6J; D2GH: GH-DBA/2; B6SH: SH-C57BL/6J; D2SH: SH-DBA/2.


