Advances in Animal and Veterinary Sciences
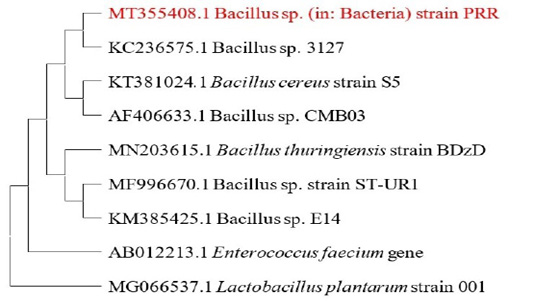
Shows the phylogenetic tree constructed using the maximum likelihood method. The tree with the highest log likelihood (-3972.48) is shown. Initial tree(s) for the heuristic search were made by using Neighbor-Join method coupled with BioNJ algorithm and then estimated using the Tamura-Nei model,at the end the topology with superior log likelihood value was selected. This analysis involved 9 nucleotide sequences. There were a total of 1559 positions in the final dataset. Enterococcus faecium and Lactobacillus plantarum were used as outgroups.
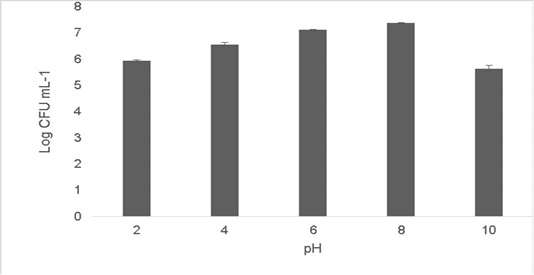
Shows cell viability of the isolate when subjected to pH ranges (2-10). The values shown are Mean±SD of triplicates.
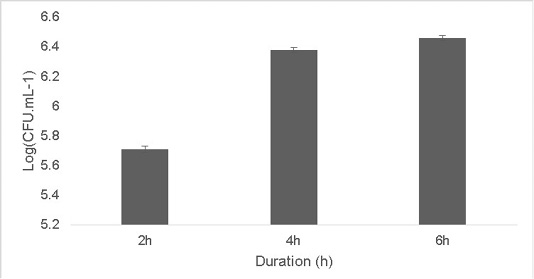
Effect of simulated artificial gastric juice on the growth of the isolate at duration of 2, 4 and 6h
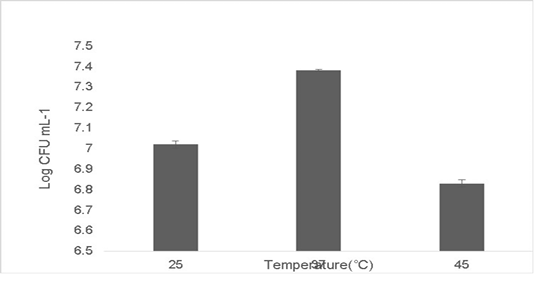
Shows heat tolerance of the isolate at ±10˚C deviations from 37 ˚C. Error bars indicate the standard deviation, the values are expressed as Mean±SD of triplicates.
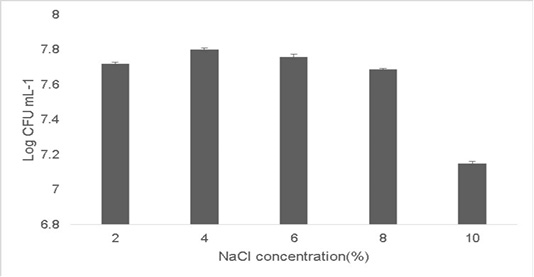
Osmotolerance of the isolate at varying concentration of NaCl (2%-10%). Error bars indicate the standard deviation, the values are expressed as Mean±SD of triplicates.
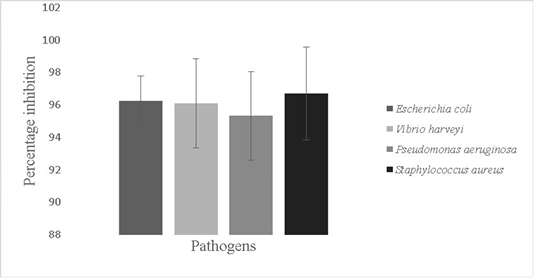
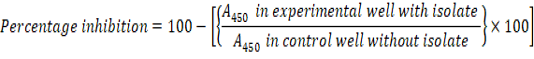
Antibiofilm activity of the isolate against pathogens; Escherichia coli, Vibrio harveyi, Pseudomonas aeruginosa and Staphylococcus aureus. The error bars indicate standard deviation and statistical significance indicated by * (P<0.05)
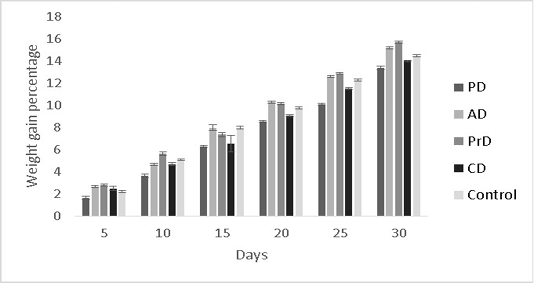
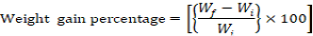
Showing the weight gain percentages of Danio rerio in the treatments PD, AD, PrD, CD and control. The trail was conducted for the duration of 30 days. The error bars indicate standard deviation.
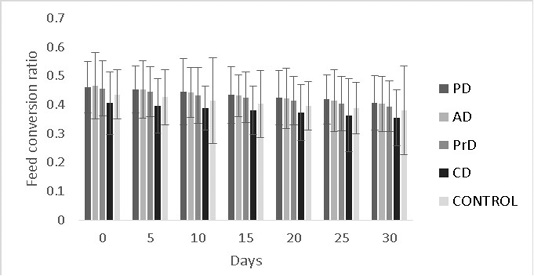
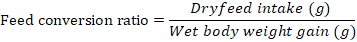
Shows the feed conversion ratios of Danio rerio treatment groups upon feed supplementation of PD, AD, PrD, CD and control. The parameter was monitored for a duration of 30 days. The error bars indicate standard deviation.
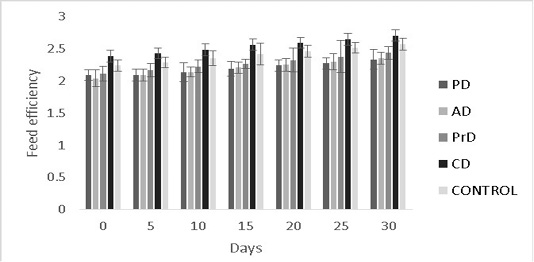
Feed efficiency of PD, AD, PrD, CD and control for a total duration of 30 days on treatment groups of Danio rerio. The error bars indicate standard deviation.


