Advances in Animal and Veterinary Sciences
Research Article

Principle Component Analysis of Breeding Values Estimated by Six Animal Models for Evaluating Some Productive and Reproductive Traits of Holstein Dairy Cattle
Sherif A. Moawed1*, Mohamed M. Osman2, El-Houssainy A. Rady3, Khairy M. El-Bayomi4, Ahmed F. Farag1
1Department of Animal Wealth Development (Biostatistics Division), Faculty of Veterinary Medicine, Suez Canal University, Ismailia 41522, Egypt; 2Department of Animal Wealth Development, Faculty of Veterinary Medicine, Suez Canal University, Ismailia 41522, Egypt; 3Department of Applied Statistics and Econometrics, Institute of Statistical Studies and Research, Cairo University, Cairo, Egypt; 4Department of Animal Wealth Development, Faculty of Veterinary Medicine, Zagazig University, Zagazig, Egypt.
Abstract | This study was conducted to estimate genetic parameters and breeding values (EBVs) for milk yield (MY), peak yield (PY), lactation length (LL), days open (DO), calving interval (CI), and services per conception (SC) of Holstein dairy cattle. The direct genetic, maternal genetic and maternal permanent environmental effects were separately evaluated. Furthermore, the principle components analysis (PCA) was applied to explore the relationships among the animal EBVs. Genetic parameters were estimated using the multi-trait restricted maximum likelihood methodology by incorporating six different models that either included or excluded maternal effects. The best model was selected based on the likelihood ratio test. In this context of the research, a total of 18221 cows were assessed for records between 2007 and 2018. Out of the six animal models, the fourth model was chosen as the best model, because it had the smallest -2 Log Likelihood value. The range of direct heritability values were 0.21-0.35, 0.02-0.30, 0.15-0.33, 0.04-0.18, 0.05-0.18, and 0.05-0.15 for MY, PY, LL, DO, CI, and SC, respectively. The estimated maternal heritabilities were lower than direct heritabilities informed by all models. However, models 4 and 6 showed the greatest increase in maternal heritability, for all traits. PCA reduced the standardized EBVs of traits into two components, explaining 75.04 % of the total genetic variance. The EBVs of MY, LL, DO, SC, and CI highly associated with PC1, whereas those of PY is closely connected with PC2. In conclusion, the selection indices could be planned based on two PCs instead of all traits.
Keywords | Animal model, Dairy cattle, Estimated breeding values, Maternal effects, estimated breeding values, principle components analysis
Received | February 06, 2021; Accepted | March 17, 2021; Published | July 01, 2021
*Correspondence | Sherif A Moawed, Department of Animal Wealth Development (Biostatistics Division), Faculty of Veterinary Medicine, Suez Canal University, Ismailia 41522, Egypt; Email: sherifmoawed@vet.suez.edu.eg; sherifstat@yahoo.com
Citation | Moawed SA, Osman MM, Rady HA, El-Bayomi KM, Farag AF (2021). Principle component analysis of breeding values estimated by six animal models for evaluating some productive and reproductive traits of holstein dairy cattle. Adv. Anim. Vet. Sci. 9(8): 1113-1122.
DOI | http://dx.doi.org/10.17582/journal.aavs/2021/9.8.1113.1122
ISSN (Online) | 2307-8316; ISSN (Print) | 2309-3331
Copyright © 2021 Moawed et al. This is an open access article distributed under the Creative Commons Attribution License, which permits unrestricted use, distribution, and reproduction in any medium, provided the original work is properly cited.
INTRODUCTION
Productive performance traits, such as milk yield and reproductive traits play an important role in the profitability of dairy cattle, because they minimize the generation interval, enhance the genetic progress, and lead to animals with better performance (Laureano et al., 2011). Moreover, the relationship that has been noticed between the direct and maternal genetic effects along with their correlation with production traits in dairy cows is essential for breeding programs and strategies (Campêlo et al., 2004). Thus, dairy cattle performance can be evaluated by milk yield and its related traits, because these traits are measurable and constitute moderate to high heritability estimates, which intern successfully respond to the selection strategies (Boligon et al., 2016).
Principle components analysis is defined as a multivariate statistical method that can be applied to minimize the number of correlated traits into a smaller number of independent variables called principle components, with minimum loss of information in the original data (Bolormaa et al., 2010). This approach produces orthogonal components that are linear combinations of the main variables, depending on the eigenvalues of the variables of interest. The eigenvalues are created in an order from the highest to the lowest one and each Principle component explains superior variability than the next PC (Meyer, 2007).
Multivariate methodologies, such as principle components analysis could be used to extract the loadings or coefficients that explain the maximum variation in the datasets, providing a tool that picks up the animals with similar characteristics. Once identified, these new components or groups could be selected for dairy breeding programs to improve both productivity and fertility (Karacaören and Kadarmideen 2008; Buzanskas et al., 2013; Jolliffe and Cadima 2016; Lopes et al., 2016). Besides, multivariate statistical models might denote relationships and significant outcomes that could not be possible when using univariate approaches (Lopes et al., 2013; Moraes et al., 2015; Fraga et al., 2016). Furthermore, multivariate methods help handle pertinent decisions in animal breeding programs (Cardoso et al., 2003; Selim et al., 2018).
Several studies used principle components methodology in animal breeding. For example, PCA has been investigated for genetic assessment of beef cattle (Bignardi et al., 2014; Boligon et al., 2016; Tramonte et al., 2019) and evaluation of reproductive traits of different breeds (Savegnago et al., 2011; Buzanskas et al., 2013). Bignardi et al. (2012), Moawed and Osman (2018), and Mello et al. (2019) applied PCA for dimension reduction of dairy cow traits. A recent exploratory study was conducted by Oliveira et al. (2014) who utilized PCA to evaluate nine traits in buffalo cattle in Brazil and concluded that the first four PCs are adequate to explore the covariance structure of these traits. The previous studies concluded that PCA permits minimizing the traits dimension, simplifies the interpretation of data with few components, and visualizes the relationship between the original datasets. However, few studies considered the breeding values in the PCA and only incorporated the original phenotypic traits.
By analyzing animal breeding values, it could be possible to identify the genetic relationships among the economically important traits of dairy cows, both in magnitude and direction (Savegnago et al. 2011; Porto-Neto et al. 2013; Osorio-Avalos et al., 2015). Therefore, the present study aimed to estimate genetic parameters and breeding values for the most economic traits of Holstein dairy cows using six different animal models. Furthermore, the principle components analysis (PCA) was applied to explore the relationship between the estimated breeding values for the functional traits.
MATERIALS AND METHODS
Dataset Description
The dataset investigated in this study was provided by a commercial dairy herd belonging to Modern Agricultural Development Company (MADC) located nearly 80 km from Alexandria, Egypt. The traits analyzed in Holstein Friesian cows were milk yield (MY), 305-day milk yield (305 DMY), peak yield (PY), lactation length (LL), days open (DO), calving interval (CI), and services per conception (SC). The dataset from three stations was collected representing 18221 cows. Animals were born between 2007 and 2018. At all three stations, cows were kept under similar feeding and management systems. Animals are kept in open sheds. All year round, cows fed ad libitum using Total Mixed Ration (TMR), and the ration formulations were done by the National Research Council (NRC) program. In most herds, heifers and cows were artificially bred using frozen semen imported from U.S.A and Canada. Heifers were bred when reached 350 - 375 kg of body weight and cows were served during the first heat after the 45th day post-partum. Cows were machine milked three times daily at eight hours intervals. Cows were usually milked until two months before the expected calving date.
Statistical Models And Genetic Parameters
Before estimation of genetic parameters and breeding values for the studied traits, data were examined and tested to be valid for the analytical model fitting. For all traits, records with fewer than three observations, and bulls having less than three offspring were excluded from the prepared data file. Normality of the trait’s residuals was verified and data with residual standard deviations greater than 3.5 and below -3.5 standard devotions were removed from the analysis (Buzanskas et al., 2013; Tramonte et al., 2019).
Six animal models were incorporated to estimate variance components, genetic parameters and subsequently breeding values for each trait. In all models, parity, age at calving, calving season (summer, autumn, winter, and spring), and year of calving (2007 and 2018) were included as fixed effects. Random effects were fitted based on the model type. Technically, the analysis was repeated several times until a minimum value of -2 Log L was detected, when -2 Log L remained constant (Lee and Taper 2002; Tilki et al., 2008). In all models applied, the direct additive genetic effect of the animal was considered as a random effect along with the random effect of residuals. In model 2, the random permanent environmental effect was employed. In model 3, the maternal genetic effect of the dam was added without consideration of the direct-maternal covariance. Model 4 was similar to model 3 but the direct-maternal covariance was assumed. Model 5 and model 6 employed all random effects (animal, maternal, environmental, and residuals), but the former model assumed no direct-maternal covariance, while the latter one took into account such covariance. The statistical models proposed for the studied traits are summarized as follows:
Model 1: 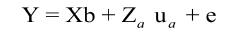
Model 2: 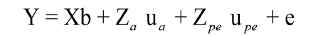
Model 3:  (σAM = 0)
Model 4: (σAM ≠ 0)
Model 5:  (σAM = 0)
Model 6: (σAM ≠ 0)
In which Y is n x 1 vector of observations for the traits; b is p x 1 vector of fixed effects, p = number of levels for fixed effects; ua is q x 1 vector of random animal effects, q = number of levels for random effects; upe is the vector of random permanent maternal environmental effects; um is the vector of N x Nm maternal additive genetic effects; X is the design matrix of order n x p, which relates records to fixed effects; Za is the design matrix of order n x q, which relates records to random animal effects; Zpe is the incidence matrix of permanent maternal environment effects; Zm is the incidence matrix of maternal genetic effects, and e is n x 1 vector of random residual effects.
The expected values and variance components are presented as follows:
E(y) = Xb; E(a) = E(e) = 0, therefore, var (e) = I = R ; var (a) = A
 = G, var (pe) =
  and var (m) =
  where A is the numerator relationship matrix and I is identity matrix.
The estimated heritabilities for both direct additive genetic effect and maternal genetic effects are given by the following equations (Willham, 1980):
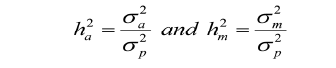
Where,  is the direct heritability;
  = maternal heritability; , and
  are the direct additive genetic variance, maternal additive genetic variances, and phenotypic variance, respectively. Variance components estimation, genetic parameters, and estimated breeding values (EBVs) for all traits were performed using VCE version 6.0.2 software according to permission from Groeneveld et al. (2008), based on the restricted maximum likelihood procedures of the general linear models.
Principle Component Analysis
Principle component analysis (PCA) is a multivariate dimensionality reduction statistical method and aimed to summarize the information involved in the original EBVs of studied traits into a smaller number of newly generated variables called principle components, without loss of vital information. Moreover, the analysis endeavored to find out the relationships between the EBVs (Hair et al., 2009). The EBVs of all traits were standardized through the standard normal distribution.
The Kaiser- Meyer-Olkin (KMO) and Bartlett’s tests were inserted for checking the sampling sufficiency of PCA (Cerny and Kaiser, 1977; Snedecor and William, 1989). The Kaiser criterion was also applied to choose the number of principle components that explain the maximum genetic variation in the data. Such criterion deemed only the principle components with eigenvalues greater than one. The eigenvalue of the principle component is connected with the variability of all EBVs of traits involved in the principle component, which intern constitutes an eigenvector (Rencher, 2002). These eigenvectors explain the correlation of each trait’s variance with the principle component. The KMO was calculated according to the following equation:
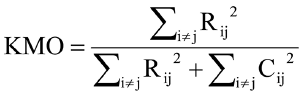
Where Rij is the correlation matrix and Cij is the partial covariance matrix.
Bartlett’s test of sphericity was utilized to detect the appropriateness of the data to be analyzed using PC analysis. This test compares the correlation matrix of EBVs of traits with the corresponding zero matrices, or identity matrix, to check the overall correlations among EBVs. This test is distributed as chi-square with a [p (p-1) / 2] as the degree of freedom, and is given as follows:
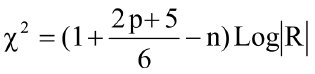
In which p is the number of traits, n is the overall sample size, and |R| is the determinant of correlation matrix R. The null hypothesis for Bartlett’s test of sphericity states that the correlation matrix is not diverged from the identity matrix (H0: traits are orthogonal). If H0 is rejected, PCA will do the reduction process for EBVs of traits without loss of information.
The principle components are independent variables representing a linear combination of variables (estimated breeding values). The first extracted and rotated principle component elucidates the highest percent of the total genetic variation in EBVs, followed by the second and third components. With a dataset consisted of p variables, the given principle component i (PCi) can be calculated as follows:
PCi = ai1X1 + ai2X2 + ai3X3 + … + aijXj
Where, i = 1,2,3,…,p and j = 1,2,3,…,p = jth standardized coefficient of the jth EBV of the ith principle component. Xj is the value of the original EBV.
By using the standardized EBVs of traits, the principle components score can be outputted. These scores resulted from the sum of standardized BVs for each trait weighted by the corresponding standardized score coefficient. The principle components could be used as an index to assess animals for different traits. The standardized coefficients were estimated as follows:
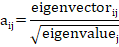
Where, aij is the standardized coefficient for EBVs of the jth productive or reproductive trait in the jth principal component. Data mining and analyses were conducted by SPSS software (SPSS, version 25) and, the PRINCOMP procedure statement of SAS (SAS 9.4, USA).
RESULTS AND DISCUSSION
The descriptive statistics for the productive and fertility traits obtained in this study are presented in Table 1. The means of milk yield, peak yield, lactation length, days open, calving interval, and services per conception were 5397.1 kg, 38.98 kg, 198.7 days, 159.7 days, 439.3 days, and 3.98, respectively. The values of the coefficient of variations were high and ranged from 20.96 % to 84.17 %. The heritability estimates and their standard errors for the investigated traits obtained from the six models are presented in Table 2. The direct heritability estimates for productive traits ranged from 0.21 to 0.35, from 0.02 to 0.30, and from 0.15 to 0.33, for MY, PY, and LL, respectively. The estimated direct heritabilities for fertility traits varied from 0.04 to 0.18, from 0.05 to 0.18, and from 0.05 to 0.15, for DO, CI, and SC, respectively. It was noticed that the standard errors of heritability estimates were all low.
Table 2 showed the values of maternal heritability for all traits as estimated by models 3, 4, 5, and 6. The values of maternal heritability of MY, PY, and LL ranged from 0.02 to 0.32, from 0.01 to 0.17, and from 0.03 to 0.07, respectively. Fertility traits presented maternal heritability estimates ranged from 0.04 to 0.21 for DO, from 0.04 to 0.14 for CI, and from 0.02 to 0.11 for SC. It was apparent that the model used in the estimation process considerably affected the values of direct and maternal heritability. In general, the estimates of maternal heritability for productive traits were lower than the direct heritabilities in the four mentioned models. While as, models 4 and 6 informed maternal heritability estimates higher than direct heritability values of reproductive traits.
According to models, the current results revealed that the inclusion of maternal effects (permanent environmental and additive genetic) in some models along with the existence of covariance between the direct effect of animals and maternal effects lead to varied heritability estimates and intern their variance components. Overall, an increase was observed in the values of direct heritability for productive traits (Table 2) following the insertion of maternal effects. Model 4 informed moderate to high direct heritability values (≥ 0.30) for MY, PY, and LL, accompanied by an increase in maternal heritabilities. Model 6 behaved like model 4, but with lower estimates. On the other hand, although, the direct heritability estimates for fertility traits were low, models 4 and 6 informed higher maternal heritabilities compared to other models. In terms of the chosen model, the results of the likelihood ratio test are presented in Table 3. Model 4 showed the lowest -2 Log-likelihood value (13882.24).
PCA was conducted using the EBVs of MY, PY, LL, DO, CI, and SC. The measures of sampling adequacy and the validity index of PCA are presented in Table 4. Kaiser-Meyer-Olkin (KMO) measures of sampling adequacy were 0.669, 0.735, 0.745, 0.592, 0.742, and 0.542 for models 1, 2, 3, 4, 5, and 6, respectively. Also, Bartlett’s test of Sphericity denoted significant chi-square statistics (P ≤ 0.0001) for all studied models. The number of extracted PC, eigenvalues, percentage of additive genetic variance explained by each component along with the cumulative proportion of genetic variance of EBVs of traits are presented in Table 5. Based on the best-fitted model (Table 3), model 4 retained only two components (eigenvalues > 1.0). From the six original traits (EBVsMY, EBVsPY, EBVsLL, EBVsDO, EBVsCI, and EBVsSC), 75.04 % of the total
Table 1: Descriptive statistics for the productive and reproductive traits studied in Holstein dairy cattle
| Trait investigated | Mean | Standard deviation | Coefficient of variation |
| Milk yield, kg | 5397.1 | 3821.8 | 70.81 |
| Peak yield, kg | 38.98 | 8.18 | 20.96 |
| Lactation length, days | 198.7 | 150.2 | 75.56 |
| Days open | 159.7 | 124.9 | 78.26 |
| Calving interval, days | 439.3 | 125.3 | 28.52 |
| Services per conception | 3.98 | 3.35 |
84.17 |
Table 2: Direct () and maternal () heritability estimates ± standard errors observed in the final data from the six animal models for investigated traits in Holstein dairy cattle
| Model | Heritability | MY | PY | LL | DO | CI | SC |
| Model 1 | Direct | 0.23 ± 0.04 | 0.02 ± 0.03 | 0.18 ± 0.03 | 0.14 ± 0.03 | 0.14 ± 0.03 | 0.07 ± 0.02 |
| Maternal | |||||||
| Model 2 | Direct | 0.26 ± 0.09 | 0.08 ± 0.11 | 0.22 ± 0.07 | 0.18 ± 0.05 | 0.18 ± 0.06 | 0.10 ± 0.03 |
| Maternal | |||||||
| Model 3 | Direct | 0.21 ± 0.01 | 0.02 ± 0.01 | 0.15 ± 0.02 | 0.09 ± 0.01 | 0.09 ± 0.01 | 0.05 ± 0.01 |
| Maternal | 0.02 ± 0.01 | 0.01 ± 0.01 | 0.03 ± 0.01 | 0.04 ± 0.01 | 0.04 ± 0.01 | 0.02 ± 0.01 | |
| Model 4 | Direct | 0.35 ± 0.03 | 0.30 ± 0.02 | 0.33 ± 0.02 | 0.06 ± 0.01 | 0.09 ± 0.01 | 0.09 ± 0.01 |
| Maternal | 0.32 ± 0.02 | 0.12 ± 0.01 | 0.05 ± 0.01 | 0.25 ± 0.02 | 0.13 ± 0.01 | 0.21 ± 0.02 | |
| Model 5 | Direct | 0.27 ± 0.01 | 0.04 ± 0.01 | 0.19 ± 0.01 | 0.13 ± 0.01 | 0.13 ± 0.01 | 0.09 ± 0.01 |
| Maternal | 0.02 ± 0.01 | 0.01 ± 0.01 | 0.03 ± 0.01 | 0.05 ± 0.01 | 0.05 ± 0.01 | 0.02 ± 0.01 | |
| Model 6 | Direct | 0.27 ± 0.04 | 0.18 ± 0.03 | 0.25 ± 0.06 | 0.04 ± 0.01 | 0.05 ± 0.01 | 0.15 ± 0.01 |
| Maternal | 0.21 ± 0.04 | 0.17 ± 0.03 | 0.07 ± 0.02 | 0.21 ± 0.06 | 0.14 ± 0.06 | 0.11 ± 0.08 |
of EBVs was explained by PC1 and PC2 (57.74 % for PC1 and 17.29 % for PC2) as informed by model 4.
Table 3: The results of Log-Likelihood Ratio Test (LRT) given by the studied models.
| Animal model | Log likelihood values (-2LogL) |
| Model 1 | 13899.23 |
| Model 2 | 13895.71 |
| Model 3 | 13897.71 |
| Model 4 | 13882.24 |
| Model 5 | 13892.94 |
| Model 6 | 13889.71 |
Table 6 showed the correlations of the significant EBVs of traits with each of the extracted components. These values represent the strength and direction of EBVs of traits picked or clustered by each PC. Given model 4, EBVs of MY, LL, DO, SC, and CI showed the greatest and positive correlations (> 0.70) with the first PC. EBVs of PY connected and related positively and strongly with the second PC, denoted a correlation value close to 0.76. Putting all models into consideration, it was observed that EBVs for most of the studied traits were positively and strongly associated with PC1. Although model 6 was suggested to be the second-best model, PCA showed the distribution of EBVs of traits in three components.
The overall description of the traits in this study (Table 1) were consistent with the findings of (Salem et al., 2006; Sahin et al., 2017; Mello et al., 2019), who conducted similar studies and estimated genetic parameters using the same six animal models. The high percentages of the coefficient of variations for all traits indicated the presence of high phenotypic variations among individual animals and hence, suggesting the possibility of selection and improvement of the current herd. Among the studied traits, the highest CV % was recorded for MY, LL, DO, and SC, which means that these traits could have a superior chance of being included in the selection index.
Overall, the direct heritability estimates for MY were moderate, and the highest values were informed by model 4. These values were in accordance with the findings reported by (Tilki et al., 2008; Karabulut et al., 2012; Agudelo-Gomez et al., 2015), who estimates direct heritability estimates for milk yield from 0.15 to 0.37. The direct heritabilities for PY were low in magnitude and the only improvement was observed in model 4, where the maternal genetic effect was added to the model, assuming the
Table 4: Measures of sampling adequacy and validity index of principle components analysis for the standardized breeding values of traits, estimated by the six animal models
| Model | Kaiser-Meyer-Olkin (KMO) test | Bartlett's test of sphericity | ||
| Chi-square | df | P value | ||
| Model 1 | 0.669 | 45848.025 | 21 | 0.0001 |
Model 2 | 0.735 | 58994.413 | 21 | 0.0001 |
Model 3 | 0.745 | 58274.774 | 21 | 0.0001 |
Model 4 | 0.592 | 38314.448 | 21 | 0.0001 |
Model 5 | 0.742 | 57139.315 | 21 | 0.0001 |
Model 6 | 0.542 | 37349.861 | 21 | 0.0001 |
Table 5: Eigenvalues for the retained principle components, the percentage and cumulative percentage of total additive genetic variance extracted in each animal model
| Animal model | Principle component | Eigenvalue | Percentage of total additive genetic variance (%) | Cumulative percentage of total additive genetic variance (%) |
Model 1 | PC1 | 4.458 | 63.68 % | 63.68 % |
| PC2 | 1.577 | 22.53 % | 86.22 % | |
| Model 2 | PC1 | 5.056 | 72.23 % | 72.23 % |
| PC2 | 1.336 | 19.09 % | 91.32 % | |
| Model 3 | PC1 | 5.006 | 71.52 % | 71.52 % |
| Model 4 | PC1 | 4.042 | 57.74 % | 57.74 % |
| PC2 | 1.211 | 17.29 % | 75.04 % | |
| Model 5 | PC1 | 5.336 | 76.23 % | 76.23 % |
| Model 6 | PC1 | 3.121 | 44.59 % | 44.59 % |
| PC2 | 1.898 | 27.11 % | 71.70 % | |
| PC3 | 1.183 | 16.89 % | 88.59 % |
Table 6: Linear correlations between the standardized estimated breeding values (genetic values) of the traits and the principle components
| Model | Principle component | Estimated Breeding Values (EBVs) of traits | |||||
EBVsMY | EBVsPY | EBVsLL | EBVsDO | EBVsSC | EBVsCI | ||
| Model 1 | PC1 | 0.862 | 0.585 | 0.965 | 0.940 | 0.667 | 0.882 |
| PC2 | 0.176 | 0.746 | - 0.150 | - 0.281 | - 0.434 | - 0.368 | |
| Model 2 | PC1 | 0.848 | 0.620 | 0.968 | 0.960 | 0.866 | 0.941 |
| PC2 | 0.059 | 0.747 | - 0.205 | - 0.240 | - 0.338 | - 0.279 | |
| Model 3 | PC1 | 0.846 | 0.747 | 0.988 | 0.954 | 0.555 | 0.851 |
| Model 4 | PC1 | 0.733 | 0.336 | 0.852 | 0.875 | 0.922 | 0.777 |
| PC2 | - 0.475 | 0.756 | - 0.363 | 0.428 | 0.103 | 0.574 | |
| Model 5 | PC1 | 0.865 | 0.759 | 0.977 | 0.959 | 0.738 | 0.898 |
| Model 6 | PC1 | 0.678 | - 0.545 | 0.906 | 0.746 | 0.006 | 0.525 |
| PC2 | - 0.225 | - 0.017 | - 0.343 | 0.533 | 0.800 | 0.789 | |
| PC3 | - 0.395 | 0.672 | 0.084 | 0.393 | - 0.553 | 0.303 | |
existence of direct-maternal covariance. The estimates for LL behaved as recorded in MY, but the estimates for LL were quite lower as compared to MY. The direct heritability estimates for PY and LL were lower than previously reported values (Rosati and Van Vleck, 2002; Bolivar-Vergara et al., 2012), but higher than that reported by (Boli gon et al., 2010; Seno et al., 2010; Buzanskas et al., 2013). It was obvious that the direct heritability estimates for all fertility traits were low (< 0.20) in all models, which agrees with the results of Sahin et al. (2017) who applied similar six animal models, reporting the same findings. In terms of accuracy and validity of the current estimates, the standard errors of heritability estimates were low for all traits and models, indicating that the current estimates are reliable and unbiased (Buzanskas et al., 2013). The present estimates of direct heritability revealed that selection based on productive traits, particularly MY and LL may be more effective and would lead to genetic progress compared with selection based on fertility traits because they denoted the highest estimates compared with other traits. Although, the direct heritability of fertility traits was low, suggesting that these traits could be influenced by the environmental conditions, however, the inclusion of these traits in the selection index is important to improve the cow’s performance (Buzanskas et al., 2013; Shalaby et al., 2015).
The present study showed lower estimates of maternal heritability (Table 2) as compared with the corresponding direct heritabilities for productive traits, indicating that the maternal additive genetic variances were lower than the direct additive genetic variance of the animals. These findings were in agreement with those reported by (Tilki et al., 2008; Abera et al., 2011; Sahin et al., 2012) who determined higher direct heritability estimates for Brown Swiss Cattle. Contrary, Karabulut et al. (2012) estimated higher maternal heritability estimates for the same studied traits. The estimated maternal heritability for fertility traits agrees with values denoted by (Albuquerque and Meyer, 2001; Malhado et al., 2007; Bolivar-Vergara et al., 2012) who reported values between 0.02 and 0.18.
In this research, the maternal effects were separated into two units, maternal environmental and maternal genetic effects. The current results revealed that model 4 with maternal additive genetic effects along with the direct-maternal covariance informed the highest improvement in heritability values, particularly for MY trait. These results came in accordance with those in the study of (Agudelo-Gomez et al., 2015; Shalaby et al., 2015) who estimated genetic parameters in Holstein-Friesian cows and fitted a similar model as best for genetic evaluation of dairy cattle. Although, model 6 informed similar results to model 4, however, the latter denoted superior improvement, both indirect and maternal heritabilities. This suggested that the insertion of permanent maternal environmental effect in the analytical model was insignificant. This conclusion is in contradiction with the results of Tilki et al. (2008) who mentioned that model 6 was the best. Based on the present heritability estimates and the best-fitted model (lowest LRT), where the direct-maternal genetic covariance has existed, it was concluded that the inclusion of maternal genetic effect in the model allows for a better estimation of heritability for productive traits. Besides, the reproductive efficiency of cows is affected by their dams. Accordingly, the improvement of health status, reproductive performance of dams would have an impact on cows in the future.
PCA was conducted using breeding values estimated by the six models for all traits. The high KMO values (Table 4) in the present study imply that the correlation between EBVs of traits was not unique, which is not related to the remaining EBVs outside each sample correlation. The values of KMO in this study are in agreement with the measures evaluated by Verma et al. (2015), who reported KMO measure of sampling adequacy to be 0.75, and Egena et al. (2014), who reported that KMO was equal to 0.80. The significance of correlation matrices tested with Bartlett’s test of Sphericity (Table 4) gives support for the authenticity of PCA analysis for the data set. The results of PCA (Table 5) are consistent with the previous reports (Buzanskas et al., 2013; Agudelo-Gomez et al., 2015; Moawed and Osman, 2018; Tramonte et al., 2019), indicating the usefulness of PCA to reduce data dimensions. According to Val and Ferraudo (2008), the first two components explained 71 % of the total variation in the original traits of dairy cattle. Oliveira et al. (2014) evaluated seven productive and reproductive traits in Brazil and concluded that the first three PCs are sufficient to explain more than 80 % of the total variance of EBVs of traits. The positive correlations of PCs with EBVs of traits (Table 6, model 4) suggested that the selection of animals could be made based on only two components instead of all traits. Thus, PC1 could be interpreted as a genetic index for MY, LL, and fertility traits, while PC2 could be used independently in selection programs, considering EBVs of PY.
CONCLUSIONS
According to the estimated heritability in this study, MY and LL would be the most representative traits to the selection schemes, while fertility traits could respond slowly to selection due to their low heritabilities. Moreover, considering the maternal effects of the dam in breeding programs may increase the rate of genetic improvement. PCA facilitates and ameliorates the selection process in dairy cattle by using correlations between traits EBVs and principle components, subsequently, reduce the domain of the analysis. Because the extracted components are independent, it can be concluded that EBVs of the studied traits can be analyzed and evaluated separately based on the first two PCs, allowing better planning for the selection process and thus genetic gains.
CONFLICT OF INTEREST
The authors declared no conflict of interest.
ACKNOWLEDGEMENT
Nothing to declare.
AUTHORS CONTRIBUTION
SAM, KME, and AFF designed the study. SAM and AFF collected the datasets and handled the data. SAM, EAR, and KME shared in the statistical analysis of the data. SAM and AFF edited the manuscript. All authors shared in the interpretation of results. The final copy of the manuscript was read and carefully approved by all authors.
REFERENCES


