Advances in Animal and Veterinary Sciences
Research Article

Molecular Characterization of GHR1 Gene and Expression Analysis of Some Growth-Related Genes in Oreochromis niloticus
Rania Said Aboukila1, Shabaan Abd Elatif Hemeda2, Abeer Fikry El Nahas2, Walaa Slouma Hamouda Abd El Naby2*
1Veterinarian in the Veterinary Medicine Directorate- Kafer Elsheikh, Egypt; 2Genetics and Genetic Engineering-Department of Animal Husbandry and Animal Wealth Development, Faculty of Veterinary Medicine, Alexandria University, Egypt.
Abstract | The objectives of the present study were to screen for nucleotide polymorphism in GHR1 gene among the large and small body weights’ Nile tilapia using DNA sequencing. Also, to compare the expression of some growth-related genes (GH, GHR1, IGF-1, MyoG, and MSTN) between variant weights in mono sex Nile tilapia using qRT-PCR. Molecular characterization of growth hormone receptor 1 (GHR1) gene revealed the presence of many SNPs among the large, and small-body weight fish, only two repeated SNPs were detected among the small body weight fish at the coding region within the gene at 2200 G>A, and the other one was at the 3`-untranslated region (2388 A>T). They can be used as a marker-assisted selection for culling of small size fish. Additionally, two SNPs at 2116 C>A and 2117 A>G reported in large body weight fish can be used as a marker for selection to increase body weight in Nile tilapia. The expression profiles of growth-related genes are variable between the small and large body weight fish. The expression of GH and MSTN genes increased in small body weight fish than large body weight. The GHR1 and MyoG gene expression significantly increased in fish of large body weight, suggesting their vital role in Nile tilapia growth. No variation in IGF-1 gene expression between the variant weights’ fish was observed. We conclude that SNPs at GHR1 and increased its expression together with the MyoG gene in large size fish proposed them as candidate genes to be more evaluated for efficient growth breeding programs in Nile tilapia.
Keywords | Nile tilapia; Growth-related genes; Expression; SNPs; Polymorphism
Received | March 12, 2021; Accepted | March 17, 2021; Published | June 15, 2021
*Correspondence | Walaa S.H. Abd El Naby, Genetics and Genetic Engineering-Department of Animal Husbandry and Animal Wealth Development, Faculty of Veterinary Medicine, Alexandria University, Egypt; Email: walaa.hamouda@alexu.edu.eg
Citation | Aboukila RS, Hemeda SAE, El Nahas AF, Abd El Naby WSH (2021). Molecular characterization of GHR1 gene and expression analysis of some growth-related genes in oreochromis niloticus. Adv. Anim. Vet. Sci. 9(7): 1025-1033.
DOI | http://dx.doi.org/10.17582/journal.aavs/2021/9.7.1025.1033
ISSN (Online) | 2307-8316; ISSN (Print) | 2309-3331
Copyright © 2021 Abd El Naby et al. This is an open access article distributed under the Creative Commons Attribution License, which permits unrestricted use, distribution, and reproduction in any medium, provided the original work is properly cited.
INTRODUCTION
Fish has much economic importance as a source of animal protein as well as many valuable products (Yan and Wang, 2010). The growth rate of cultured fish is one of the most important factors for the success of aquaculture. Body mass is depending on skeletal muscles because they occupy 70% of body weight. The growth of fish skeletal muscle is controlled by group of genes as growth hormone (GH), growth hormone receptor (GHR), insulin-like growth factor (IGF1), myogenic regulatory factors (MRFs), myostatine (MSTN) and others (De-Santis et al., 2007; Seiliez et al., 2012; Fuentes et al., 2013; Dias et al., 2019; Teng et al., 2020). The growth variation that related to extrinsic factors such as feeding protocol, duration of the feeding, and others, influence on the juvenile Nile tilapia body weight gain through their effect on the expression of muscle growth-related genes (Nebo et al., 2013). However, this variation caused by an extrinsic factor has a genetic base caused by the polymorphism at the coding regions of some of these genes are associated with variation in body size (Wringe et al., 2010; Tong and Sun, 2015). Selection for growth traits in farm animals and fish based on the polymorphism in the growth-related genes can be screened using many techniques (Yang et al., 2013). Genetic polymorphism is a difference in DNA sequence among individuals, groups, or populations. It includes single nucleotide polymorphisms (SNPs), sequence repeats, recombination, insertions, and deletions. SNPs reflect a particular position at which more than one nucleotide is identified and only two alleles at a SNP locus. The SNPs may lead to a change in the phenotypic appearance of the individual. The variation can be utilized as a marker for good traits and culling individuals having weak traits (Vignal et al., 2002).
Growth hormone receptor (GHR) is a critical regulator of growth and metabolism. It induces a phosphorylation cascade for signaling and gene expression by binding with GH (Ma et al., 2007). The GH belongs to the GH/prolactin (PRL)/ somatolactin (SL) family. It is a pluripotent hormone produced by the pituitary gland which has an important role in many physiological functions such as growth, metabolism, cellular differentiation, immunity, and reproduction in vertebrate (Rienecke et al., 2005). The IGFs are the mediators of the growth hormone that promotes mitosis, induces cell differentiation, and regulates body growth IGF-1 is structurally related to pro-insulin (Laron, 2001). Moreover, IGF-1 is a potent mitogenic factor that induces growth and stimulates differentiated functions of several cell types (Rienecke et al., 2005). The Myogenine gene (MyoG) is one of the members of the myogenic regulatory factors (MRFs) which include also MyoD, Myf5, and MRF4. The MRFs can convert a variety of non-muscle cells into myoblasts and myotubes (Johnston et al., 2011). MSTN gene is an important negative regulator gene of the skeletal muscle mass; it is known as growth and differentiation factor-8 (GDF-8), it inhibits muscle growth (Baylan et al., 2015).
Little data are available on such comparison of gene expression profile of growth-related genes among the small and large weight Nile tilapia, also, no data are available on the polymorphism of GHR1 among different body weight fish. So, this study was conducted to investigate GHR1 gene polymorphisms in large and small body weight using DNA sequencing. Also, to quantify the expression levels of some growth-related genes (GH, GHR1, IGF-1, MyoG, and MSTN) among the variant sizes’ mono-sex Nile tilapia.
MATERIAL AND METHODS
Experimental design and samples collection
Thirty mono-sex Nile Tilapia (Oreochromis niloticus) were obtained from a private mono-sex fish farm in El-Riad, Kafr El-sheikh, Egypt from the same bond during the fishing time. The collected fish were divided into two groups according to their body weight. The large body weight group (n=15) ranged from 394 to 485 gm, and small body weight group ranged from 105 to 290 gm. Whole blood was collected from the caudal vein on anti-coagulant and was stored at -20 ºC until DNA extraction for screening of the polymorphism of GHR1gene.
Other selected fish were categorized according to their weights into large (412, 427, and 475 gm), medium (229, 235, and 242 gm) and small (132, 142, and 183 gm) and were used for gene expression study. Liver tissue samples were collected and stored at -80ºC for RNA Extraction. The experimental design is illustrated in Fig. (1). All experimental procedures used for this study were approved by the local ethics committee of animal use, Faculty of Veterinary Medicine, Alexandria University, Egypt.
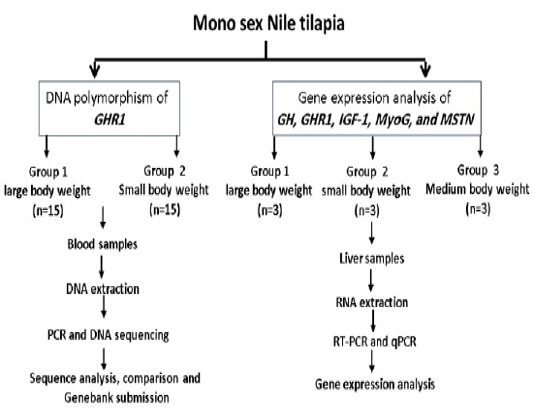
Figure 1: Experimental design
DNA Extraction, PCR amplification of GHR1 gene, DNA sequencing and data analysis
DNA was extracted using Gene JET Whole Blood Genomic DNA Purification Mini Kit (Thermo Scientific, Lithuania), according to manufacture instructions. The primers used for amplification of GHR1 were shown in Table (1). A segment of GHR1 from 1430-2779 bp was amplified using two primers, they were designed using NCBI tool to amplify region one (coding region; 709 bp, from 1430 bp to 2138 bp), and primer 2 to amplify region two (700 bp, from 2080 to 2779) (represent the terminal part of the coding region and 3`-untranslated region of GHR1 gene (2237-2779 bp). Amplification of GHR1 gene fragment was performed in 50 μl reaction volume containing 25 μl master mix, 5 μl genomic DNA, 1 μl of each primer and 18 μl dH2O. The final reaction mixture was placed in a thermal cycler (Techne, TC-3000, USA). The PCR program was carried out by initial denaturation
Table 1: Primers sequences used for amplification of the coding region of GHR1 gene.
| Primers |
Sequence (5`→3`) |
Annealing temperature (ºC) | Amplicon size (bp) |
| Primer 1 |
F: TCCCAACCTGTCAGTCAACAC R: AAGGCGGGTTAAGGAGCAG |
60 | 709 |
| Primer 2 |
F: AGACTACACAGTGGTTCAGGAG R: TGAGTTAAGAAAGATAGGAACGGT |
57 | 700 |
Table 2: List of primers used in qRT-PCR.
| Primers |
Sequence (5`→3`) |
Accession No. | Amplicon size (bp) |
| GH |
F: GGAGTTTCCCAGTCGCTCTC R: TCAGCAGCAAGATTCCCGTT |
XM_003442542
|
95 |
| GHR1 |
F: ACAGCCATCACAGTCTGCTC R: TGTACCCCACAGGCATAGGT |
XM_019365174
|
99 |
| IGF-1 |
F: CTGTGGAGAGCGAGGCTTTT R: CAGCTTTGGAAGCAGCACTC |
NM_001279503
|
99 |
| MyoG |
F: CAGCCACACTGAGGGAGAAG R: TCTGGTTGGGGTTCATCAGC |
NM_001279526
|
90 |
| MSTN |
F: GCATCTGTCTCAGATCGTGCT R: TGCCATCATTACAATTGTCTCCG |
XM_003458832
|
95 |
|
β-actin |
F: TGGCAATGAGAGGTTCCG R: TGCTGTTGTAGGTGGTTTCG |
XM_003443127
|
136 |
GH = Growth Hormone; GHR1 = Growth Hormone receptor1; IGF-1=Insulin like growth factor1; MyoG= Myogenine; MSTN = myostatin and β-actin=beta actin
at 95 ºC for 5 min followed by 35 cycles of 94 ºC for 1 min for DNA denaturation, annealing temperature as shown in Table (1) for 1 min, extension at 72 ºC for 1 min and final extension at 72 ºC for 10 min according to manufacture instructions of 2X PCR Master mix Solution, i-TaqTM, Intron Biotechnology, Korea with few modifications. PCR products of each sample and 100 bp DNA ladder (GeneDirex Taiwan) were loaded in 2% agarose gel stained with ethidium bromide. The electrophoresis gel was visualized and photographed using the gel documentation system (Gel Doc. Alpha-chem. Imager, USA).
PCR products were purified by using MEGAquick-spintm total fragment DNA purification kit (Intron Biotechnology, Korea) according to manufacture instruction. The sequence was performed for five fish (two large and three small weights) for each primer. The purified PCR products were sequenced in one direction (forward primer) by DNA sequencer (LGC Company, Germany). The sequence results were analyzed using Chromas 1.45 (http://www.technelysium.com.au), then the sequences’ comparisons were done using the BLAST database (https://blast.ncbi.nlm.nih.gov/Blast.cgi) The alignment of obtained sequences was done by Clustalw program version 1.8 (Thompson et al., 1994). The amino acid translation was done using the ExPASy-Translate tool (https://web.expasy.org/translate)
Total RNA Extraction, and cDNA Synthesis
The RNA was extracted from the liver tissue of nine fish (three large, three medium, and three small body weights) by Trizol (BioFlux, Japan) according to manufacture instructions. The extracted RNA from each group was used for cDNA synthesis by Hicen Script™ cDNA Synthesis Kit (Intron Biotechnology, United Kingdom) according to manufacture instruction.
Quantitative real-time PCR of selected target genes and data analysis
The qRT-PCR reaction was carried out to determine GHR1, GH, IGF-1, MyoG, MSTN and β-actin expression levels using primers listed in (Table 2). The reaction mixture is 20 μl, consisting of 2 μl cDNA, 0.8 μl of each primer (50 nm), 10 μl of Syber green (Bioline, United Kingdom), and 6.4 μl of RNase-free H2O. The qRT PCR program was an initial denaturation at 95°C for 10 min followed by 40 cycles of 95°C for 15 sec and annealing temperature 60°C.
The target genes’ expressions of GHR1, GH, IGF-1, MyoG and MSTN were calculated using a comparative threshold cycle (Ct) method (Rao et al., 2013), and the results were reported as fold change as compared to the calibrator (medium-size fish) after normalization of the transcript amount to β-actin gene as an endogenous control. The statistical significance analysis was done using one-way analysis of variance (ANOVA). Data are expressed as means±SD and P ≤0.05 are considered significant.
Table 3: Comparison of the SNPs in region 1 of GHR1 among the large and small size fish.
| Large size fish | Small size fish | ||||
| Fish 1 | Fish 2 | Fish 3 | Fish 4 | Fish 5 | Fish 6 |
| - | - | - |
- |
1663 C>T | - |
|
- |
- | - |
- |
1710 C>G | - |
|
- |
- | - |
- |
2016 C>T | - |
| 2161 C>T | - | - |
- |
2161 C>T | |
|
- |
- | - |
- |
2200 G>A |
- |
Table 4: Comparison of the SNPs in the coding and non-coding region 2 of GHR1 among the large and small size fish.
| Large size fish | Small size fish | ||||
| Fish 1 | Fish 2 | Fish 3 | Fish 4 | Fish 5 |
Fish 6 |
| - |
- |
2116 C>A | - | - | - |
|
- |
- | 2117 A>G | - | - | - |
|
- |
2161 C>T | - | - | - | - |
|
- |
- | - |
- |
2123 C>G | - |
|
- |
- |
- |
2200 G>A | 2200 G>A |
2200 G>A |
| - | - |
- |
2301 G>A | - | - |
|
- |
- | - |
- |
2309 C>T | - |
|
- |
- |
- |
2388 A>T | 2388 A>T |
2388 A>T |
| - | 2501 A>G | 2501 A>G | 2501 A>G | 2501 A>G |
2501 A>G |
| - | 2543 G>A | 2543 G>A | 2543 G>A | 2543 G>A |
2543 G>A |
| - | 2625 G>A | 2625 G>A | 2625 G>A | 2625 G>A |
2625 G>A |
Gray color of the tables represents SNPs at the 3`-untrnslated region of GHR1
RESULT
GHR1 gene polymorphism
The sequences of region 1 of GHR1 of Nile tilapia in two large body weights and three small body weights were submitted to gene bank and received the accession No# MW509674, MW509675, MW509676, MW509677, and MW509678. Comparison of the aligned sequences’ region 1 of GHR1 revealed a presence of a repeated SNP (2161 C>T) which was observed in both large and small body weight fish (Table 3).
The sequences of the region 2 of GHR1 of Nile tilapia in two large body weights and three small body weights were submitted to gene bank and received the accession No MW509679, MW509680, MW509681, MW509682, and MW509683. Sequence alignment between the studied fish revealed the presence of common SNPs at the coding region of GHR1 (2200 G>A), and the other at the 3`-untranslated region of the gene (2388 A>T) among the small body weight fish. Repeated three SNPs were also observed in both small and large body weights’ fish at the 3`-untranslated region of the gene (2501 A>G), (2543 G>A), and (2625 G>A) (Table 4).
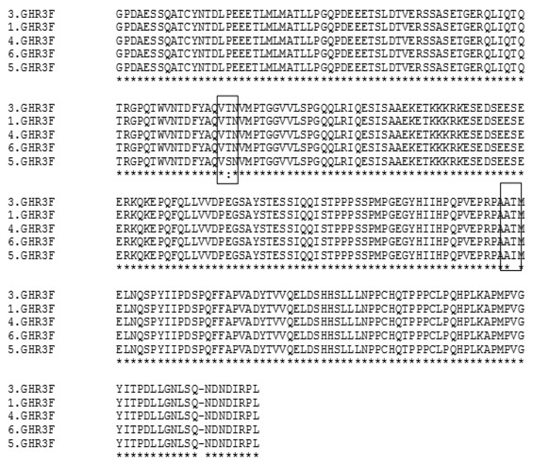
The translation of region 1 of Nile tilapia GHR1 occurred in two large body weight, and three small body weight are illustrated in Figure (2). A change in amino acid number 460 from threonine to serine (460 T >S) and amino acid number 562 from threonine to isoleucine (562 T >I) was detected in fish number 5 (one of the small body weight group).
Amino acid sequence alignment of the coding region 2 of GHR1 is illustrated in Fig. (3). No amino acid difference was observed among the large and small body weight fish in this region.
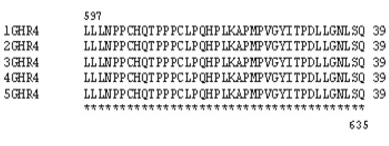
Figure 3: Amino acid alignment in the coding region 2 of GHR1 for 2 large and 3 small body weight fish
Expression levels of selected muscle growth related genes in large, medium, and small body weight of Nile Tilapia
The expression profiles of selected growth-related genes (GH, GHR1, IGF-1, MyoG and MSTN) are variable between the small and large body weights’ fish. Expression of GH gene was significantly up regulated (P≤0.05) in small and large body weight fish to 20.49±1.04 and 6.54 ± 0.03-fold relative to control as shown in Fig. (4a). However, a significant increase in its expression was observed in small body weight fish. The GHR1 expression profile revealed a significant increase in both large and small body weight (21.7±0.46 and 8.86±2.66 fold) (Fig. 4b). The highest significant expression was observed in fish of large body weight. Meanwhile, IGF-1 expression level decreased in both large and small body weight fish (0.84 ± 0.97 and 0.10 ± 0.1) as shown in fig. (4c).
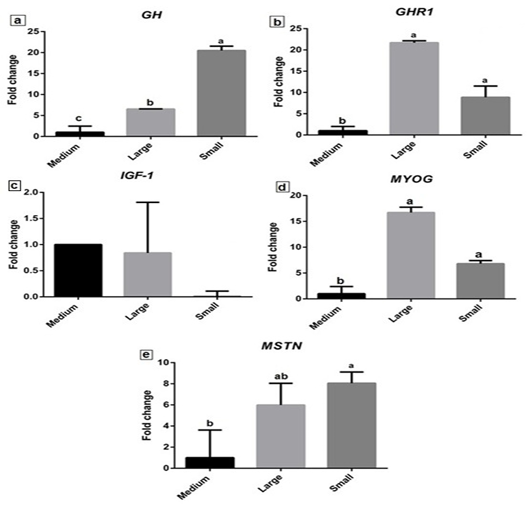
Figure 4: The relative expression levels of GH, GHR1, IGF-1, MyoG, and MSTN genes in Nile Tilapia liver tissue of large, medium, and small body weight. Letters a, b, and c on the data bars indicate when P≤ 0.05 significant.
MyoG gene expression showed a significant upregulation (P≤0.05) in both large and small body weight fish relative to control (Fig. 4d). More increased expression of MyoG was observed in large body weight to 16.70±1.04 fold than small body weight Nile tilapia (6.80±0.60 fold). The expression level of MSTN revealed significant (P≤0.05) increased in small body weight fish (8.05±1.06 fold) and its increase in large body weight (5.99±2.06) (Fig. 4e).
DISCUSSION
In this study, the sequencing of GHR1 gene in Nile tilapia was applied on two large body weight fish and three small body weight fish. Many SNPs were detected in large and small body weight fish groups in GHR1 gene. The SNPs were detected in both regions 1 and 2. In the region one, the SNPs are presented individually in fish. However, in the region two repeated SNPs were detected among the three small-size fish and can be used as a strong marker in GHR1 gene for culling of small size fish. On the other hand, the SNPs at 2116 C>A and 2117 A>G reported in large body weight can be used as a marker of selection for increasing body weight in Tilapia fish. Tao et al. (2011) found 38 SNPs in GHRs of Cyprinus carpio, but there were only five SNPs that can be used in molecular breeding. The presence of SNPs in GHR1 revealed changes of some amino acid sequences in region 1 and 2. Likewise, Prinzio et al. (2010) detected three nucleotides substitutions in GHR1 by Southern blot in Zebrafish, they also detected shorter GHR1 isoforms, which have deletions that render changes in the intracellular domain, involved in different signal transduction pathways. Diopere et al. (2012) found that there were eight SNPs in GHR1 in Solea solea, which were associated with amino acid substitutions.
We demonstrate that the expressions of growth-related genes (GH, GHR1, IGF-1, MyoG, and MSTN) are variable between the small and large body weight fish. Similarly, many authors reported variable gene expression of growth-related genes and myogenesis between small and large body weight fish and animals (Carnevali et al., 2006; Filby and Tyler, 2007; Opazo et al., 2017).
Atlantic, rainbow trout and Chinook salmon showed the presence of different forms of GH, and GHR (Very et al., 2005; Von Schalburg et al., 2008). The different forms of GH and GHR in wild and domestic salmon and trout can show altered expression that could indicate functional differences. Changes in the relative ratio of expression of the corresponding genes may alter function, even though the combined overall expression remains the same (Tymchuk et al., 2009). Perez-Sanchez and Le Bail, (1999) thought that, ideal growth performance achieved with low plasma GH in combination with a high concentration of hepatic GHRs and high circulating levels of IGFs. In the present study, the GH gene expression showed a significant difference between the large and the small body weight fish. Its expression was more in the small body weight group than the large-body weight group. Similarly, Opazo et al. (2017) proved that the GH mRNA level was slightly higher in smaller larvae of zebrafish than in large larvae. However, Huang et al. (2012) reported that fast-growing group of Nile Tilapia had up regulation in GH mRNA expression level than the slow-growing group. Additionally, Ma et al. (2012) found that the extra-large Cynoglossus semilaevis male fish has increased GH mRNA level than normal male. Likewise, the GH mRNA is more expressed in fast growing juvenile group than the slow and moderate growing groups (Mun et al., 2019). The GH produced mainly by the pituitary gland (Reinecke et al., 2005). In our study, the low expression of GH in liver of large fish may be compensated by expression in other organs in the body. Also, GH may also act directly on target tissues like skeletal muscle to stimulate the production of IGF-1, which sequentially can act in a paracrine/autocrine way to stimulate tissue growth (Chauvigné et al., 2003).
GHR1 gene expression was found throughout the intestine, muscle, liver, ovary, spleen, and kidney but is not found in the tests of adult zebrafish. The liver GHR1 expression was reported in all species of fish (Prinzio et al., 2010). In the present study, the GHR1 gene expression showed more expression in the large body weight fish than the small-group fish. Similarly, Calduch-Giner et al. (2003) observed that, in gilthead sea bream, the levels of hepatic GHR were positively correlated with the body growth rate. Moreover, Huang et al. (2012) compared between fast and slow-growing Nile Tilapia, and they found more GHR gene expression in the fast-growing group than the slow-growing group. Mun et al. (2019) also found that the expression levels of GHR mRNA in the juvenile, red-spotted grouper liver was slightly higher in fast growing group than in moderate and slow-growing groups.
Segers et al. (2012) approved that GHR mRNA levels in large-size egg of mouthbrooding cichlid is more than that its level in small one. While, after hatching the young originated from a small egg had high levels of GHR mRNA levels in the yolk sac more than the young originated from a large egg. So, we could suggest that the high levels of GHR mRNA accelerated the growth rate of fish. Otherwise, Kocmarek et al. (2014) showed that GHR1 in white muscle and liver of the small-size rainbow trout group showed down regulation than the large-size group. In addition, Opazo et al. (2017) observed that no difference in mRNA level of GHR1 expression between the large and small larvae of zebrafish.
No significant difference in IGF-1 gene expression was observed between the large and small body weight fish, and its expression is lower than the control group in our study. Peterson et al. (2004) observed similarity in IGF-1 expression level between faster and slower growing groups of USDA103 channel catfish (Ictalurus punctatus). Similarly, Opazo et al. (2017) reported that IGF-I showed similarity in mRNA levels between the large and small larvae of zebrafish. While Carnevali et al. (2006) reported that the larvae of European sea bass have higher IGF-1 mRNA levels in the large size group more than in the small-size group in response to lactic acid bacteria probiotic. Also, the large body size zebrafish and fast-growing Nile tilapia has increased IGF-1 expression than the control (Amaral and Johnston, 2012; Huang et al., 2012). Prinzio et al. (2010) proved that the liver is the main organ contributing to IGF-I circulating levels in response to GH and observed that, the IGF-1 expressed in the slow-growing group more than its expression in fast and moderate-growing groups by 2.3-fold. However, Kocmarek et al. (2014) found that IGFs were down regulated in the liver and white muscle of small fish compared to large fish in rainbow trout.
In this study, the MyoG expression level showed a significant difference in large and small body weight fish than the control group. The large body weight fish group had more MyoG mRNA levels than the small body weight one. Sengupta, (2014) observed the steady expression of MyoG in different developmental stages of Labeo rohita fish between 6 hours and 12 months. While Chu et al. (2014) observed that MyoG appeared in early embryonic stage of Chinese Mandarin fish. The MyoG presented the highest levels of expression in the brain compared with the kidney, spleen, liver, heart, and white muscles in Chinese Mandarin fish (Chu et al., 2014). The expression level of MyoG in brown trout showed high level in zero days and decreased in developed stages (Churova et al., 2017).
The expression of liver MSTN in Nile tilapia in this study showed a high level in the small body weight fish than its level in the large body weight group. Likewise, in catfish showed increased expression of MSTN in association with a lower growth rate (Weber and Bosworth, 2005). Furthermore, Carnevali et al. (2006) showed that MSTN mRNA level in the small body weight group was more than that level in the large body weight group in the larvae of European sea bass. Furthermore, Biga and Meyer, (2009) found that there was a relation between rapidly growing GH-treated giant danio, and down-regulation of MSTN mRNA level. MSTN mRNA expression in zebrafish in the embryo was less than its expression in adult fish (Xu et al., 2003). Rodgers et al. (2003) found that in larval tilapia, prolonged fasting decreased MSTN mRNA levels and somatic growth. Whereas, fasting in adult’s tilapia does not impact myostatin mRNA levels. While Gabillard et al. (2013) observed that in many fish species muscle growth rate was not unambiguously associated to the level of MSTN mRNA expression.
CONCLUSION
Many SNPs have been detected in GHR1 gene among the large and small body weight Nile tilapia. The two SNPs reported in large body weight can be used for selection to increase body weight in tilapia fish. Moreover, two repeated SNPs were detected among the small body weight fish can be used as a marker-assisted selection for culling of small size fish. The expression profiles of selected genes (GH, GHR1, IGF-1, MyoG, and MSTN) are variable between the small and large body weight fish. The expression of GH and MSTN genes increased in small body weight fish than large body weight. GHR1 and MyoG expression increased in large body weight fish, indicate their important roles for the Nile tilapia growth traits.
SNPs at GHR1 and increased its expression together with the MyoG gene in large size fish proposed them as candidate genes to be more evaluated for efficient growth breeding programs in Nile tilapia.
ACKNOWLEDGMENTS
We are grateful for the members and assistants of the Department of Animal Husbandry and Animal Wealth Development, Faculty of Veterinary Medicine, Alexandria University, Egypt, for providing the necessary facilities to achieve the present study.
CONFLICT OF INTEREST
There is no conflict of interest.
AUTHORS CONTRIBUTIONS
All authors contributed equally at study design, sampling, methodology, interpretation of results, and writing of the manuscript.
REFERENCES


