Advances in Animal and Veterinary Sciences
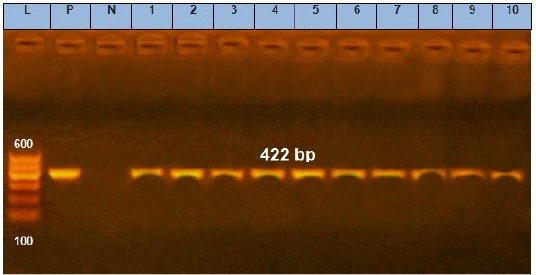
Agarose gel electrophoresis showing amplification of 422 bp fragments of avrA gene.
Lane (1 to 10) shows the positive amplification of ten representing isolates. L: Ladder (100-600). P: Positive control and N: Negative control.
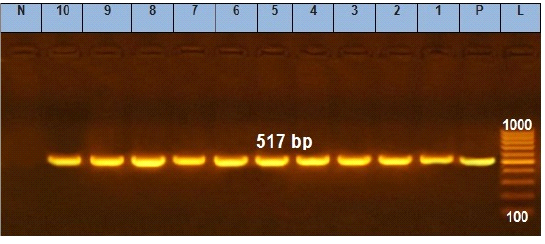
Agarose gel electrophoresis showing amplification of 517 bp fragments of sopB gene.
Lane (1 to 10) shows the positive amplification of ten representing isolates. L: Ladder (100-1000). P: Positive control and N: Negative control.
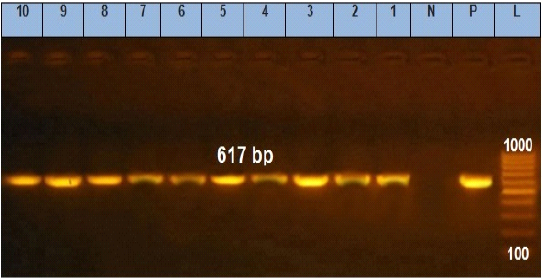
Agarose gel electrophoresis showing amplification of 617 bp fragments of stn gene.
Lane (1 to 10) shows the positive amplification of ten representing isolates. L: Ladder (100-1000). P: Positive control and N: Negative control.
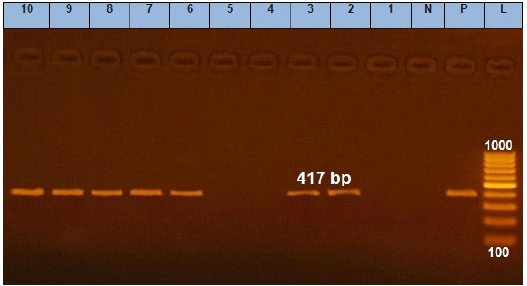
Agarose gel electrophoresis showing amplification of 417 bp fragments of qnrS gene.
Lane (1 to 10) shows the amplification result of ten representing isolates. L: Ladder (100-1000). P: Positive control and N: Negative control.
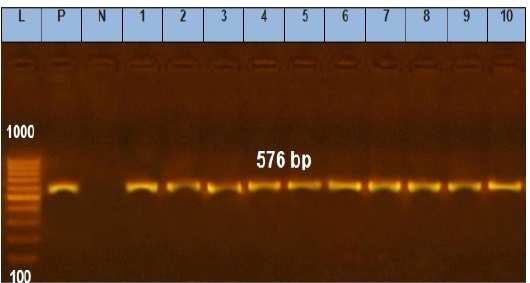
Agarose gel electrophoresis showing amplification of 576 bp fragments of tetA(A) gene.
Lane (1 to 10) shows the positive amplification of ten representing isolates. L: Ladder (100-1000). P: Positive control and N: Negative control.
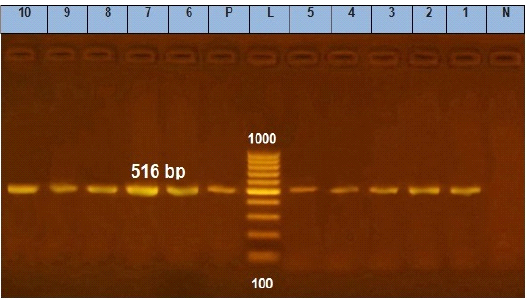
Agarose gel electrophoresis showing amplification of 516 bp fragments of blaTEM gene.
Lane (1 to 10) shows the positive amplification of ten representing isolates. L: Ladder (100-1000). P: Positive control and N: Negative control.


