Advances in Animal and Veterinary Sciences
Research Article

Evaluate the Metabolism Responses of Cultured Paddlefish, Polyodon Spathula (Walbaum, 1792), Towards Some Ecological Stressors in the Volga-Caspian Basin using Fuzzy Modeling Control
Mahmoud A. Elnakeeb1, Lydia M. Vasilyeva1, Natalia V. Sudakova1, Adelya Z. Anokhina1, Ahmed G. A. Gewida2, Mahmoud Alagawany3, Mohammed A. E. Naiel4 *
1Biotechnology, Zoology and Aquaculture Department, Faculty of Biology, Astrakhan State University, Astrakhan, Russia; 2Department of Animal Production, Faculty of Agriculture, Al-Azhar University, Cairo, Egypt; 3Department of Poultry, Faculty of Agriculture, Zagazig University, Zagazig, 44511, Egypt; 4Department of Animal Production, Faculty of Agriculture, Zagazig University, Zagazig 44511, Egypt.
Abstract | The American paddlefish (Polyodon spathula) is one of the most valuable native fish in the united states, china, and several Eastern European countries. Sustainable paddlefish production at a commercial scale is essential for caviar and meat production but requires maintaining high water quality throughout the rearing period. The present study analyzes the paddlefish’ biological and physical Caspian environmental data using fuzzy logic control methodology from non-traditional analysis to deliver detailed insight into critical factors that affect the aquatic ecosystems. For this hypothesis, there was one governate station (the Caspian Fisheries Research Institute), including twelve earthen ponds with 850 kg fish per hectare in this study. The fuzzy inference system was performed to predictable solutions for output data (metabolic rate), influencing the selected factors (temperature, dissolved oxygen, pH and oxygen uptake) involved in the system. Through prediction and simulation, each input factor was determined during the breeding season (seven months). Water quality parameters involved in the variation in the paddlefish rearing conditions were classified into four groups, including temperature, pH and dissolved oxygen, along with oxygen consumption. For each rearing condition, a separate fuzzy inference system was defined and the output of each fuzzy system was named F1, F2, F3, F4 and F5. Finally, F1 and F2 were identified as the inputs to a fuzzy model to evaluate the relation between the metabolic rate index’s and environmental factors. The results indicated that the decline in the paddlefish metabolic rate rearing index was correlated with the water temperature and dissolved oxygen percentage during the breeding season. In conclusion, improving oxygen flowing and optimum water temperature could reduce environmental stress and improve paddlefish production in this system during the breeding season.
Keywords | Aquatic environment, Fuzzy logic control, Paddlefish, Prediction, Simulation.
Received | February 11, 2021; Accepted | February 25, 2021; Published | April 01, 2021
*Correspondence | Mohammed A E Naiel, Department of Animal Production, Faculty of Agriculture, Zagazig University, Zagazig 44511, Egypt; Email: mohammednaiel.1984@gmail.com
Citation | Elnakeeb MA, Vasilyeva LM, Sudakova NV, Aokhina AZ, Gewida AGA, Alagawany M, Naiel MAE (2021). Evaluate the metabolism responses of cultured paddlefish, polyodon spathula (walbaum, 1792), towards some ecological stressors in the volga-caspian basin using fuzzy modeling control. Adv. Anim. Vet. Sci. 9(6): 773-786.
DOI | http://dx.doi.org/10.17582/journal.aavs/2021/9.6.773.786
ISSN (Online) | 2307-8316; ISSN (Print) | 2309-3331
Copyright © 2021 Naiel et al. This is an open access article distributed under the Creative Commons Attribution License, which permits unrestricted use, distribution, and reproduction in any medium, provided the original work is properly cited.
Introduction
Aquaculture farmers are concerned with achieving the highest growth rates regardless of the condition of water quality; therefore, the farms set up in areas with unsuitable water parameters have been under-performing in production and are thus unsustainable (Stewart et al., 2013). Furthermore, anthropogenic actions have led to the degradation of freshwater habitats and the concomitant depletion of fish populations (Closs et al., 2015; Gordon et al., 2018). Recently, the Food and Agriculture Organization of the United Nations (FAO) revealed that paddlefish breeding stocks’ exploitation is one of the most discussed issues in terms of threats to paddlefish cultivation, as described by Holčík (2006). In the last century, the promotion of paddlefish farming through high-quality roe production is a new objective in several Eastern European countries (Hanel et al., 2011). Paddlefish (Polyodon spathula) was first introduced in the Russian Federation (formerly the Soviet Union) in 1974, primarily because of its rearing potential in ponds with high organic fertility and within large reservoirs in the South (Jarić et al., 2019).
The paddlefish is mainly farmed to produce roe in the Russian Volga River, especially in the Krasnodar, Volga–Caspian basin and Saratov regions (Lobchenko et al., 2002; Kottelat and Freyhof, 2007; Ermolin and Svolkinas, 2018). However, aquaculture activities are concentrated in Astrakhan, which is under the Caspian Fisheries Research Institute (CaspNIRKh) (Elvira, 2001; Lenhardt et al., 2006). Increasing demands emanating from the EU markets for paddlefish caviar has stimulated farming (Mims and Shelton, 2015).
The Russian Federation survey indicated that paddlefish roe production is expected to remain stable, with an increasing annual potential of approximately 5% –10% (Jarić et al., 2019). Fish farming ecosystems are an assemblage of controlled parameters aiming at providing the most favorable conditions for culture, thus seeking at best and sustainable fish growth. Among these parameters, aquatic stressors can be identified, resulting from environmental factors and internal, biological stressors, and specifically on metabolic rate (Closs et al., 2015; Côté et al., 2016). Major environmental stressors influence the performance and metabolic rates of cultured paddlefish and other freshwater fish species (Naiel et al 2020a; Naiel et al 2020c). These factors are probably determined and driven by events caused by the interactions among internal and external environmental factors in an aquatic ecosystem, including different types of biological stressors, e.g., metabolic rate as described by Hubenova et al. (2007). The physical parameters (i.e., temperature, dissolved oxygen, pH) considering as agents of the farming medium that need to be monitored, and its turn into stressors once the agent moves into a range that causes harm to the fish performance (Khafaga et al., 2020; Naiel et al., 2020b). Therefore, the management of the various environmental parameters in which the fish is reared are performing via two steps: The first step is to understand what is the range (optimum range) of each parameter in which the fish survive best; followed by the interactions between these parameters (Vasilyeva and Elnakeeb, 2019). The most important factors, their fluctuations with time, need to be monitored, by adequate means, by manual data collection or automated ones and fed into a control system to advise on corrective action to be taken (Mazur and Curtis, 2006).
Models’ construction takes in the parameters, their range of variation, the interactions between parameters, and their effects on fish’s vital performances (growth, feeding rate, behavior, etc.) are of great value. (Lange et al., 2018). Also, information on the optimum range of the physical and chemical parameters to paddlefish culturing is scarce and inconsistent in the Russian Federation and requires a researcher’s insights and efforts. Using fuzzy logic controller modeling with the relevance of controlling systems for analyzing biological data is a worth concept (Navas et al., 2011). In an attempt to reduce overall stressor effects on paddlefish behaviour in traditional farming systems, one of 16 environmental models was considered by the European Commission’s Ecosystem Approach to Sustainable Aquaculture (Brigolin et al., 2008).
Moreover, a few studies have focused on tracing biological modeling patterns and development to simulate and predict environmental stress. Besides, rare studies have focused on controlling pressure factors in open ecosystems because of some fish behavior’s unpredictability in response to environmental fluctuations in coastal areas (Mimura 2013). Fuzzy logic formalism is appropriate to address complex ecological issues’ volatility and rationality (Alamdar et al., 2010). The previous literature results specified that the fuzzy inference system ability fastly and correctly predicts the relationship between water quality parameters as stress factors and fish production. The vital goal of organic aquaculture producers was to prevent the harmful effects of unsuitable environmental effects on fish performance (Luna et al., 2019). Hence, water quality parameters in any aquaculture system indicate the aquatic rearing condition (Ayyat et al., 2020; Naiel et al., 2020b). Water quality alertness can afford awareness to avoid possible risks, such as high mortality rates, controlling diseases, and regulating the production situation without any additional cost. The present study aimed to develop a rearing index for paddlefish based on the effect of the water quality essential parameters, including temperature, pH, dissolved oxygen, consuming oxygen, and the relation between these parameters and metabolic status based on a fuzzy inference system. Developing such a vital and widespread rearing index for improving water quality awareness is respected as a novelty in organic aquaculture, directly helping farmers manage and control aquatic systems successfully. Therefore, they can avoid high losses and treatment costs through timely actions.
RESULTS and DISCUSSION
Metabolic Rate Indicators
Paddlefish metabolic rates were strongly affected by variability in water variables due to the geographic area (Mims and Shelton, 2015; Vasilyeva and Elnakeeb, 2019), especially at the beginning and end of the growing season (i.e., April and October, respectively) west of the Astrakhan region. Environmental temperature and feeding rate are essential metabolic regulating features (Patterson et al., 2013). Comparing the metabolic rate of paddlefish over seven months provides us with comprehensive knowledge of growth performance during the rearing period (Closs et al., 2015; Côté et al., 2016). It is highly facilitated by using regression equation for consumed oxygen, which has been dependent on body weight, water temperature, and dissolved oxygen.
Regression Equation for Oxygen Uptake
In paddlefish, such as all poikilothermic organisms, metabolism is affected by temperature (Katunin, 1986; Hubenova et al., 2007). However, oxygen uptake (mg/h/kg) and dissolved oxygen (DO, ppm, mg/L) are closely attached to the temperature effect, but not only. It is also dependent on many other factors, inter alias the release of oxygen in water, thus directly affecting growth. Smaller paddlefish have a higher metabolic rate than larger paddlefish (Patterson et al., 2013). The regression equation for oxygen uptake between 10 and 29°C is as follows:
Y= 7.66 (t) 0.979 × (M) 0.918
Oxygen uptake was calculated for each temperature (t) and Weight gain (M); it is calculated by the difference between the initial (Wi) and the final body weight (Wf) to prepare the fourth stress factor for introduction into the statistical analysis and modeling system.
Statistical Analysis
In line with previous results by Mims and Shelton, (2015); Patterson et al. (2013), statistical analysis was performed for temperature, DO, pH, and oxygen uptake to express the metabolic rate output as a farming season (7 months). In this context, a statistical model was constructed to analyze the variance, correlation, and regression between the four variables during the breeding season. Data were taken every two days, summarized and prepared to be entered into the model.
Standardized Coefficients and Regression Coefficient
ANOVA was tested with a confidence interval (95%) and tolerance (0.0001) using the least-square means. After calculating the extracted value of the fuzzy logic control output’s metabolic rates, the metabolic rate dataset was introduced as a 5th variable to identify an interaction between all stress factors over the breeding season months.
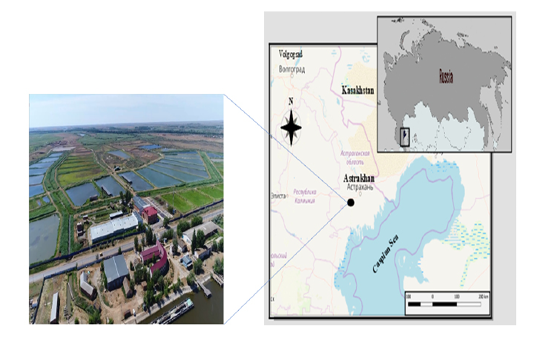
Figure 1: Map of Scientific and Experimental Base of (Caspnirkh) Fsbb – (Bios) Center. Astrakhan, Southern Russian Federation. Http://Www.kaspnirh.ru
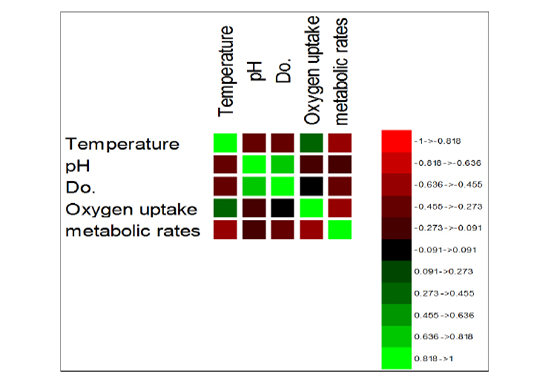
Figure 2: Image of the correlation matrix.
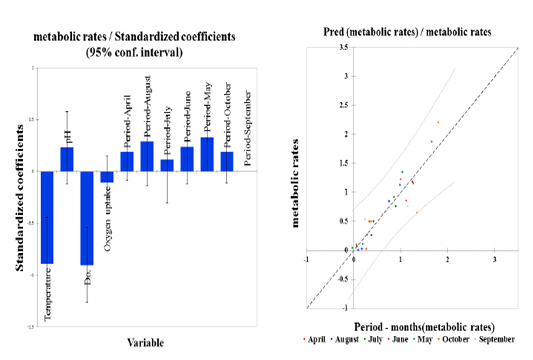
Figure 3: Standardized coefficients (Metabolic rate & stress factors, variables) for season period-months expressed as a change in the degrees of standard deviations between four variables and the predictor (Pred, seasonal period-months to metabolic rates) with a confidence interval (95%).
Table 1: The ranges of the water physical (temperature, dissolved oxygen, pH) and chemical (Oxygen uptake) parameters, and desirable and acceptable scales on the paddlefish weight gain.
| Parameters (Dataset) | Desirable Ranges | Acceptable Ranges |
| Temp. (°C) | 22±0.2 - 28±0.5 | 31.5±0.1- 29.5±0.2 |
|
DO (mg/L). |
5.2 – 10.1 | 4.15 - 10.1 |
| pH. | 7.7 – 8.8 | 5.7- 9.4 |
|
Oxygen uptake (mg/h/Kg). |
80 - 200 | 47.1 - 119.5 |
| WG (g) | ||
| IW (g) | 300 | -- |
| FW (g) | -- |
1700 |
Temp, temperature; DO, Dissolved oxygen; WG, Weight gain (g) = IW-FW; while, IW, Initial Weight; FW, Final Weight.
Table 2: The effects of water quality measurements (temperature, DO, pH, and oxygen uptake) on the cultured paddlefish oxygen uptake (%) and metabolic rate (M.R; %) during farming season (7 months).
| Measurement | Breeding season (month) | SD | R² | P value | ||||||
| April | May | June | July | August | September | October | ||||
| Temp. (ºC) |
19.4bc |
22.2abc |
23.7ab |
26.1a |
25.9a |
18.8bc |
17.1c |
3.99 | 0.710 | <0.001 |
| pH | 7.56 | 7.47 | 7.18 | 7.12 | 6.59 | 7.52 | 8.27 | 0.84 | 0.331 | 0.163 |
| Do (ppm) |
7.68a |
7.23a |
5.48b |
4.67c |
5.29b |
7.34a |
8.46a |
2.05 | 0.432 | 0.045 |
| Oxygen uptake (%) |
87.73b |
79.16c |
77.43d |
89.97b |
92.36a |
79.96c |
78.32d |
2.59 | 0.082 | 0.024 |
| M.R. |
0.73b |
0.72b |
0.78ab |
0.45d |
0.50d |
0.61c |
0.96a |
0.56 | 0.086 |
0.013 |
Temp, temperature; DO, dissolved oxygen; MR, metabolic rate. All data were presented as mean ± SD.
R², regression and correlation between measured parameters and season.
aDifferent superscripts a, b and c within the same raw are significantly difference (P< 0.05).
The correlation matrix was used to describe the relationship interaction between variables (Figure 2). Thus far, we have found a high positive correlation between pH and DO. Standardized Coefficients were performed to estimates resulting from a regression analysis. It is expressed initially as a change in the degrees of standard deviations between the dependent variable and the predictor (Pred, seasonal period-months to metabolic rates), as illustrated in Figure 3. However, a significantly higher variance for both temperature and DO was found amongst all parameters (metabolic rate) Pr > F, i.e., Pr<0.0001. Thus, the effect of the variables with high variance could explain the metabolic rates during the seasonal period. Their fluctuations showed a decline in their influence in the period (September). In contrast, the metabolic rate variance increases in summer months, e.g., June and August and the beginning of the cold season in period September-October. Dissolved oxygen coincides with the temperature variable, with the maximum effect on the metabolic rate over a wide range (4 – 10 ppm). On the other hand, they extended the two different variables to interact with the pH and oxygen uptake at the levels (7.5 and 85 mg/h/Kg).
The results of the statistical analysis of the stress factors per season are shown in Table 2. The correlation matrix, ANOVA, and regression equation, which links variables with each other, were derived into one formula to display the output of the metabolic rate as a function of the farming season (7 months), as a statistical investigation model. The regression equation of the model (metabolic rates/ season period) is as follows:
Y = 3.86 - 0.13* X1 + 0.15* X4 - 0.25* X2 - 0.25 - 03* X3 + 0.29*Period-April + 0.45*Period-August + 0.18*Period-July + 0.37*Period-June + 0.52*Period-May + 0.29*Period-October.
Where metabolic rate (Y); temperature (X1); dissolved oxygen (X2); oxygen uptake (X3); pH (X4); and ‘Period-Month’ stands for obtained data a mean of a month during season period. The September period does not fall within the regression equation due to a lack of power to influence the equation; thus, it was excluded.
Standardized Coefficients
Estimates resulting from regression analysis of stress variables were standardized to eliminate factor variability. Therefore, standardized coefficient results refer to how the stress parameters will differ per standard deviation. For simple linear regression following orthogonal predictors, the standardized regression coefficient corresponds to the correlation between all stress variables. As a result, given the R-squared, 8% or 0.086 of the dependent variable Y variability is explained by the explanatory variable. Given the p-value of the F statistic computed in ANOVA (Table 2) and given the significant level of 5% (95% conf. interval), the information brought by the explanatory variables over the seasonal period is highly substantial in October (0.964).
In an attempted recovery trial, it was found that the biological rhythm of the process of preparations for wintering, such as high metabolic rates, were lesser than those observed in the remaining months. While, we did not find any effect in September, as illustrated in Figure 3. This result was reflected when paddlefish transitioned to the hibernation stage in wintering ponds, with a low metabolic rate through decreasing optimal water quality and increasing stress factor ranges, as described by (Vasilyeva and Elnakeeb, 2019).
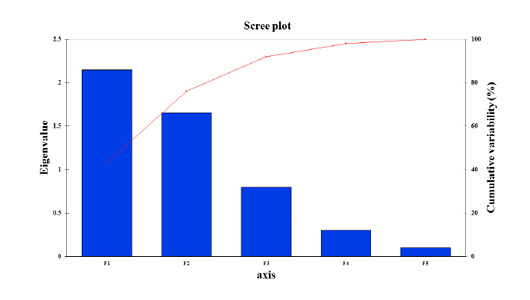
Figure 4: Scree plot of principal component analysis of paddlefish stress factors with the response (Metabolic rates) over the season period between eigenvalue and principal components or factors. The Scree plot illustrates the high percentage of cumulative variance associated with each PC or F obtained by drawing a graph between eigenvalues and factor numbers for the scaling of the x and y-axes.
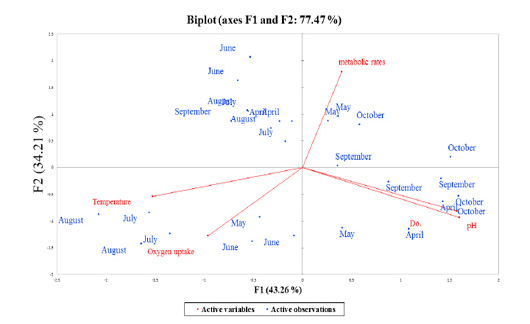
Figure 5: Overall principles component analysis (PCA) bi-plot of scores and loading for the contribution of the active observations (7-months period represented as blue-points) to the parameters (red-color coded to their active variables), collected during production season 2018, the period from April to October.
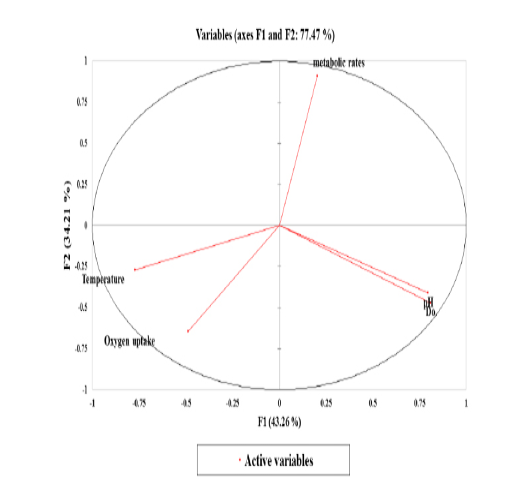
Figure 6: The correlation circle or variables chart shows the correlations between the Principal Components (PCs; PC1 and PC2) and the variables.
Principal Component Analysis (PCA)
Stressors associated with multivariate plant strategies were evaluated, and an analysis of the paddlefish stress factors and response effect on metabolic rate performed by principal component analysis (PCA) revealed that 77.47% of the variance was explained by the two main factors F1 and F2 or PC1 and PC2 (Figure 6).
Data inputs did not have any missing trait values. Subsequently, it was analyzed with a correlation matrix (Spearman) and regression analyses. Values in bold are different from 0 with a significance level of alpha=0.95. Then, the dataset was prepared to enter into the XLSTAT® program. First, eigenvalue scores were calculated depending on variability (%) and cumulative value (%), as shown in Tables 3 and 4. Eigenvalues play an essential role in building eigenvectors based on two principal vector scores: F1 (variability accounted for 43.26%) and F2 (variability accounted for 34.21%) of the remaining variance as a total factor plane (F1 and F2: 77.47%). Then, factor loading gradually increased from the highest eigenvalues to the lowest (Figures 4 and 5, Table 3).
Correlations between variables and factors were conducted to determine which active variable must be selected for axes rotation. All vectors (five vectors) were chosen to resemble axes rotation generally. The eigenvectors result showed PCA-analysis was strongly related to the stress factors axes in the positive transformation of two by two between pH and DO. However, there was a negative axes rotation for both temperature and oxygen uptake. The projection of variable scores onto the PC1-PC2 plane depict-
Table 3: Principles Component Analysis (PCA) by Eigenvalues. Two principal components (PCs, PC1 and PC2) were selected to describe cumulative variance 77.47% of the parameters contribution. All values in bold correspond for each selectable factors scores loading.
| PCA analysis | Factors | ||||
| F1 | F2 | F3 | F4 | F5 | |
| Eigenvalue |
2.16a |
1.71b |
0.649 | 0.274 | 0.203 |
| Variability (%) |
43.25a |
34.21b |
12.98 | 5.49 | 4.06 |
| Cumulative % |
43.25a |
77.46b |
90.45 | 95.94 | 100 |
| Stress factors | |||||
| Temperature | -0.525 | -0.207 | -0.648 | 0.229 | 0.457 |
| pH |
0.541* |
-0.315 | -0.314 | 0.651 | -0.293 |
| DO |
0.550* |
-0.361 | 0.051 | -0.297 | 0.690 |
| Oxygen uptake | -0.331 |
-0.494* |
0.671 | 0.420 | 0.136 |
| Metabolic rates | 0.138 |
0.695* |
0.169 | 0.509 |
0.459 |
aValues in bold correspond for each selectable factors scores loading.
aThe first principal component (PC1 or F1) is the combination of variables explaining the greatest amount of variation accounted 43.256 % variability with eigenvalue 2.163.
b The second principal component (PC2 or F2) considered the second largest amount of variations accounted 34.210 % variability with eigenvalue 1.710.
Table 4: The linguistic terms of the Fuzzy inference system (FIS) derived from the various stress factor ranges (Tune fuzzy membership functions, MFs, FIS-Mamdani).
| Stress Parameters | LINGUISTICS TERM (Input / Value) | |||
| L | M | H | R | |
| Crisp input | ||||
| Temp (°C) | 6 – 21 | 21 – 29 | 29 – 37 |
6 – 37 |
| DO (ppm) | 2 – 4 | 4 - 8 | 8 - 11 | 2 - 11 |
| pH | 1 - 4 | 4 - 10 | 10 - 13 | 1 - 13 |
| Oxygen uptake (mg/h/Kg) | 40 – 70 | 70 – 90 | 90 - 120 | 40 - 120 |
| Crisp output | ||||
| Metabolic-Rates (%). | 1 – 60 | 60 – 90 | 90 - 221 |
1 - 221 |
Temp, temperature; DO, Dissolved oxygen, L, Low; M, moderate; H, high; R, range.
ed each observation, and measurements for all factors over the seasonal period were found as a discrete cloud of points with minimal overlap between them (Figures 5 and 6).
Biplot-PCA demonstrated the distribution of the active observations (Month-period, represented as blue-points) on each multivariate parameter complexity (red-color coded to their active variables), were collected during production season 2018, period from April to October, as illustrated in Figure 5. The PCA red-axes were interpreted as gradients of overall record complexity (Meffe and Sheldon, 1988). The results revealed a high correlation between the seasonal period and levels of stress parameters that ranged from a positive relationship in certain months (i.e., May and October). For the first time, it was observed that metabolic rate was affected in September, whereas one-way ANOVA and regression coefficients could not detect any influence in September.
Factor scores were calculated by loadings associated with variables on PC1 and PC2, and they were consistently positive and negative with the same magnitudes (Table 4, Factors 1 and 2). Finally, we can identify the squared cosines of the variables that were significant for F1 (temperature, pH and DO) and F2 (oxygen uptake).
Modeling and Development of Fuzzy Logic System (FLS)
According to the ranges for the paddlefish culture’s stress condition factors, one can predict the percentage of metabolic rate (Table 5). Our system’s main objective is fuzzy-based logic modelling for analysing biological and physical data for the growth of the Caspian paddlefish and proposes a predictable solution for output data. Therefore, stress factors such as temperature, dissolved oxygen, pH, and oxygen uptake scale should be adjusted accordingly. If the crisp input variables are not acceptable for season
Table 5: Fuzzy logic rule base input and output effect on paddlefish metabolic rates.
| Rule base No. | Input effect | Output effect | ||||
| IF | AND | THEN | ||||
| Temp (°C). | pH | DO | Oxygen uptake | M.R. | SCORE | |
| 1 |
L |
M |
H |
H |
H |
|
| 10 | 7 | 7 | 80 | 175 | 175% | |
| 2 | M | M | M | H |
H |
|
| 21.68 | 7.555 | 6.665 | 81 | 239 | 239% | |
| 81 | L | M | L | M | L | |
| 14 | 7 | 3.15 | 47.08 | 6.2 | 6.2% | |
Temp, temperature; DO, Dissolved oxygen; MR, metabolic rate; L, Low; M, moderate; H, high; R, range.
al paddlefish production, then that input variable must be replaced. Therefore, the reliability of the variables was verified through previous statistical analyses. We carried out a fuzzy logic system subject to successive steps, as in reading codes using the MATLAB program. First, the transformation crisp input dataset was used throughout linguistic representations. There were three membership functions (𝑛mf) for each factor (𝑛𝑖𝑛𝑝𝑢𝑡𝑠), i.e., low, moderate, and high. Each of these stress factors had a different range (numerical data). The type of membership function selected was triangular. Metabolic rate output action was subsequently expressed into three triangular membership functions, i.e., low, normal, and high. Then, the membership function rules (MFRs) for FIS Mamdani were constructed by the following equations:
R (variables) = (𝑛mf) 𝑛𝑖𝑛𝑝𝑢𝑡𝑠
R = (3)4 = 81
Fuzzification was established by converting the numerical data to linguistic variables considered to a Sugeno MF by assessing the biological ground of the relationship between the variables in the natural aquatic environmental scales. For each stress factor input, the linguistic MFR consists of three sections. ‘IF (antecedence); AND; THEN (consequence)’ parameters interpretation interface (fuzzy controller) associated with the results of accompanying metabolic rates calculated across the fuzzy logic system (shown in Table 5).
The adaptive neuro-fuzzy inference system (ANFIS) model structure to define the input stress factors and outputs. The membership function rules were constructed (Figure 7). 81 rules were created to assess three linguistic terms, i.e., low, moderate, and high, which typically originate from each different aquatic stress factor to hold a non-fuzzy dataset (81-membership function rules) of four stress factors.
The rule base is a simple (IF-And-THEN) condition with linguistic terms (4×81 fuzzy interaction pathways among initiated and terminated MFR). The results obtained represent the inference crisp output non-fuzzy dataset (81 numerical data output) of paddlefish metabolic rates. The membership rules involved in the model structure of ANFIS mapping provide interaction pathways among initiated input stress factors to be affected and transmuted between 81 neural network nodes that are emitted from the four inputs up to termination in the metabolic rates node before all ending nodes are aggregated into the final crisp output, as shown in Figure 7.
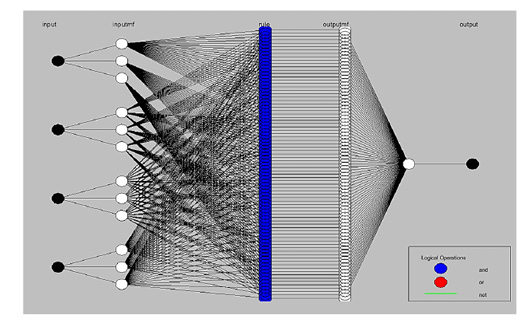
Figure 7: Model structure of Adaptive Neuro-Fuzzy Inference System (ANFIS) designer. ANFIS can be formed by white nodes, which typically originate from each different aquatic stress factor (black nodes), using three linguistic words. This mapping properly provides interaction pathways among initiated input factors to affected and transmuted between (81- membership function rules) in neural network blue nodes emitted from four inputs up to terminate in metabolic rate black node, before that is all ending nodes aggregate into final output crisp.
Prediction
Prediction of crisp data is easy to collect manually via moving the vertical axis for each of the four variables located within their linguistic ranges. The results demonstrated fluctuation in the range of each input parameter on the output dataset values expressed in metabolic rates.
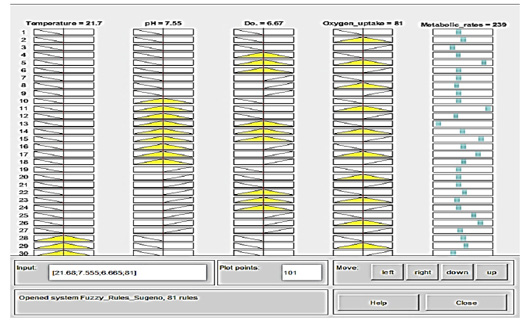
Figure 8: Prediction of Crisp data is collected manually via moving the vertical red-axis for each variable of 4 variables within linguistic ranges (yellow-color), displaying the effect of deflection on the output dataset values (blue-color) expressed in metabolic rates. Membership function rule viewer in a fuzzy logic system from the left-to-right side: If temperature 21.7 °C; pH 7.55; dissolve oxygen 6.67; oxygen uptake 81, then the metabolic rate will be 239 that means is very high.
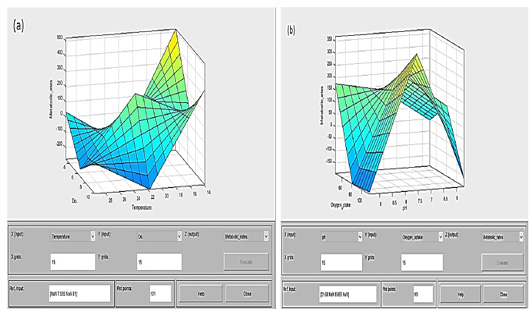
Figure 9: Surface 3D-graph can examine by degrees of colors and values for output surface (metabolic rate, yellow low-values to green high-values) of a fuzzy inference system (FIS) for two inputs parameters (4 stress factors, dark blue low-values to light green high-values). (a) Surface viewers conclude that the metabolic rate percentage increased from 300 to 500, when the dissolved oxygen (dependent variable) decreases to 4 ppm, and temperature (independent variable) reduced below 25 °C to reach at 14 °C when it goes up this considerable percentage. (b) The metabolic rate percentage increases substantially when oxygen uptake (dependent variable) increases up to 100 mg/h/Kg, and pH (independent variable) holds an average value of about 7.5.
The strength of the analysis is reflected in the acceptance of the logical rules that the researchers constructed based on the biological knowledge of paddlefish and the conditions of their farming in different environments. In line with the obtained results of statistical analyses, the correlation of the temperature and dissolved oxygen changes was present as an inverse relationship and significantly affected the metabolic rate. Each row of images represented one rule numbered from one to 81. A column of plots allocates an input variable on the left side with a yellow color and an output variable on the other side with a blue color. Figure 8 shows that if the temperature is 21.7°C, the mean temperature is moderate; if pH=7.55, the mean pH is moderate; and if the dissolved oxygen=6.67, the mean DO is high. If the oxygen uptake is 81 mg/h/Kg, which is mild, then the metabolic rate will be 239, which is very high. The data forms obtained from prediction analysis were shown in the simulation system involving an Adaptive Neuro-Fuzzy Inference System (ANFIS).
Simulation
Training and checking the fuzzified output of the fuzzifier were carried out as the last steps of FLS during the simulation technique. The metabolic rate crisp outputs from Mamdani-MFs must be converted to the Sugeno function file shaped data.fis to be transformed into the ANFIS window, as mentioned earlier in methodology, MFs rules in the output of the fuzzifier dataset involve converting of a Mamdani into a Sugeno system to overcome the nonlinear changes in the input values. The training numerical dataset file is data.dat. As required for processing (plant), ANFIS involved five columns consisting of 4 input stress factors and one metabolic rate. It was necessary to generate FIS for on neuro-fuzzy map (Figure 7).
The results are represented in the surface viewer among all stress factors that examine the output surface of the FIS (Figure 9).
From the surface, the three-dimensional graph revealed that the metabolic rate percentage increased when the temperature as an independent variable was below 22°C with two levels; the first level occurred when the temperature was low with the start of the season in October, access to the winter season. Moreover, the other class was when the temperature was moderate in May due to the rise of the metabolic rate due to the relative stability in the rest of the stressors. In contrast, the metabolic rate decreases with the end of the season or the cold season’s beginning. Dissolved oxygen coincides with the temperature variable, with the maximum effect on the metabolic rate over a wide range (4 – 10 ppm). On the other hand, the two other variables’ results as an interaction with the pH and with oxygen uptake at the levels (7.5 and 85 mg/h/Kg). Surface 3D graphs perform a vital function as a powerful tool, and the results confirm the relationships between the four variables are associated with paddlefish metabolic rates.
.
METHODOLOGY
The system and study area
The study area was a fish production farm in the Caspian Fisheries Research Institute (CaspNIRKh) (Fig. 1). The site is located at the GPS coordinates [(46° 4’ 23.9664” N; 47° 43’ 45.1056” E) latitude=46.073324 and longitude=47.729196], west of the Astrakhan region. The farm was located in southern Russia and the water was supplied from the Volga-Caspian river. The twelve earthen pond fish farms follow the polyculture system (paddlefish Polyodon spathula + beluga and Russian sturgeon). The aquaculture system followed extensive poly cultured with an intensity of 850 kg per hectare. Each earthen pond within the system had the size of two hectares. The pools were filled with freshwater obtained from the Volga river water, and the depth of water in them was 2 m. The reared species of fish evaluated in this study were from a native American paddlefish species commonly raised in Russia, aged approximately one year at the end of the breeding season.
Data collection
The water and fish samples were collected from the fishponds every two days from April until the last production season of 2018 (October). The present study employed the physical parameters, such as temperature, pH, and dissolved oxygen of water quality in fuzzy inference systems, to develop a model for assessing paddlefish’ stress rearing conditions. All water physical and chemical were measured three times daily until the end of the studying period. Dissolved oxygen (mg/L) was measured using the Portable multimeter model AZ-8603 with 0.01 precision. The temperature and pH values were measured using the AD-130 Multi-Parameter Splash-Proof pH-ORP-TEMP Portable Meter (ADWA Co. Szeged – Hungary). The body weight samples were taken monthly and calculated as an average of biomass (Initial and Final weights, Kg), as the individual weight increased. The final body weight (Wf) is used to construct a regression equation for oxygen uptake, as recommended by (Mims and Shelton, 2015), between 10 and 29°C using the following equation:
Y= 7.66 (t) 0.979 × (M) 0.918 (1)
where Y = oxygen uptake (mg/h), t = temperature (°C), and M = body weight (kg).
The data were obtained and re-assembled as an average for each parameter. Six hundred and thirty records were selected throughout the cultivation seasons for processing and inclusion within the modeling systems.
Statistical analysis of measurements
The choice of the parameters, the most relevant ones, is always essential to predict the fish’s biological performance based on past data using statistical analysis knowledge, i.e., estimated normality using the Shapiro-Wilk distribution test, calculated the correlation, standardized, and regression coefficients. There were two replicates per parameter for all rearing months. Total records were 28, and one season consisted of seven months. Statistical analyses were carried out by using XLSTAT ® statistical analysis software version 2019.2.1 (XLSTAT, 2019).
Process follow-up began with data preparation and testing of assumptions to validate the hypotheses of normality and homogeneity of variances. Then, we use arithmetic influence diagnostics as a residual value to obtain standardized residuals. The potential of modeling was used to evaluate the highest variability with the dataset interaction. Afterward, variables were re-assembled by eigenvalues and eigenvectors to determine the relationship between different variables, and principal component analysis (PCA) was conducted. However, the fulfillment of the presumed distribution of data is a prerequisite for the implementation of a particular type of control map; in different circumstances, a false explanation of results may occur. A correlation matrix was calculated for the four-stressor variables to examine their interrelationships. Principal component analysis (PCA) using the correlation matrix was conducted on the input dataset variables to partition the dataset into several composite records with vectors with loading variables. The PC axes were interpreted as gradients of overall record complexity (Meffe and Sheldon, 1988). PCA provides a score for each record on each multivariate parameter complexity axis to reveal itself in the form of individual factors of clusters within the principal component space by the separation of multivariate stressors. We must select F1 and F2 to obtain a high significance. In the correlation matrix (Spearman (n)), bold values are different from 0 with a significance level of alpha=0, 95. Then, the eigenvalues given the highest score and grade from at least four vectors first resulted in high variability (%) and low cumulative values (%). The opposite is true for the following factors. Factor loading on vectors was performed by determining the correlations between variables and factors. The augmentation of the parameter (%) and squared coined coines were conducted to pair each measurement’s values with the element in which the largest squared cosine was selected using the Construct biplot distribution method.
Statistical analysis was performed for temperature, DO, pH, and oxygen uptake to express the metabolic rate output as a function of the farming season (7 months). In this context, a statistical model was constructed to analyze the variance, correlation, and regression between the four variables during the breeding season. Data were taken every two days, summarized and prepared to be entered into the model.
The correlation matrix, ANOVA, and regression equation, which links variables with each other, were derived into one formula to show the output of the metabolic rate as a function of the farming season (7 months), as a statistical investigation model. The regression equation of the model (metabolic rates/ season period) is as follows:
Y = 3.86 - 0.13* X1 + 0.15* X4 - 0.25* X2 - 0.25 - 03* X3 + 0.29*Period-April + 0.45*Period-August + 0.18*Period-July + 0.37*Period-June + 0.52*Period-May + 0.29*Period-October.
Where metabolic rate (Y); temperature (X1); dissolved oxygen (X2); oxygen uptake (X3); pH (X4); and ‘Period-Month’ stands for obtained data a mean of a month during season period. The September period does not fall within the regression equation due to a lack of power to influence the equation; thus, it was excluded. The analysis of varainace P-value with a significance level of 5% was used to compare the information brought by the explanatory variables for the least-squares means (LS means) to determine the desirable ranges.
Parameter identification and measurement
The aquatic physical, chemical and biological parameters move into values beyond the optimum range in the Caspian Basin and Volga Delta change frequently. Under these circumstances, the parameters convert into stressors regardless of whether they occur under periodic rhythms or not. This change leads to the deterioration of paddlefish vitality, affecting the rate of metabolism, and ultimately weight loss during the breeding season. Numerous studies have explained the consequent decline of metabolic rates (e.g., Katunin, 1986; Hubenova et al., 2007). Then, as time passed, the fish responds to fluctuations of the parameters and adapts its response to these variations within the optimum range and outside it. Paddlefish farming stocks are menaced as the production be dwindling because of two main restrictions; water quality management and parasitic diseases such as P. hydriforme in Russia (Raikova, 1994). Therefore, restoring paddlefish stocks to begin the production process is the Russian government’s target objective. The first step is to collect the BIOS Center’s farming constraints (e.g., temperature fluctuations, dissolved oxygen and pH). Most of the global caviar has obtained from Acipenseridae especially indigenous sturgeon (Huso huso) of the Caspian Sea, under controlling Russia and the other four countries. In the last century, turbulence of sturgeon fishery management and destruction their habitat in Russia was observed.
Consequently, Soviet scientists proposed introducing the paddlefish to Russia intended for aquaculture to increase the availability of Russian caviar (Mims and Shelton, 2015). The parameters are divided mainly into what is desirable they are not measured and what has been measured; limited information exists and has been broadcasted mostly via pond research studies. Dissolved oxygen should be maintained at a volume of more than 50% (i.e., 5.0–3.5 mg/L at 13–28°C; pH 6–8), as described by Mims and Shelton, 2015. This level is generally considered necessary for paddlefish classified as high metabolic rates by maintaining metabolic rates in the upper range of the optimum. Data were collected amongst the last farming season records in 2018 and included temperature, dissolved oxygen, pH, and body weight. The previous physical parameters were used to estimate oxygen consumption and evaluate the metabolic rates of fish, reflect the efficiency of productivity during the rearing season. The records of temperature, dissolved oxygen and pH indicate that these parameters are outside the optimum range for the fish at the beginning of the winter, i.e., in October. Also, during the hottest months of the year, i.e., in July and August. As outlined above, paddlefish aquaculture’s main challenges in Russia relate to previous restrictions, limiting the provision of the most admirable circumstance for the farming. Table 1 shows the ranges of the water parameter and the influence of desirable and acceptable scales on the paddlefish weight gain. In addition to “linguistic terms”, which are defined as expressions for the input variables, that are classified into three ranges (Low, Moderate and High), as mentioned in Table 5.
The metabolic rate is directly related to temperature and oxygen uptake (Lefevre et al., 2016), affecting growth. The high temperatures reduce dissolved oxygen in water, which decreases metabolism, under these conditions, The optimum growth temperature is 16–18°C at Mississippi–Missouri fish farms in the united states (Barton et al., 1998). In contrast, the American paddlefish’ habitats in southern Russia, under higher temperatures condition 22–28°C and oxygen consumption, found the feeding rate was increased and led to high metabolism (Mims and Shelton, 2015). Oxygen consumption is also related to size and temperature; smaller paddlefish have a higher metabolic rate than larger paddlefish (Patterson et al., 2013).
Modeling and Development of Fuzzy Logic Systems
Fuzzy logic-based methods and fuzzy logic formalism have been demonstrated as appropriate to address the uncertainty and subjectivity in complex environmental problems (Alamdar et al., 2010; Sylaios et al., 2010). Our proposed modeling system intends to check the conclusions drawn by traditional statistical analysis and control design. To provide a proper representation of systems, this advanced system “fuzzy logic system for paddlefish aquaculture in Astrakhan” takes four stress factors: temperature (T°C), dissolved oxygen (DO), pH and oxygen uptake, as crisp input datasets (raw data), and converts these variables into a single, fuzzified (linguistic variables, as a membership function (MF)) output. Inputs are selected for process control to determine the desired ranges. The fuzzy logic system controls these input stress parameters. It obtains the production output as a percentage of the metabolic rate (crisp output) of fish, reflecting the deflection in all parameters on the metabolic rate of paddlefish. This fuzzy logic system uses the fuzzy toolbox in MATLAB®, and the program has been written in MATLAB® Version 9.4, Release name, R2018a to implement the system.
Measurements of water quality in the current system have been considered stress factors affecting paddlefish farming when they are within harmful ranges. Thus, water quality is an important indication that provides information on metabolic and growth rates, while the fish’s feeding is optimum. Also, the correctness of the methods adopted during pond management. The fuzzy logic controller (FLC) is the main feature of construct controller algorithms in which there is no measurement identification compared with other conventional control systems available for use. Therefore, the foremost insight into using the fuzzy tool to answer the domain fuzzy logic hypothesis of the current study is how water quality (four parameters) can respond indirectly to paddlefish metabolic and growth rates utilizing variable ranges.
The selected inputs have a different range of values, and their unit is one of the power points of fuzzy logic (FL), which can drive multiple types of data and measurements, as described in Table 5. The main parts of the fuzzy logic control scheme and steps are shown below.
Fundamental Components of the Fuzzy Logic Control
Fuzzy logic process requires converting the log data into a quantitative form. It shortens the time needed for engineering development and is appropriate in aquatic systems, particularly if more than two parameters are entered into the system (Gaur et al., 2010). Initially, four inputs were identified (temperature, dissolved oxygen, pH, and oxygen uptake), and only one output was determined, i.e., the percentage of paddlefish metabolic rate. The primary fuzzy logic control system can be divided into two significant steps that are explained below.
The first step is fuzzification by translating the numerical data of the four input parameters to linguistic variables/terms or truth-values to convert the system into crisp inputs based on rule evaluation, i.e., compute output truth-values. The output data are also categorized into three levels. The parameters have no level; they are assigned degrees of membership in three classes as low, moderate, or high. Accordingly, the metabolic rate of the paddlefish is described as low, normal or high. The purpose of fuzzification is to map the inputs from truth dataset to values from 0 to 1 using Mamdani-MF degrees.
The second step concerns the membership functions (MFs, Fuzzy Inference systems-Mamdani) for crisp input ranges of parameters sorted under acceptable ranges, such as those occurring in fishpond conditions. Inputs are applied to a set of (IF-And-THEN) condition control rules with three linguistic representations, e.g., temperature range from 6 to 37°C. If the range is 6 – 21, the temperature is low, then the metabolic rate is also low; if the range is 14 – 29, the temperature is moderate, then the metabolic rate is normal; and if the range is 21–37, the temperature is high, and then the metabolic rate is high. Like the temperature ranges, the dissolved oxygen, pH, and oxygen uptake ranges were also specified for diverse stress factors.
Finally, defuzzification and termination with crisp output, fuzzy Inference systems-Mamdani were conducted to pair the rule strength with the output membership function to get an output distribution. Ultimately, defuzzifying maps the output distribution as a fuzzy set to a crisp set (Numerical data). The fuzzy logic control scheme’s basic configuration consists of four main components: initiated by crisp input; 1) fuzzification; 2) rule base; 3) inference engine; and 4) defuzzification and termination with crisp output.
Crisp input: During the linguistic representations within fuzzy logic, Mamdani fuzzy inference engine is used to create a control system by aggregating a set of input variables data to design fuzzy MF rules. The input range data will be truth-values, not linguistic terms, as it is needed in the original form to act with a minimal error ratio when the fuzzification process prepares the data.
Fuzzification: This is the primary bit in designing a fuzzy controller, which is also named the parameter interpretation interface. In this step, the numerical data are converted to linguistic variables for each input. There are three membership functions (MFs) for each input variable, and all of them have a Sugeno MF (to develop a systematic approach for generating fuzzy rules from a given input-output dataset). Furthermore, MFs rules in output level involve converting a Mamdani into a Sugeno system to overcome nonlinear changes in the input values. The output Sugeno system has constant output MF that conform to the centroids of the Mamdani MF results to be transformed into the ANFIS.
Membership Functions and Rule base: The rules of membership function (MFs) is used in both fuzzification and de-fuzzification stages of fuzzy control to create neural network nodes from the numerical input data set to the fuzzy linguistic terms and vice versa for prediction and simulation the metabolic rate of the paddlefish, whether as a low, normal or high. MF is used to assess a linguistic term. The rule base is a simple (IF-And-THEN) condition with linguistic representations and a conclusion, as shown in Table 5. We calculated and selected membership function rules (MFRs) based on the following formulas:
R (variables) = (𝑛mf) 𝑖𝑛𝑝𝑢𝑡𝑠 (2)
R (mf): IF (X1) is L (F) and… and… IF (X4) is L (F) (3)
THEN Y = K (mf) (4)
where there are four input datasets (variables); rules (R); temperature range (x1); linguistics term (L); linguistics category fuzzy set (F); oxygen uptake (X4); output fuzzification (Y); and the zero-order Sugeno parameter is a polynomial and constant coefficients in the input variables x1…x4 (Kmf).
Fuzzy Set Inference Engine: The estimation of fuzzy rules and the integration of individual rule results are accomplished using toolbox supplies in MATLAB program to predict the influence of the FL system’s stressors. There were 81 inferred control rules for paddlefish metabolic rate control.
Defuzzification: After the inference step, the membership score will be transformed from output linguistic terms or truth-values to crisp numerical data using the centroid method. Since the fuzzy residue output could not be used for more applications, this forcefulness is also expressed as an affinity process.
Crisp output: The values obtained in the output range are a true numerical dataset that can express paddlefish metabolic rate and quickly direct them into the simulation technique, i.e., adaptive neuro-fuzzy inference system (ANFIS).
Prediction of Desirable Data
These different input-set variables are loaded from a dat.file and used to predict the stress factors. Afterward, the crisp data prediction process is conducted following collect manually via moving the membership function rule viewer’s vertical axis in the MATLAB toolbox for each input variable, which is located within their three linguistic ranges, as shown in Figure 8. Before completing the process, the stress factor was controlled. Otherwise, all the measured parameters were transformed then these values are reloaded. The file and the entire process will start over again.
Simulation
The final step starts with saving the training data and verifying it. The training data are stored in a file, in .dat format. Similarly, the checking data file is stored in the .dat form. In the data file, five columns are present in which the first four columns represent the input parameters, and the last column indicates a single output for the training data. In this step, a graph between the dataset index and the output can be observed. This graph predicts the training and checking data that are resulting. With the adaptive neuro-fuzzy inference system (ANFIS) designer’s aid, the membership functions can be constructed by training them with inlet-outlet data into the workspace instead of specifying them manually. The program options use a back diffusion algorithm solo or in combination with the least-squares method and authorize the fuzzy systems to learn from the data. An error occurs between loading and checking data and testing the FIS checking data, which can be viewed in the ANFIS editor window. Simulink explains all processing of our controller systems for paddlefish metabolic rate assessment.
Conclusion
The present study sheds light on the organization of the environmental parameters management. The paddlefish is reared performing via understanding the range (optimum range) of each parameter to the high fish survival rate, followed by the interactions between these parameters during the seasonal period under Russian farming conditions. A comprehensive and updated compilation of statistical analysis combined with modern modeling methods based on the fuzzy logic control system (FLS) was performed by measuring paddlefish metabolic rates in the culture system with the help of previous knowledge based on biological and non-biological data. We have shown that by trial, a rigorous attempt has been made to use fuzzy control methodology to apply the proposed approach and obtain results and conclusions drawn using fuzzy logic modeling. Not all of the conventional statistical analyses have indicated the actual situation we are experiencing. Therefore, modeling techniques and methods can be utilized to predict and control several stressors affecting metabolic rates. Fuzzy logic systems and ANFIS are the most useful tools to clarify a phenomenon not visible by other tools and analyses used to determine the most critical stress factor impacts on ecosystem conditions during the season, as well as to on paddlefish vitality conditions. In this context, to conclude in the future, we need to propagate the modeling and control technique for the rest of the variables affecting all aspects of paddlefish breeding. Notably, in the Caspian region, researchers should use those approaches.
ACKNOWLEDGMENTS
We thank researchers, technicians, and fishers for the production season’s success and the active participation in data and materials collection. We also acknowledge all those who have provided financial support and the guidance we have received from the fish farm sector’s administration to publish this work done. The National Institute of Scientific and Experimental Base (CaspNIRKH) FSBB-(BIOS) Center in the Northern Caspian Region-Astrakhan, Southern Russian Federation, supported current work.
Funding
This research received no specific grant from any funding agency in public, commercial or not-for-profit sectors.
Conflict of Interest
All authors have any type of conflict of interest.
Data Availability Statement
The data that support the findings of this study are available on request from the corresponding author.
Code availability
The program code is available from the corresponding author on request.
Author Contributions
Conceptualization, M.A.E and L.M.V.; methodology, M.A.E. and N.V.S.; data curation, M.A.E. and A.Z.A.; writing—original draft preparation, M.A.E., M.A.E.N and A.G.A.G.; writing—review and editing, A.G.A.G., M.A. and M.A.E.N.
REFERENCES


