Advances in Animal and Veterinary Sciences
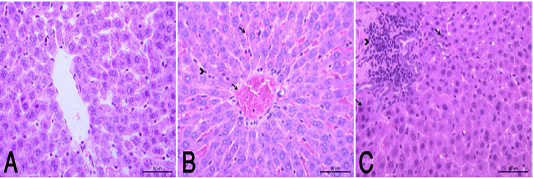
(A): Normal control group showed a normal histological structure of hepatic lobule . (HE X400). (B): HypoP liver showed congested blood vessels including sinusoids (arrow), mild degenerative changes and proliferation of Van Kupffer cells (arrow head). (HE X400) (C): HyperP liver showed necrosis of hepatocytes (arrow) associated with leuckocytic infiltration in the portal area (arrow head), and sever proliferation of Van Kupffer cells (HE X400).
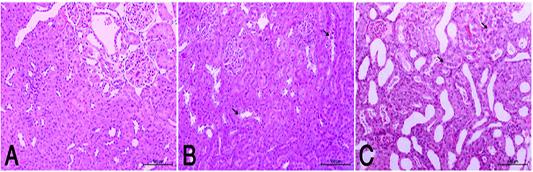
(A): Normal rats showed normal histologic structure of glomeruli (arrow) and renal tubules (arrow head). (HE X200). (B): HypoP kidney showed mild degenerative changes of renal lining epithelium (arrow) (HE X200). (C): HyperP kidney showed moderate degenerative changes associated of lining epithelium (arrow) (HE X200)
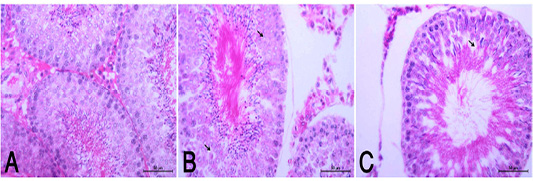
(A): Normal histological appearance of testes in rats of the control group (HE, X400). (B): HypoP testes showing mild degenerative changes (arrow) with minimal distortion of seminiferous tubules (HE, X400). (C): HyperP testes showing degrees of atrophic changes and necrotic changes of spermatogonial cell layer (arrow) with distortion of seminiferous tubules and disorganized germinal epithelia (arrow head) (HE, X400).
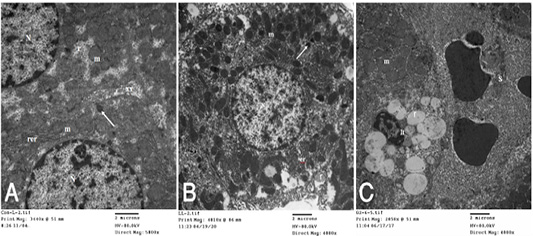
A): Transmission electron (TE) micrograph from liver of control group showing the normal ultrastructure of the hepatic cell ,having large vesicular nucleus (N) its chromatin clumped mostly at the periphery, mitochondria (m),rough endoplasmic reticulum (rer), free ribosomes (r), peroxisomes (arrow) and inter cellular bile canaliculi (xx) having microvilli. (B): T.E. micrograph of liver belonging to hypoprolactinemic group showing the hepatic cells nearly of normal morphological appearance and having large vesicular nucleus (N) and cytoplasm containing mitochondria (m), microbodies (arrow), rough endoplasmic reticulum (er) and few small fat globules (f). (C): T.E. micrograph of liver belonging to hyperprolactinemic group showing congestion of the hepatic sinusoids (S), the Ito cell (It) overloaded with fat globules (f) and swelling of the mitochondria (m) of the hepatic cell.
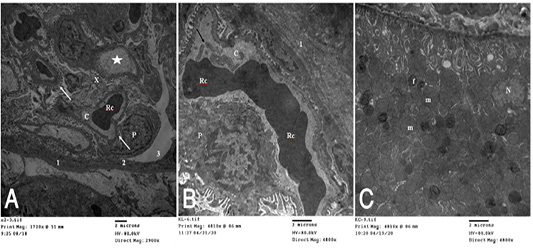
(A): T.E. micrograph of the kidney glomerulus from control group showing the Bawman,s capsule formed by outer thin fibrous layer (1) and inner flat epithelial cells forming the parietal epithelium of the glomerulus (2).The urinary space narrow (3).The capillary tufts (C) contain RBC,s (Rc) and plasma (star) and surrounded by visceral epithelial cells of the glomerulus or podocytes (P) which having primary and secondary processes (arrow). Notice in between presence of small amount of mesangial cell and matrix (X). (B): T.E. micrograph of kidney glomruli belonging to hypoprolactinemic group showing thickening of the fibrous layer of the Bawmen,s capsule (1), swelling of the podocytes (P) and congestion with clumping of the RBCs (Rc) of the capillary tufts (C) with presence of blood platelets (arrow). (C): T.E. micrograph of kidney tubules of hyperprolactinemic group showing marked swelling of the mitochondria (m) with presence of moderate amount of fat globules (f) in the lining epithelium and vesicular nucleus (N).


