Advances in Animal and Veterinary Sciences
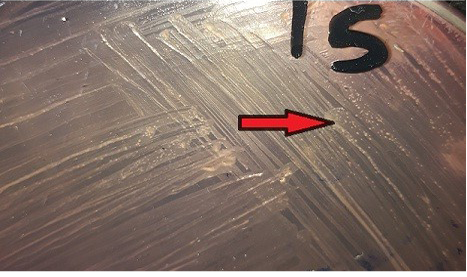
Colonies morphology of SCVs S.aureus on Mannitol salt agar media
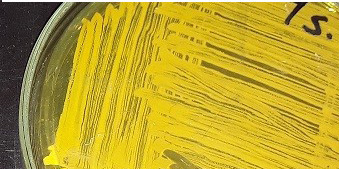
Heavy growth of yellow colonies of S.aureus on Mannitol salt agar media
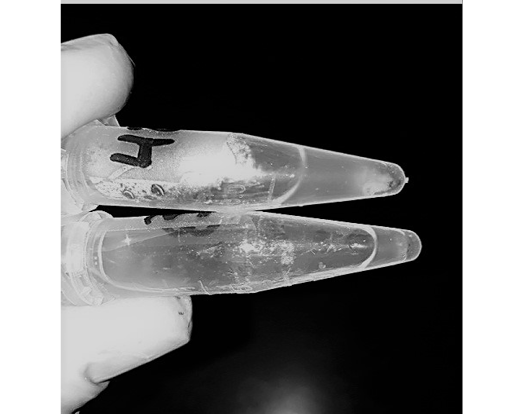
Differences between parent S.aureus (Positive) and SCVs S.aureus (Negative) in coagulase test
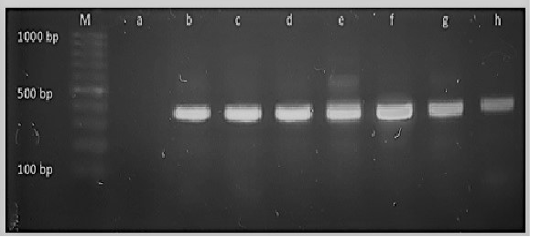
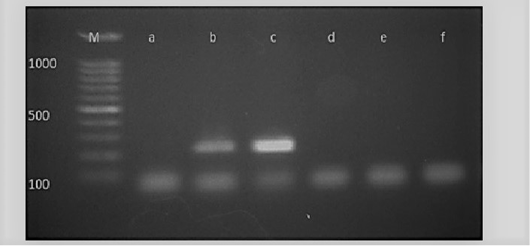
M: marker, Lane a: Negative control, Lane b: Positive control Lanes c-h: Positive amplification of 16Sr DNA gene at 375bp
M: marker, Lane a: Negative control, Lane b: Positive control, Lanes c: Positive amplification of nucA gene at 239 bp and Lane d-f: Negative amplification of nucA gene
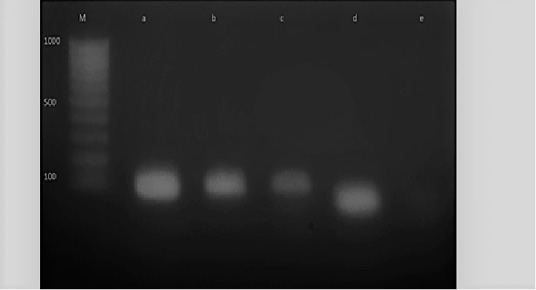
M: marker, Lane e: Negative control, Lane a: Positive control, Lane b and c: Positive amplification of nuc gene at 126 bp and Lane d: Negative amplification of nuc gene
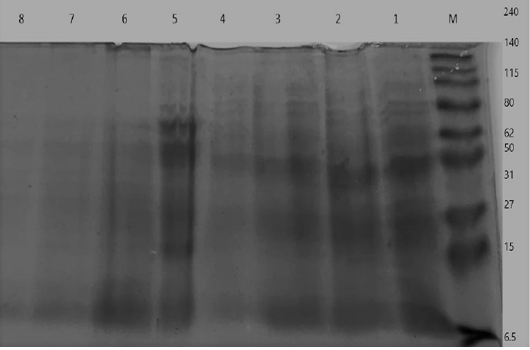
Electrophoretic whole cell protein profiles of different isolated bacteria Lane 1: Molecular size marker (M) with mol. wt. ranges from (6.5 to 240) KD. ; Lanes (1- 4): Staphylococcus bacterial isolates, Lanes (5-8): isolated SCVs.
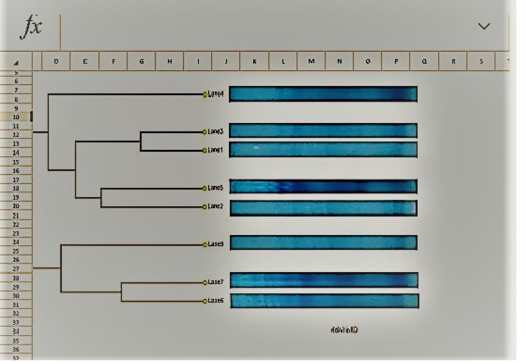
Dendrogram analysis of isolated parent Staphylococcus bacterial isolates, and SCVs


