Advances in Animal and Veterinary Sciences
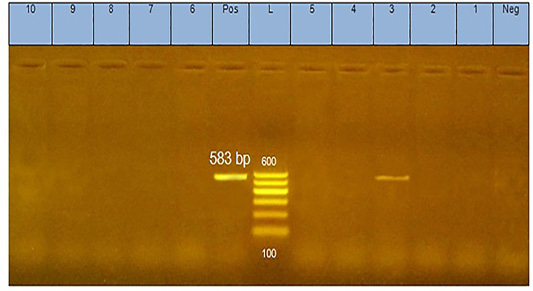
PCR products (583 bp in size) of amplified CAV-DNA extracted from the tissues of diseased chicks. Lane 3 is positive demonstrating the production of specific ampliconat 583bp; Lanes1, 2, 4, 5, 6,7, 8,9, and 10 are negative.
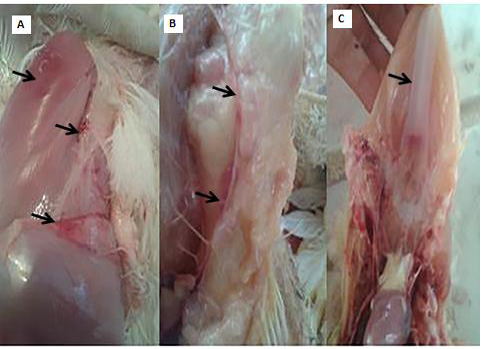
PM lesions of the CAV-infected group showing subcutaneous hemorrhages(A), thymic atrophy(B), and retardation of keel bone ossification(C).
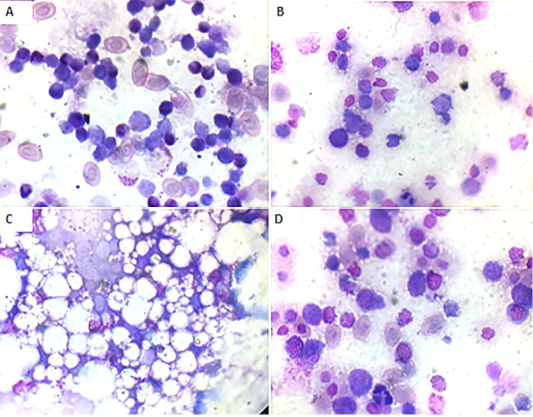
Bone marrow smear of the CAV-infected group, Giemsa stain X oil emersion lense: (A) 7 days post infection showing depletion of blood cells and their precursors.(B) 14 days post infection showing severe depletion of blood cells and their precursors. (C) 14 days post infection showing replacement with fat cells. (D) 21 days post infection showing increase in blood cells and their precursors.
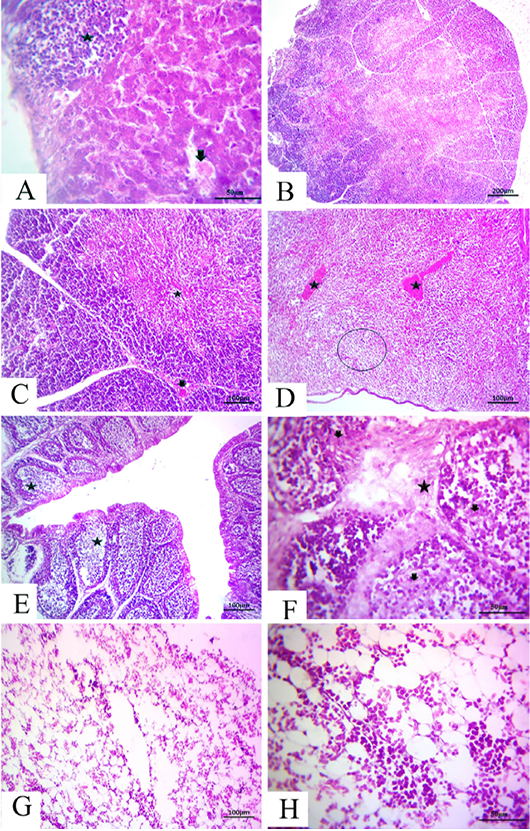
at (7 days old): (A):High magnification of the liver showing focal lymphocytic aggregations(star), widening and congested sinusoids (arrow), H&E×200. (B):Representative photomicrograph of the thymus section showing severe depletion of lymphocytes in the majority of lobules as well as both cortices, H&E×100. (C):Representative photomicrograph of the H&E-stained thymus section showing severe depletion of lymphocytes in the majority of lobules as well as both cortices (star) and medulla with congested interstitial blood vessels (arrow), H&E×100.. (D):Representative photomicrograph of the spleen section showing marked congested blood vessels (stars) subscapular lymphoid elements (circle), H&E×100. (E):Representative photomicrograph of the bursa of Fabricius section showing severe dilatation in the majority of follicles (stars), H&E×100. (F):Representative photomicrograph of the bursa of Fabricius section showing marked increase in interfollicular fibrous connective tissues (star), followed by necrotic follicular elements (arrows), H&E×100. (G): Representative photomicrograph of the bone marrow section showing marked decrease of all the hematopoietic series, H&E×100. (H): High magnification of the bone marrow showing depletion of the majority of hematopoietic series with marked fat globules, H&E×200.
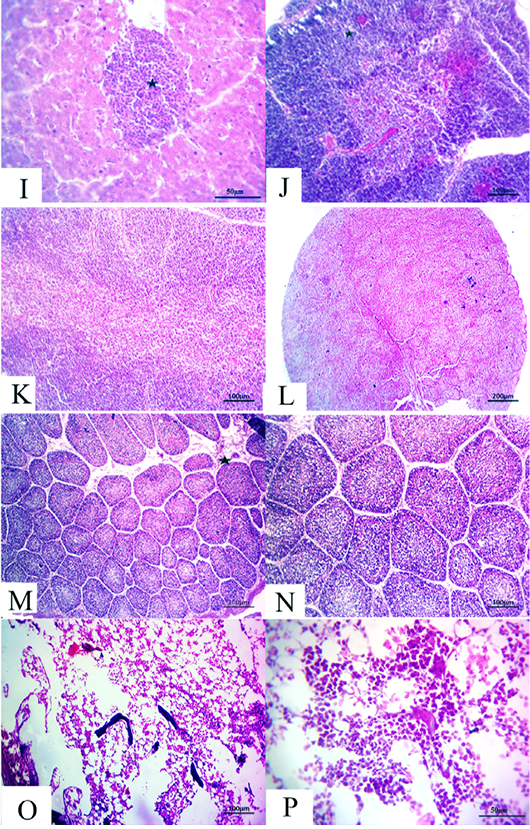
(14 days old): (I):High magnification of the liver showing inflammatory cell aggregations primarily mononuclear cells (star), H&E×200. (J):Representative photomicrograph of the thymus section showing nearly normal histomorphological structures with persistent mild depletion of medulla (star) besides widening of blood vessels, H&E×100. (K):Representative photomicrograph of the thymus section showing nearly normal histomorphological structures with persistent mild depletion, H&E×100. (L):Representative photomicrograph of the spleen section showing marked depletion of white pulpm H&E×100. (M):Representative photomicrograph of the bursa of Fabricius section showing marked interstitial edema (star) with prominent depletion of all follicles, H&E×100. (N):High magnification of the bursa of Fabricius showing the depletion of all follicles, H&E×200. (O):Representative photomicrograph of the bone marrow section showing marked depletion of all hematopoietic contents H&E×100. (P): High magnification of the bone marrow showing marked depletion of all hematopoietic contents H&E×200.
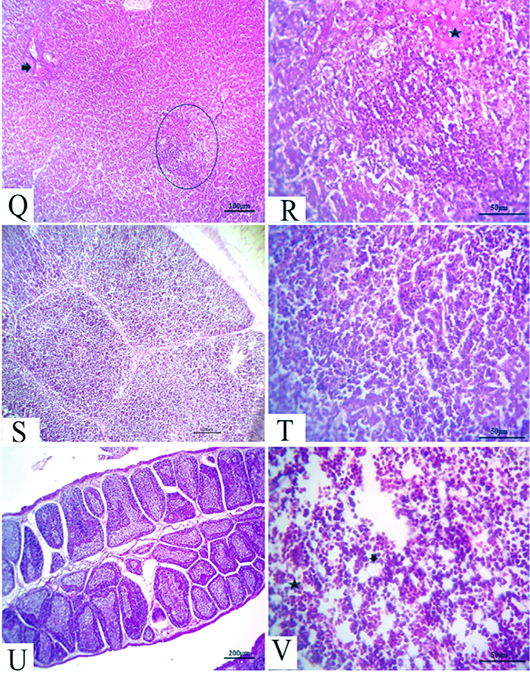
(21 days old): (Q):Representative photomicrograph of the liver section showing nearly normal hepatic structures with persistent mild congestion of blood vessels (arrow) besides persistent inflammatory cell aggregations, H&E×100. (R):High magnification of the liver showing lymphocytic aggregations with edema (star), H&E×200. (S):Representative photomicrograph of the thymus section showing nearly normal thymus structures, H&E×100. (T):Representative photomicrograph of the splenic section showing nearly normal splenic structures, H&E×100. (U):Representative photomicrograph of the bursa of Fabricius section showing nearly normal histomorphological structures H&E×100. (V):High magnification of the bone marrow showing all hematopoietic series (star) with limited fat globules (arrow), H&E×200.
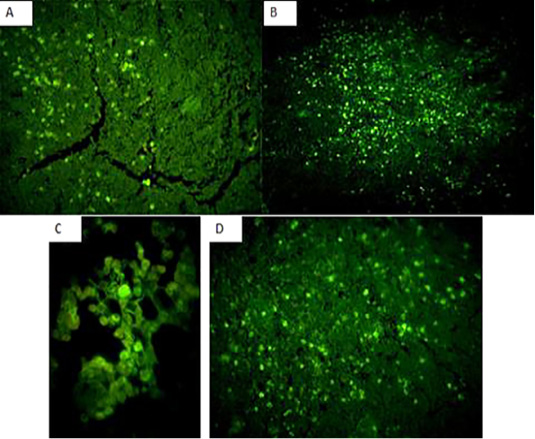
Fluorescent green-apple-colored CAV viral particles were observed inside the nuclei of hematopoeitic cells of the infected group,×200. (A and B): thymus,×200, (C): bone marrow,×400, and (D) spleen,×200.


